Batch and continuous biogenic hydrogen fermentation of acid pretreated de-oiled jatropha waste (DJW) hydrolysate†
Gopalakrishnan Kumar*ab,
Periysamy Sivagurunathanbc,
Chin-Chao Chend and
Chiu-Yue Linbe
aSustainable Management of Natural Resources and Environment Research Group, Faculty of Environmental and Labour Safety, Ton Duc Thang University, Ho Chi Minh City, Vietnam. E-mail: gopalakrishnankumar@tdt.edu.vn
bDepartment of Environmental Engineering and Science, Feng Chia University, Taichung 40724, Taiwan, Republic of China
cCenter for Materials Cycles and Waste Management Research, National Institute for Environmental Studies, Tsukuba, Japan
dEnvironmental Resources Laboratory, Department of Landscape Architecture, Chungchou Institute of Technology, Changhwa 51022, Taiwan, Republic of China
eGreen Energy Development Center, Feng Chia University, Taichung 40724, Taiwan, Republic of China
First published on 26th April 2016
Abstract
In an attempt to tailor the efficient hydrogen fermentation from hydrochloric acid-pretreated hydrolysate of de-oiled jatropha waste (DJW), batch tests were conducted to find the optimal hydrolysate concentration, temperature and pH. The optimal values were found as 10.2 g reducing sugar (RS) per L, 37 °C and 5.0, which were subsequently applied in a CSTR (continuously stirred tank reactor) using suspended biomass at various hydraulic retention times (HRTs). Peak hydrogen production rate (HPR) values were 0.86 L H2 per L per d and 0.15 L H2 per L per d from batch and CSTR operations, respectively. Lowering HRT (at 24 h) resulted in the wash-out of microbial biomass. Pretreatment enlarged the pore size of the unhydrolyzed biomass (UHB) from 0.6 to 3.9 mm3 g−1. The structural characterization of the unhydrolyzed biomass (UHB) was assessed via SEM, XRD and FTIR and BET. BET hysteresis loops proved that increased pore size might be attributed to better accessibility of microbes for enhancing hydrogen production performances.
1. Introduction
Wastewater/waste pollution along with the looming energy crisis due to population increase has necessitated environmentalist and energy research towards the prospect of the renewable and green energy sources for a sustainable future.1,2 In this context, bioenergy technologies, especially, dark fermentative hydrogen generation from wastewaters/lignocellulose or agricultural waste, stands as a promising way to treat the negatively valued wastes, meanwhile generating energy carriers, which are clean and sustainable in nature.3Exploring novel feedstocks for bioH2 generation is a vital step. BioH2 from lignocellulose/organic biomass is considered widely, due to the abundant availability and bio refinery scheme for an integrated product formation.3,4 Pretreatment methods for the extraction of the carbohydrate moiety bound in the cellulose of LCB is an important step towards its success in enhancing bioenergy production performances.5 Direct conversion of LCB into hydrogen via biological fermentation is a monotonous task due to the lower hydrogen yield and production rates. A plausible reason could be the obstinate nature of the LCB and the lack of cost-effective cellulolytic enzymes for breaking them. In this light, mild acid/alkali hydrolysis is still a propitious route to achieve a high sugar recovery and also a modest option towards industrial applications. An earlier investigation reported that concentrated sulfuric acid pretreatment of cotton cellulose at low temperature (40 °C, 55% H2SO4) can provide sugars up to as high as 73%; besides, further detoxification with anionic resin could give a hydrogen yield (HY) of 0.99 mol/molreducing sugar.6 In the other research, a reported HY of 22.1 mL g−1 TVS from dilute acid (1.5% H2SO4 at 121 °C, 60 min) pretreated cornstalk neutralized with dilute NaOH proved an easy utilization of pretreated hydrolysates by hydrogen producers.7
Biodiesel generation using jatropha biomass resulted in an enormous amount of organics, the so-called de-oiled jatropha waste (DJW), which has been explored as a feasible substrate for bioH2 fermentation.8 Optimizing the parameters for efficient hydrogen fermentation, especially while using mixed cultures, is a preliminary and necessary step towards success in a continuous system.9,10 In our previous study, acid (hydrochloric acid, 2%) pretreatment showed better performances than other pretreatment options.5,8 The BioH2 production process should be in a continuous mode to make it viable and economical. In earlier reports, shortening the hydraulic retention time (HRT) has been implemented as an enhancement strategy for hydrogen production and for different biomasses it has been varied from 48 to 6 h depending on the recalcitrance nature.11,12 Structural characterization of the pretreated biomass (via SEM, FTIR, XRD and BET analysis) would provide insights into the changes and severity of the pretreatment process, and thus it should elucidate a better understanding of the process.
Thus, considering all these factors mentioned above, in this study an attempt towards the optimization of H2 production from hydrochloric acid-pretreated DJW has been developed and the process performance in the batch and continuous systems evaluated. Additionally, the structural characterization of the pretreated solid biomass has been explored for a deep understanding of the pretreatment effects on the biomass and also the process parameters.
2. Materials and methods
2.1 Anaerobic microflora and pretreatment of DJW
The seed sludge was obtained from a municipal wastewater treatment plant which is situated in central Taiwan. The parameters were analyzed for the seed sludge and are represented as pH 6.9, alkalinity 1.40 g L−1 as CaCO3, volatile suspended solids (VSS) 40 g L−1 (represents biomass), total chemical oxygen demand (TCOD) 48.7 g L−1, soluble COD (SCOD) 2.7 g L−1, NH3–N 125 mg L−1 and total carbohydrate 6.7 g L−1 as glucose.13 The collected sludge was stored in a refrigerator to prevent any kind of biological changes. The sludge was heat treated at 80 °C for 1 h to eliminate methanogens. The DJW used in this study was collected from a jatropha biomass based biodiesel producing industry in central Taiwan.The cellulosic content was analyzed as 42% sugars (14% cellulose and 28% hemicellulose). All the reagents used were analytical grade unless specified. DJW acid hydrolysate was prepared using 2% HCl as the hydrolyzing agent with a solid to liquid ratio of 1![[thin space (1/6-em)]](https://www.rsc.org/images/entities/char_2009.gif) :
:![[thin space (1/6-em)]](https://www.rsc.org/images/entities/char_2009.gif) 10 (10 g DJW, 100 mL of 2% HCl) in an autoclave (121 °C for 15 min). DJW acid hydrolysate mainly contains the pentose sugar as xylose. The reducing sugar concentration of the enzymatic hydrolyzate of DJW was measured as 10.2 g L−1 with negligible amounts of inhibitors such as furfural (less than 0.1 g L−1). Besides, the elemental and proximate analyses of the UHB proved a C/N ratio of 37% and carbon content of 46% based on the dry matter as measured.
10 (10 g DJW, 100 mL of 2% HCl) in an autoclave (121 °C for 15 min). DJW acid hydrolysate mainly contains the pentose sugar as xylose. The reducing sugar concentration of the enzymatic hydrolyzate of DJW was measured as 10.2 g L−1 with negligible amounts of inhibitors such as furfural (less than 0.1 g L−1). Besides, the elemental and proximate analyses of the UHB proved a C/N ratio of 37% and carbon content of 46% based on the dry matter as measured.
2.2 Batch hydrogen fermentation test
Batch tests were conducted in serum bottles which hold a capacity of 150 mL. The working volume for all the batch fermentation was fixed as 60 mL, which included 40 mL of the hydrolysate, 12 mL of seed sludge, 3 mL for pH adjustment (either 1 N NaOH or 1 N HCl) and 5 mL of nutrient solution. The nutrient solution was made by mixing the following inorganic supplements (mg L−1): K2HPO4 125, MgCl2·6H2O 100, MnSO4·6H2O 15, FeSO4·7H2O 25, CuSO4·5H2O 5, and CoCl2·5H2O 0.12, which was modified from the formulation proposed by ref. 13. The pH was adjusted to 7.0 for temperature and substrate concentration experiments, and for pH optimization experiments from 4.5–7.5. The bottles were subjected to argon purging for 5 minutes to create an anaerobic environment. The batch vials were kept in an incubator with controlled rotation speed and temperature of 150 and 55 °C and 37 °C (temperature optimization tests); subsequent experiments were carried out at 37 °C. The gas production was measured at periodic intervals. The produced gas was measured with a glass syringe at room temperature. All the experiments were carried out in triplicate and the mean values are reported.2.3 CSTR reactor start-up and operation
A CSTR (continuously stirred tank reactor) lab-scale hydrogen fermenter (working volume, 1.0 L) was operated at hydraulic retention times (HRTs) of 24–48 h and an influent substrate concentration of 10.2 g reducing sugar (RS) per L (85 g volatile solids (VS) per L, 100 g total solids (TS) per L). Shortening the HRT was used as a strategy for improving the hydrogen production performance. Initially, the reactor was kept for 5 days in a batch mode to enrich the hydrogen producers. It was operated at a temperature of 37 °C (since both mesophilic and thermophilic showed a similar performance in batch reactions) and mixing was performed using a magnetic stirrer. pH was maintained using 1 N NaOH. Yeast extract (5 g L−1) was added to support the growth of the hydrogen producers, after few days of operation in the start-up. When a steady-state condition was reached and the desired data were obtained, the HRT was reduced. Steady-state conditions were reached when the product concentrations, such as hydrogen gas content and biogas production, were constant with a less than 10% deviation.2.4 Analytical procedures
The analytical procedures of Standard Methods of APHA14 were used to determine pH, COD, TS, VS, and VSS. The hydrogen and CO2 content were determined by a gas chromatograph (GC) having a thermal conductivity detector (China Chromatograph 8700T). The liquid samples were analyzed for SMP (alcohols and volatile fatty acids) using GC equipped with a flame ionization detector (FID). Biogas production and hydrogen measurement methods were explained in our earlier studies.13,15 During the CSTR operation, the monitoring parameters were pH, ORP (oxidation–reduction potential), volatile fatty acid (VFA) distribution and gas production. The hydrogen production efficiency was evaluated using the hydrogen content in the biogas, and hydrogen production rate (the rate of hydrogen production from the reactor, HPR).2.5 Kinetic modeling
The kinetic analysis was conducted by curve fitting using the Gompertz equation as follows,
 | (1) |
The Monod model (eqn (2)) was employed to describe the impact of substrate concentration on HPR values using the modified Gompertz equation.
 | (2) |
2.6 Structural and chemical characterization of the unhydrolysed biomass (UHB)
Scanning electron microscopy (SEM), Fourier transform infrared spectroscopy (FTIR) and Brunauer–Emmett–Teller (BET) analysis were done with the instrumentation facilities available in the university, technology business incubator. A scanning electron microscope (HITACHI, S3000H) was used to visualize the surface morphology and structure of the biomasses. The XRD pattern was recorded on a Bruker, D8SSS diffractometer, with Ni-filtered Cu Kα radiation as the X-ray source. The BET method was performed by N2 adsorption/desorption at −196 °C. Elementary analysis was performed by an elemental analyzer (model: Vario EL).3. Results and discussion
3.1 Optimization of hydrogen production from acid-pretreated hydrolysate by a batch system
Optimizing the parameters, such as substrate concentration, temperature and pH, is a preliminary step for developing efficient hydrogen fermentation systems.13,16 The incubation temperature depends on the nature of the feedstock materials, either raw lignocellulosic waste or the pretreated hydrolysate. The major reason for this discrepancy is the versatile sources of inoculum and different types of sugars employed. For example, acid pretreatment mainly releases the hemicellulose fraction, whereas enzymatic pretreatment releases glucose.17 Temperature is considered as an important parameter in many bioprocesses mainly due to the variation of the anaerobic organism's sensitivity, substrate conversion, enzyme activity promotion and microbial community variation.13An acid hydrolysate of DJW was converted into hydrogen at different substrate concentrations, temperature and pH (Table 1). The total biogas quantity varied from 59.3 ± 1.2 mL to 136.7 ± 8.3 mL. A maximal hydrogen production of 67.7 ± 3.8 mL was found at a DJW hydrolysate concentration of 100% (10.2 g RS per L), temperature 37 °C and pH 5.5. This was found as the optimal condition for hydrogen formation. Hydrogen fermentations at mesophilic and thermophilic temperatures of 37 and 55 °C were carried out at an initial cultivation pH of 7 at a 100% DJW acid hydrolysate concentration. Hydrogen production performance at 2 different temperature regimes, mesophilic and thermophilic, is shown in Table 1 and Fig. 1. The same level of hydrogen production potential (P) (62.5–65 mL) was observed for 37 and 55 °C fermentations. Previously, raw DJW showed a better performance in a thermophilic fermentation.13 However, in this study, the reducing sugars were released in hydrolysate and proved that mesophilic fermentation was more preferable than thermophilic fermentation. Dark fermentative hydrogen production using sewage sludge or mixed microflora has been demonstrated in mesophilic, thermophilic or extreme thermophilic temperatures; however, fermentation of lignocellulosic waste prefers mostly thermophilic conditions due to the efficient hydrolysis and better thermodynamics at elevated temperatures. In our previous study,13 a thermophilic temperature was demonstrated as feasible; however, raw DJW was used in that experiment. But in this study most of the sugars were recovered in hydrolysate form and, besides, the mesophilic regime showed a similar performance to the thermophilic. It is observed that hydrogen production performance did not vary much, but, interestingly, it is slightly increased at a mesophilic temperature than at a thermophilic one. The major reason for this attribution is the origin of mixed consortia originally obtained from mesophilic digester. Thus, to make the process in positive energy aspect, further experiments were carried out at a mesophilic temperature.
| Parameters | Final pH | Total biogas (mL) | Cumulative H2 (mL) | Rm (mL h−1) | P (mL) |
|---|---|---|---|---|---|
| a Initial pH 7.0. | |||||
| Temperaturea (°C) | |||||
| 37 | 6.0 ± 0.1 | 130.7 ± 3.1 | 64.3 ± 1.5 | 2.2 ± 0.4 | 64.0 ± 1.0 |
| 55 | 6.1 ± 0.2 | 123.3 ± 4.2 | 62.3 ± 1.5 | 2.1 ± 0.2 | 62.0 ± 0.5 |
![[thin space (1/6-em)]](https://www.rsc.org/images/entities/char_2009.gif) |
|||||
| Substrate concentrationa (%) | |||||
| 20 | 6.1 ± 0.2 | 59.3 ± 1.2 | 26.5 ± 0.5 | 0.9 ± 0.1 | 25.0 ± 1.0 |
| 40 | 5.8 ± 0.2 | 74.7 ± 1.4 | 34.7 ± 0.6 | 1.7 ± 0.4 | 34.5 ± 0.5 |
| 60 | 5.7 ± 0.7 | 98.0 ± 4.0 | 42.7 ± 1.5 | 1.9 ± 0.1 | 42.7 ± 0.3 |
| 80 | 5.9 ± 0.3 | 115.7 ± 5.5 | 51.3 ± 1.2 | 2.0 ± 0.3 | 51.5 ± 0.5 |
| 100 | 5.8 ± 0.4 | 130.3 ± 5.8 | 62.7 ± 1.2 | 2.2 ± 0.0.1 | 62.6 ± 0.4 |
![[thin space (1/6-em)]](https://www.rsc.org/images/entities/char_2009.gif) |
|||||
| pH | |||||
| 4.5 | 4.1 ± 0.2 | 68.0 ± 2.0 | 28.0 ± 2.3 | 1.3 ± 0.2 | 27.6 ± 1.0 |
| 5.0 | 4.8 ± 0.6 | 95.3 ± 3.1 | 45.3 ± 1.5 | 1.9 ± 0.3 | 43.7 ± 0.9 |
| 5.5 | 4.7 ± 0.7 | 136.7 ± 8.3 | 67.7 ± 3.8 | 2.2 ± 0.4 | 65.1 ± 0.5 |
| 6.0 | 5.1 ± 0.3 | 125.3 ± 3.1 | 61.0 ± 1.0 | 2.1 ± 0.3 | 60.2 ± 0.6 |
| 6.5 | 6.0 ± 0.8 | 113.3 ± 4.2 | 52.7 ± 2.1 | 2.0 ± 0.4 | 51.6 ± 0.7 |
| 7.0 | 6.3 ± 0.9 | 95.3 ± 4.2 | 46.7 ± 1.9 | 1.9 ± 0.3 | 45.7 ± 0.4 |
| 7.5 | 6.8 ± 0.4 | 89.3 ± 1.2 | 40.3 ± 3.2 | 1.8 ± 0.2 | 40.0 ± 0.2 |
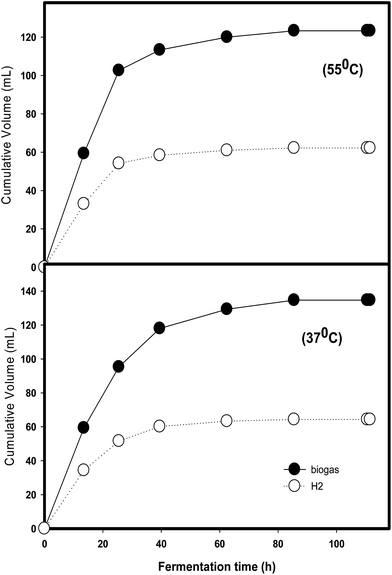 | ||
| Fig. 1 Hourly production of biogas and hydrogen at mesophilic and thermophilic temperatures via batch fermentation. | ||
Daily variation in biogas and hydrogen production at various substrate concentrations is depicted in Fig. 2. The production performances gradually increased from 20 to 100% and peaked at 100% with 62.7 ± 1.2 mL cumulative hydrogen. As per the modified Gompertz equation analysis, Rm values remained in the range of 0.9 ± 0.1 to 2.2 ± 0.0.1 mL h−1 from 20 to 100% represents that the HPR values positively increased with substrate concentrations. This proved that the hydrolysate obtained had very little (less than 0.1 g L−1, furfural) or no inhibitive material to the hydrogen producers. This result is slightly different to another study using wheat straw hydrolysate and reporting that a higher substrate concentration was lethal to hydrogen producers due to the marked presence of inhibitors such as 5-HMF.18
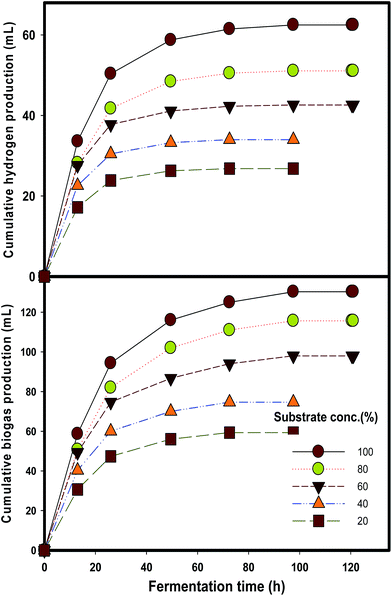 | ||
| Fig. 2 Hourly production of biogas and hydrogen at various substrate concentrations via batch fermentation. | ||
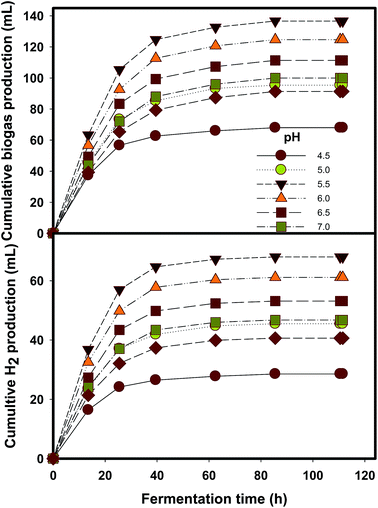
The mesophilic fermentation carried out at different initial cultivations pH of 4.5–7.5 is shown in Table 1 and Fig. 3. The P values fluctuated accordingly with the variations of initial pH values. For the seven pH values studied, peak hydrogen production of 67.7 ± 3.8 mL was obtained at pH 5.5. This reveals that hydrogen formation favors a moderate acidic pH environment, as supported by other studies.19,20 Next, higher hydrogen productions were obtained as 61.0 ± 1.0 and 52.7 ± 2.1 mL at pH 6.0 and 6.5, respectively. It might be concluded that lowering pH enhances the hydrogen production performance. However, pH 4.5 resulted in the lowest hydrogen production. The decrease of pH from the initial cultivation level (Table 1) resulted from the acid formation in the fermenter. Table 1 shows that a considerable pH reduction was observed after fermentation with pH around 5.6–6.0, providing a better hydrogen production performance. The possible reason for this was that the intermediate product VFAs gradually reduced the system pH.13
Kinetic modeling of hydrogen production rates and yield are depicted in Fig. 4. Process efficiency was determined in terms of hydrogen yield and it turned out that a peak HY 39.7 ± 0.7 mL H2 per g VS was achieved at higher substrate concentrations. The Monod model (eqn (2)) is generally regarded to elucidate the effect of substrate concentration in some biological processes.21,22 The experimental data obtained at different DJW hydrolysate concentrations ranging from 20 to 100% were fitted to the model and the kinetic constants were determined. The results are shown in Fig. 2. The Rmax, and saturation constant (Ks) (the substrate concentration at which the reaction rate is reduced to half of its maximum value) values were estimated from regression analysis as 1227 mL H2 per L per d and 39%. The coefficient of determination (R2) was more than 0.9 indicating that the model is reliable. This proved that a progressive increase could be attained by increasing substrate concentration.
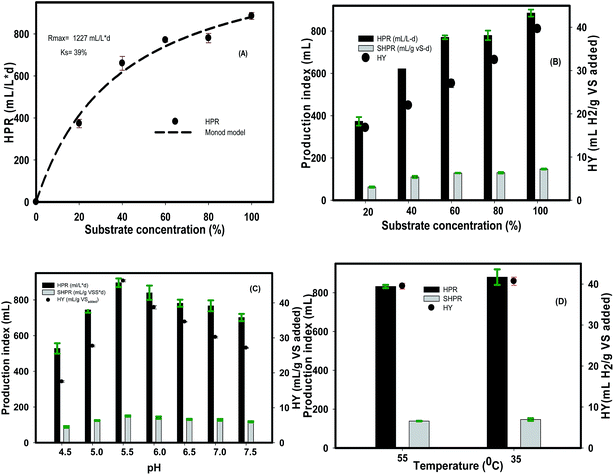 | ||
| Fig. 4 Hydrogen production from the hydrolysate at Monod model (A) various substrate concentrations (B), pH (C) and temperature (D) via batch fermentation. | ||
3.2 Continuous hydrogen production at various HRT
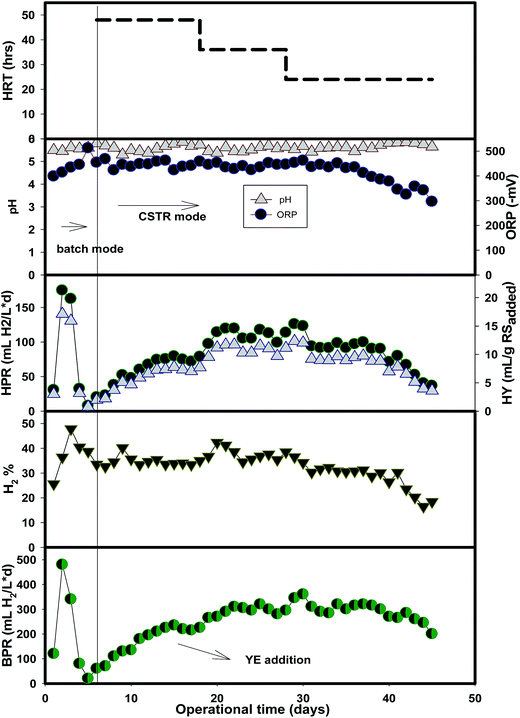
A continuous hydrogen production system would be necessary to make a process commercially viable.23 The hydrolysate obtained at 100 g L−1 biomass was used for the CSTR operation. The variations in HPR, BPR, pH and ORP during the 45 days of operation are represented in Fig. 5. Table 2 summarizes the production performances. The biogas production gradually increased in accordance with the HRT reduction. pH was in the range of 5.5–5.9. HRT was set initially at 48 h and then gradually reduced to 24 h, where the production performance was started to decrease due to the cell washout. For fermentative hydrogen production, washout of biomass primarily would occur at lower HRT in case of CSTR operation and ultimately would result in system instability or inefficient production performances.24| Parameters | HRT (h) | ||
|---|---|---|---|
| 48 | 36 | 24 | |
| BPR (mL L−1 d−1) | 217 ± 12 | 296 ± 15 | 306 ± 12 |
| HPR (mL L−1 d−1) | 74 ± 4 | 111 ± 7 | 93 ± 3 |
| HY (mL per g RSadded) | 7.3 ± 0.40 | 10.9 ± 0.88 | 6.1 ± 1.9 |
| H2 content (%) | 34.2 ± 0.76 | 37.8 ± 2.3 | 30.7 ± 0.99 |
| Biomass (g VSS per L) | 2.18 ± 0.2 | 1.49 ± 0.3 | 1.08 ± 0.4 |
Almost all the sugars in the hydrolysate were pentoses (such as xylose and arabinose) as the HPLC results revealed from our previous finding.5 The amount of inhibitors was less, though some reports mentioned that acid hydrolysis generated high values of inhibitors.25,26 Cui et al. (2010) mentioned that HCl could generate less inhibitors and less harshness to the xylose fraction. This was similar in our case also, as HCl generated less amount of inhibitors (<0.1 g L−1 furfural). Continuous hydrogen production is more sustainable while the HPR is stable. The main advantage of the continuous process over the batch or semi batch process is the negative partial pressure, which is proved as the main inhibitor of hydrogen production.27 Thus, developing an efficient continuous system could improve the process efficiency.
As could be seen from Fig. 5, hydrogen production was slightly enhanced after supplementing the external nitrogen source (yeast extract, 5 g L−1) on day 11, with a remarkable increase in HY from 5.1 mL per g RSadded to over 7.0 mL per g RSadded from day 13 to 18 at a longer HRT of 48 h. The HY further increased to a value of 10.9 ± 0.88 mL per g RSadded during the steady state conditions of 36 h HRT and declined to 6.1 ± 1.9 mL per g RSadded at a shorter HRT of 24 h. The HPR also followed a similar pattern with a peak value of 111 ± 7 mL L−1 d−1 at 36 h HRT. This HPR value lies in the range of 127 to 187 mL L−1 d−1 obtained from a dilute acid pretreatment of lignocellulosic hydrolyzates (Table 3) in a continuous production. However, the HPR values obtained from batch fermentation were slightly higher and ranged between 370 and 483 mL L−1 d−1. Additionally, the observed value in the CSTR operation (880 mL L−1 d−1) of this study is slightly higher when compared to the thermally pretreated DJW.28 These results are attributed to the fact that the feedstock composition, pretreatment methods and reactor type greatly influenced the overall performances of the hydrogen fermentation of lignocellulosic hydrolysate.
| Microbiome | Substrate | Reactor type | HRT (h) | HPR (mL L−1 d−1) | Reference |
|---|---|---|---|---|---|
| a CSTR – continuous stirred tank reactor, AF – anaerobic baffled. | |||||
| Anaerobic mixed culture | Wheat straw | CSTR | 72 | 184 | 18 |
| Anaerobic mixed culture | Wheat straw | AF | 24 | 127 | 12 |
| Anaerobic mixed culture | Deoiled jatropha waste | CSTR | 24 | 111 | This study |
| Anaerobic mixed culture | Sugarcane baggase | Batch | N.A | 370 | 35 |
| Anaerobic mixed culture | Deoiled jatropha waste | Batch | N.A | 483 | 8 |
| Anaerobic mixed culture | Deoiled jatropha waste | Batch | N.A | 880 | This study |
Unlike sugar-rich wastewaters, lignocellulosic biomass hydrolyzates contain some growth-inhibiting furan derivatives (5-HMF (hydroxymethyl furfural), furfural) along with their sugars fraction. These furan derivatives are generated from C5 and C6 sugar components of the lignocellulosic biomass during pretreatment, which is generally not avoidable but can be reduced through optimization of the pretreatment conditions, such as exposure time, temperature, solid loadings, catalyst concentrations and so on, to get the maximal sugar recovery with reduced end product turn outs.3 It is also reported that hydrogen production was completely suppressed from the dilute acid pretreated hydrolyzates of rice straw,29 whilst further detoxification with calcium carbonate and activated carbon promotes the production. The observed lower HPR (111 ± 7 mL L−1 d−1) and HY (10.9 ± 0.88 mL per g RSadded) during the continuous operation might result from the low amount of sugar (10.2 g L−1) retrieved during pretreatment. Besides, the major portion was xylose, which is not a suitable sugar for H2 fermentation compared to glucose. Hence further detoxification or enzyme treatment of the ligno-cellulose fraction is recommended for improving hydrogen production from dilute acid-pretreated DJW.
3.3 Structural and chemical characterization of unhydrolyzed biomass (UHB) after the hydrolysis process
| Characteristics | Raw | HCl-treated |
|---|---|---|
| a Dry basis. | ||
| Proximate analysis (wt%) | ||
| Moisture | 8.64 ± 1.42 | 8.16 ± 1.43 |
| Ash | 1.48 ± 0.60 | 1.23 ± 0.80 |
| Pore volume (mm3 g−1) | 0.6 ± 0.1 | 3.9 ± 0.2 |
![[thin space (1/6-em)]](https://www.rsc.org/images/entities/char_2009.gif) |
||
| Elemental analysis (wt%) | ||
| C | 45.01 ± 0.74 | 45.40 ± 0.18 |
| H | 7.24 ± 0.49 | 7.17 ± 0.18 |
| N | 4.62 ± 0.64 | 1.40 ± 0.36 |
| S | 0.35 ± 0.05 | 0.14 ± 0.02 |
| C/N ratio | 9.88 ± 1.60 | 36.83 ± 8.73 |
| HHV (kcal kg−1)a | 4799.4 ± 4.7 | 4708.7 ± 16.7 |
3.4 Technical issues and responsible causes
The stable operation of a continuously feeding reactor in dark fermentative hydrogen production has many issues, especially while using a suspended biomass. Shortening the HRT by increasing the flow rate of the substrate increases the threshold pressure inside the reactor that ultimately results in a biomass washout and system failure. In this study, a similar phenomenon was also observed.24 Additionally, the kinetics of the batch and CSTR system are governed by different factors, though similar compositions of nutrients and other components are used. The kinetics of the CSTR is governed by many factors, including the rotation speed, mass transfer and also the activity of the microorganisms. In the batch experiments, hydrogen producers tend to face the stationary phase and then the declined phase due to the limited amount of nutrients available inside the reactor. Besides, the HPR is decided based on the exponential phase. However, in the case of the CSTR, the continuous supply of nutrients changes this factor, in addition to the other factors mentioned above, along with the accumulation of furfural inhibitor. This could be the possible reason for the lower production performances in continuous systems.Recently, general/industrial process disturbances, such as acidification, starvation, alkanification and shock loading, were studied in an immobilized system which successfully overcame these barriers after a certain period, due to a strong biomass residence provided by the immobilized carriers.33 As can be seen from Table 2, biomass washed-out rapidly (2.18 to 1.08 g VSS per L) while the HRT was shifted from 48 to 24 h. Besides, the presence of inhibitors and other toxic compounds (which are not reported) in the hydrolysate, as reported earlier, could be lethal to hydrogen-producing microorganisms.18 Using red algae hydrolysate for the biohydrogen production without a detoxification step has been reported to significantly lower production performances, and neutralization by activated carbon would recover the production performances.34 Thus, detoxification or the immobilization of the biomass is recommended for enhancing production performances.
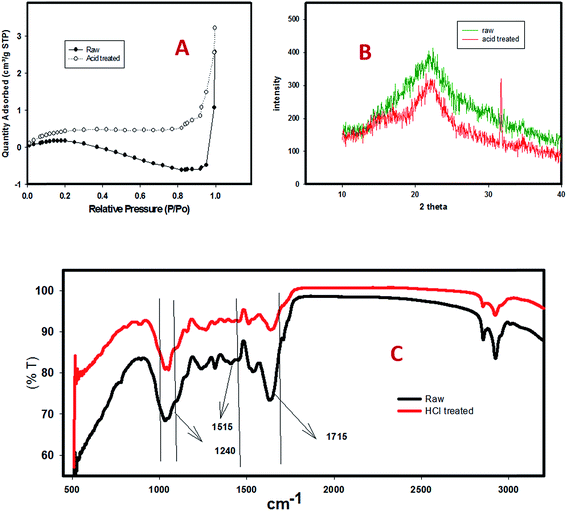
In this investigation, the major mechanism suggested is the bio-fermentation of organic matter to various intermediate products such as volatile fatty acids (VFAs) and the formation of hydrogen gas, before entering into the methane formation, which has been terminated by the applied heat pretreatment method of the seed inoculum. Substrate pretreatment via HCI acid resulted in the distribution of glucose and xylose fractions (details are provided in the M&M section). Structural analysis revealed the semi-crystalline nature of the cellulose, which is degraded by the Cl ions of the HCl acid. Characterization of the leftover biomass dispenses the further application of this reported system.
UHB showed a high heating value (HHV) of 5.2 kcal kg−1 (Table 3), which represents that more energy could be recovered. However, the moisture content of the biomass should be considered as an important efficiency-affecting factor, since the gasification process is not recommended for a biomass having high moisture, mainly because the moisture could utilize more heat. Thus, this would result in a net negative energy gain of the process. Besides, studying the impact of the glucose/xylose ratio by mixing the hydrolysates with glucose or the enzyme extract of UHB is recommended to develop a sustainable H2 production process from DJW.
4. Conclusions
This study has demonstrated that an acid (2%, HCl) hydrolysate of DJW could be a propitious substrate for hydrogen fermentation. The optimized batch substrate concentration (without dilution, 100%, = 10.2 g L−1), mesophilic temperature and pH (5.5), applied in a continuous operation showed a peak hydrogen yield (HY) of 11 mL per g RSadded and H2 content of ∼38%. XRD and FTIR analysis proved that the UHB is cellulose crystalline in nature. Establishment of a stable biomass system (preferably immobilized cells) is necessary to cope with the shorter HRT while using suspended cell systems in CSTR operations.Acknowledgements
The authors gratefully acknowledge the financial support by Taiwan's Bureau of Energy (grant no. 101-D0204-3), Taiwan's National Science Council (NSC-99-2221-E-035-024-MY3, NSC-99-2221-E-035-025-MY3, NSC-99-2632-E-035-001-MY3, and NSC-101-2218-E-035-003-MY3), and Feng Chia University (FCU-10 G 27101). We also thank Hua Neng Environmental Protection and Energy Technology Ltd., Taiwan, for providing us with the deoiled Jatropha waste. Prof. An-Ya Lo and Biswarup Sen are highly acknowledged for their support during the structural characterization of the biomass. Gopalakrishnan Kumar is highly acknowledged for the financial assistance from Ton Duc Thang University, Vietnam.References
- J. A. Turner, Science, 2004, 305, 972–974 CrossRef CAS PubMed.
- P. Sivagurunathan, G. Kumar and C. Y. Lin, Int. J. Hydrogen Energy, 2014, 39, 6881–6888 CrossRef CAS.
- G. Kumar, P. Bakonyi, S. Periyasamy, S. H. Kim, N. Nemestóthy and K. Bélafi-Bakó, Renewable Sustainable Energy Rev., 2015, 44, 728–737 CrossRef CAS.
- A. Ghimire, L. Frunzo, F. Pirozzi, E. Trably, R. Escudie, P. N. L. Lens and G. Esposito, Appl. Energy, 2015, 144, 73–95 CrossRef CAS.
- G. Kumar, B. Sen and C. Y. Lin, Bioresour. Technol., 2013, 145, 275–279 CrossRef CAS PubMed.
- C. Y. Chu, S. Y. Wu, C. Y. Tsai and C. Y. Lin, Int. J. Hydrogen Energy, 2011, 36, 8743–8750 CrossRef CAS.
- C. M. Pan, H. C. Ma, Y. T. Fan and H. W. Hou, Int. J. Hydrogen Energy, 2011, 36, 4852–4862 CrossRef CAS.
- G. Kumar, B. Sen, P. Sivagurunathan and C. Y. Lin, Int. J. Hydrogen Energy, 2015, 40, 10766–10774 CrossRef CAS.
- C. H. Lay, I. Y. Sung, G. Kumar, C. Y. Chu, C. C. Chen and C. Y. Lin, Int. J. Hydrogen Energy, 2012, 37, 16473–16478 CrossRef CAS.
- P. Sivagurunathan, G. Kumar, J. H. Park, J. H. Park, H. D. Park, J. J. Yoon and S. H. Kim, Int. J. Hydrogen Energy, 2016, 41, 4393–4403 CrossRef CAS.
- G. Kumar, J. H. Park, M. S. Kim, D. H. Kim and S. H. Kim, Int. J. Hydrogen Energy, 2014, 39, 20625–20631 CrossRef CAS.
- P. Kongjan and I. Angelidaki, Bioresour. Technol., 2010, 101, 7789–7796 CrossRef CAS PubMed.
- G. Kumar and C. Y. Lin, Int. J. Hydrogen Energy, 2013, 38, 63–72 CrossRef CAS.
- A. W. W. A., American Public Health Association and Water Environment Federation, Standard methods for the examination of water and wastewater, APHA, AWWA and WEF, Washington, D.C., USA, 20th edn, 1998 Search PubMed.
- G. Kumar, C. H. Lay, C. Y. Chu, J. H. Wu, S. C. Lee and C. Y. Lin, Int. J. Hydrogen Energy, 2012, 37, 15489–15495 CrossRef CAS.
- C. Y. Lin, C. H. Lay, B. Sen, C. Y. Chu, G. Kumar, C. C. Chen and J. S. Chang, Int. J. Hydrogen Energy, 2012, 37, 15632–15642 CrossRef CAS.
- N. Ren, A. Wang, G. Cao, J. Xu and L. Gao, Biotechnol. Adv., 2009, 27, 1051–1060 CrossRef CAS PubMed.
- P. Kongjan, S. O-Thong, M. Kotay, B. Min and I. Angelidaki, Biotechnol. Bioeng., 2010, 105, 899–908 CAS.
- S. V. Ginkel, S. Sung and J. J. Lay, Environ. Sci. Technol., 2001, 35, 4726–4730 CrossRef CAS PubMed.
- J. J. Lay, Y. J. Lee and T. Noike, Water Res., 1999, 33, 2579–2586 CrossRef CAS.
- Y.-S. Chuang, C. H. Lay, B. Sen, C. C. Chen, K. Gopalakrishnan, J. H. Wu, C. S. Lin and C. Y. Lin, Int. J. Hydrogen Energy, 2011, 36, 14195–14203 CrossRef CAS.
- J. Wang and W. Wan, Int. J. Hydrogen Energy, 2009, 34, 3313–3323 CrossRef CAS.
- E. Tapia-Venegas, J. Ramirez-Morales, F. Silva-Illanes, J. Toledo-Alarcón, F. Paillet, R. Escudie, C. H. Lay, C. Y. Chu, H. J. Leu, A. Marone, C. Y. Lin, D. H. Kim, E. Trably and G. Ruiz-Filippi, Rev. Environ. Sci. Bio/Technol., 2015, 14, 761–785 CrossRef CAS.
- C. C. Chen, C. Y. Lin and J. S. Chang, Appl. Microbiol. Biotechnol., 2001, 57, 56–64 CrossRef CAS PubMed.
- M. Cui, Z. Yuan, X. Zhi, L. Wei and J. Shen, Int. J. Hydrogen Energy, 2010, 35, 4041–4047 CrossRef CAS.
- A. M. J. Kootstra, H. H. Beeftink and J. P. M. Sanders, Ind. Crops Prod., 2011, 34, 972–978 CrossRef CAS.
- E. W. J. van Niel, P. A. M. Claassen and A. J. M. Stams, Biotechnol. Bioeng., 2003, 81, 255–262 CrossRef CAS PubMed.
- G. Kumar, P. Sivagurunathan, J. H. Park and S. H. Kim, Arabian J. Sci. Eng., 2015, 40, 2117–2122 CrossRef CAS.
- A. C. C. Chang, Y. H. Tu, M. H. Huang, C. H. Lay and C. Y. Lin, Int. J. Hydrogen Energy, 2011, 36, 14280–14288 CrossRef CAS.
- S. Lowell, J. E. Shields, M. A. Thomas and M. Thommes, Characterization of Porous Solids and Powders: Surface Area, Pore Size and Density, Springer, Netherlands, 2006 Search PubMed.
- K. Karimi and M. J. Taherzadeh, Bioresour. Technol., 2016, 200, 1008–1018 CrossRef PubMed.
- C. K. Nitsos, K. A. Matis and K. S. Triantafyllidis, ChemSusChem, 2013, 6, 110–122 CrossRef CAS PubMed.
- J. H. Park, G. Kumar, J. H. Park, H. D. Park and S. H. Kim, Bioresour. Technol., 2015, 188, 109–116 CrossRef CAS PubMed.
- J. H. Park, H. C. Cheon, J. J. Yoon, H. D. Park and S. H. Kim, Int. J. Hydrogen Energy, 2013, 38, 6130–6136 CrossRef CAS.
- R. P. Ratti, T. P. Delforno, I. K. Sakamoto and M. B. A. Varesche, Int. J. Hydrogen Energy, 2015, 40, 6296–6306 CrossRef CAS.
Footnote |
| † Electronic supplementary information (ESI) available. See DOI: 10.1039/c6ra05628h |
| This journal is © The Royal Society of Chemistry 2016 |

