“Soluble” vs. “insoluble” Prussian blue based catalysts: influence on Fenton-type treatment†
Lucila I. Doumic*ab,
Gabriel Saliernob,
Cinthia Ramosc,
Patricia M. Haurea,
Miryan C. Cassanellob and
María A. Ayudea
aDivisión Catalizadores y Superficies-Instituto de Investigaciones en Ciencia y Tecnología de Materiales – INTEMA, Departamento de Ingeniería Química, Universidad Nacional de Mar del Plata, J.B. Justo 4302, 7600 Mar del Plata, Argentina. E-mail: luciladoumic@gmail.com; luciladoumic@fi.mdp.edu.ar; Fax: +54 0223 4810046; Tel: +54 0223 4816600 242
bLaboratorio de Reactores y Sistemas para la Industria – LARSI, Departamento Industrias, Facultad Ciencias Exactas y Naturales, Universidad de Buenos Aires, Intendente Güiraldes 2620, C1428BGA, Buenos Aires, Argentina
cGIyA, Centro Atómico Constituyentes, CNEA, 1600, San Martín, Argentina
First published on 3rd May 2016
Abstract
The influence of the synthesis procedure of supported Prussian blue nanoparticles (PBNP) on their activity and stability as a Fenton-type catalyst is studied. Hence, two catalysts are synthesized by adsorbing onto a support of PBNP formed ex situ through the reaction between FeCl3 and K3Fe(CN)6 using H2O2 as reducing agent, and following different washing protocols. A third catalyst is prepared through a two-step impregnation process with FeCl3 and K4[Fe(CN)6] aqueous solutions. The catalysts are tested in the orange G Fenton-type oxidation. The fresh and used catalysts are characterized by BET surface area, SEM, EDS, TEM, Mössbauer spectroscopy, total iron content and UV-vis spectrophotometry. It is demonstrated that under the synthesis conditions employed, the “insoluble” form of Prussian blue is promoted in the ex situ procedure, whereas the two-step impregnation process leads to the “soluble” Prussian blue formation. The washing of the just-prepared catalysts at the reaction temperature helps in eliminating the unreacted species. Those catalysts based on “insoluble” Prussian blue nanoparticles exhibit better behaviour in terms of stability. Significant removals are attained (100% azo dye, 60% TOC), at pH = 3, 343 K after thirteen successive cycles of 300 min. The best catalyst displays the smallest amount of total “free” Fe leached without releasing PBNP, ferrocyanide or ferricyanide ions into the reaction media. Reversible adsorption–desorption of organic intermediates avoids the loss of activity due to blockage of sites and/or pores.
1. Introduction
The use of iron based heterogeneous catalysts for the Fenton-type remediation of organic pollutants in water is highly convenient considering the economic and environmentally friendly reactants involved. These processes are complex since the activity of the catalyst depends on its characteristics (surface area, iron content and/or iron oxidation state and bonding environment). Nevertheless, heterogeneous mechanisms for the decomposition of hydrogen peroxide on the surface of oxides, oxyhydroxides, iron hydroxides, etc., are described in literature following reactions similar to those that appear in homogeneous Fenton.1–4 In the surface-catalysed mechanism, hydroxyl radicals (HO˙) are formed from the reaction between H2O2 molecules adsorbed and the surface active sites, according to:
![[triple bond, length as m-dash]](https://www.rsc.org/images/entities/char_e002.gif) Fe(II) + H2O2 → Fe(II) + H2O2 → ![[triple bond, length as m-dash]](https://www.rsc.org/images/entities/char_e002.gif) Fe(II) + HO˙ + OH− Fe(II) + HO˙ + OH−
| (1) |
![[triple bond, length as m-dash]](https://www.rsc.org/images/entities/char_e002.gif) Fe(II) + H2O2 → Fe(II) + H2O2 → ![[triple bond, length as m-dash]](https://www.rsc.org/images/entities/char_e002.gif) Fe(II) + HO2˙ + H+ Fe(II) + HO2˙ + H+
| (2) |
The hydroxyl radicals are able to attack the organic pollutants, either sorbed or in aqueous phase, or to react with H2O2 to form hydroperoxyl radicals (HO2˙):
| HO˙ + organic compounds → intermediate products → CO2 + H2O | (3) |
| HO˙ + H2O2 → HO2˙ + H2O | (4) |
HO2˙ may contribute at a slower rate to the organic compounds degradation, but can also promote scavenger reactions with H2O2 or the active sites:
| HO2˙ + organic compounds → products | (5) |
| HO2˙ + H2O2 → HO˙ + H2O + O2 | (6) |
HO2˙ + ![[triple bond, length as m-dash]](https://www.rsc.org/images/entities/char_e002.gif) Fe(III) → H+ + O2 + Fe(III) → H+ + O2 + ![[triple bond, length as m-dash]](https://www.rsc.org/images/entities/char_e002.gif) Fe(II) Fe(II)
| (7) |
As in homogeneous Fenton and Fenton-type processes, the limiting step is the rate of conversion of ferric to ferrous iron (eqn (2)). In this sense, mixed valence compounds appear as an interesting alternative to accelerate the Fenton-type process without the need of external energy.5 Among all the related studies in the literature, the presence of ferrous besides the ferric iron in the catalyst structure has shown to enhance the production of hydroxyl radicals and therefore the catalytic activity.4,6,7
Prussian blue (PB) has attracted researcher's attention due to its low toxicity and relatively simple and economic synthesis processes.8–10 PB is a mixed valence compound in which Fe(II) ions are surrounded octahedrically by the carbon atoms of cyanide ions, while Fe(III) ions are linked at the nitrogen ends of the cyanides.11 The remaining charge is balanced either by ferric ions as in the “insoluble” PB, or by potassium ions, as in the “soluble” PB. Both compounds are insoluble in water so these terms are related to the capacity of PB to remain in solution as a colloidal suspension.12
Prussian blue colloids have shown good catalytic activity in the photo Fenton oxidation of rhodamine B.8 Besides, Prussian-blue-modified γ-Fe2O3 magnetic nanoparticles8–10 and Prussian blue/titanium dioxide nanocomposites13 have been tested in the Fenton-type and photo-Fenton treatments of different organic compounds. It was observed that the catalytic activity increased with the content of PB, attributing this trend to the presence of ferrous ions in PB structure. Regarding stability, a slight decrease in the activity after 4 cycles was attributed to the loss and aggregation of the nanoparticles during the cycling process, and the adsorption of contaminants on reactive sites of the catalyst.
The recovery of nanoparticles represents a shortcoming in their application as heterogeneous Fenton-type catalysts. Even though the use of magnetic nanoparticles has been proposed to overcome this issue, its magnetism favours their aggregation, reducing their lifetime.14,15 In this sense, immobilization of nanoparticles onto inorganic supports allows easy separation and reuse of the catalyst.16 In particular, the use of alumina as nanoparticles support in Fenton-type catalysts has been reported. Lim et al.17 suggested that the presence of aluminium increases the dispersion of the active phase and facilitates the redox cycle of iron species. Moreover, Xia et al.18 concluded that aluminium favours the adsorption of H2O2 and its efficient decomposition into highly active species.
Doumic et al.19 supported Prussian blue nanoparticles on alumina and tested this material as heterogeneous Fenton-type catalysts for orange G oxidation. Operating conditions were carefully selected to favour the oxidation over the adsorption of the contaminant. At a given set of operating conditions, catalyst activity remains almost invariable along nine cycles of 300 min, attaining almost complete dye discolouration, more than 98% of oxidant consumption and 60% of Total Organic Carbon (TOC) removal.
Taking into account the potential of PBNP over alumina as efficient Fenton-type catalyst, and aiming to improve its performance and to disclose the nature of the catalytic species, further studies were conducted in our laboratory. The peroxidation of orange G is studied using alumina-based catalysts synthesized following different PBNP synthesis procedures. The nature of PBNP formed (“soluble” or “insoluble”) and of the leached iron species (ferricyanide and ferrocyanide ions, “free” iron and PBNP) is elucidated through further characterization procedures.
2. Experimental methodology
All chemicals used for catalyst preparation and oxidation tests were analytical grade without any further purification.2.1. Catalysts preparation and characterization
The γ-Al2O3 spheres (SASOL, dp = 2.5 mm) used as support were washed with distilled water at room temperature and dried for 12 h at 110 °C. PBNP adsorbed onto γ-Al2O3 catalysts were synthesized following different procedures.The synthesis method used in Doumic et al.19 was followed to produce the batch 1 (B1). An aqueous solution of FeCl3 13 mmol L−1 and K3[Fe(CN)6] 10 mmol L−1 at pH 2 was prepared. Then, H2O2, in a slight substoichiometric ratio, was added suddenly to produce the ex situ PBNP. Afterwards, the PBNP suspension was left in contact with the γ-Al2O3 beads for 1 h under orbital shaking. Thereafter, PBNP/γ-Al2O3 spheres were separated by screening, washed at room temperature (∼293 K) with HCl acidified water (pH = 2) until the wash water was free from PBNP, ferricyanide/ferrocyanide species; and then dried in air at room temperature.
Batch 2 (B2) was identically synthesized but the catalyst was washed at 343 K (pH = 2) until the wash water was free from PBNP, ferricyanide/ferrocyanide species.
Alternatively, the batch 3 (B3) was prepared by a two-step impregnation process. The support was firstly impregnated with a FeCl3 aqueous solution (20 mmol L−1) under stirring for 1 h. Then, the spheres containing Fe(III) ions were impregnated for 1 h with a stirred K4[Fe(CN)6] aqueous solution (30 mmol L−1). As for B1, spherical pellets were separated by screening, washed several times with HCl acidified water (pH = 2) at room temperature until the wash water was free from PBNP, ferricyanide/ferrocyanide species; and finally dried in air at room temperature.
The total iron content in the fresh and used catalysts was quantified using a standard iron(III) thiocyanate colorimetric method. The catalysts particles were disaggregated and oxidised as follows: a sample of around 100 mg was heated under reflux for 30 min with 15 mL of 5% potassium persulfate–concentrated sulfuric acid solution. For the calibration curve, the standard solutions were prepared using FeNH4(SO4)2·12H2O (MW: 482), adjusting the pH to 1 with sulfuric acid. Then, the standards and the disaggregated sample were diluted 1![[thin space (1/6-em)]](https://www.rsc.org/images/entities/char_2009.gif) :
:![[thin space (1/6-em)]](https://www.rsc.org/images/entities/char_2009.gif) 2 with KSCN 0.1 mol L−1 to form the characteristic red complex. Absorbance at 475 nm was used for quantifying the dissolved Fe(III), using a SHIMADZU UV-1800 spectrophotometer, by contrasting the sample with the standards. Determinations were performed in triplicate.
2 with KSCN 0.1 mol L−1 to form the characteristic red complex. Absorbance at 475 nm was used for quantifying the dissolved Fe(III), using a SHIMADZU UV-1800 spectrophotometer, by contrasting the sample with the standards. Determinations were performed in triplicate.
Specific areas of the support and the catalysts were determined from N2 adsorption isotherms at 77 K using a Micromeritics Gemini 2360 surface area analyser and the BET model. PBNP prepared ex situ were inspected by Transmission Electron Microscopy (TEM) (Philips EM 301). The morphology of the support and the catalysts was examined by Scanning Electron Microscopy (SEM) (Carl-Zeiss NTS SUPRA 40). The superficial iron distribution was mapped with Energy Dispersive X-ray Spectroscopy (EDS) (Oxford Instruments).
Mössbauer spectra of the fresh and used catalysts were obtained at room temperature in a conventional constant acceleration spectrometer in transmission geometry with a 57Co/Rh source. Measurements were recorded at 7 mm s−1 and fitting of the spectra was performed by using the Normos program.20 Isomer shift (IS) values were given relative to that of α-Fe at room temperature. Samples of the fresh catalysts provided a good Mössbauer signal. However, the amount of used catalyst available for analysis was low and the Mössbauer signal was significantly poorer.
2.2. Catalytic experiments
Runs were conducted in a thermostated stirred glass batch reactor with 200 mL capacity. Solid was placed into a basket to mitigate particles abrasion. The stirring velocity was tuned to ensure negligible external mass transfer resistance. To start each test, 175 mL of an orange G (OG) aqueous solution was placed into the reactor. Initial pH (pH0) was adjusted by using 1 mol L−1 H2SO4 or NaOH and it was measured with a pH-meter from HANNA instruments. No pH control was performed during the experiments. Reaction was initiated by adding a calculated amount of H2O2 and the basket containing the catalyst into the reactor. The operating conditions were: pH0 = 3, T = 343 K, catalyst = 6.5 g L−1, [OG]0 = 0.2 mmol L−1 and [H2O2]0 = 9 mmol L−1 (stoichiometric). Experimental conditions were selected as the ones leading to complete discolouration and extensive TOC removal, ensuring preeminence of reaction over adsorption of the dye.5 Liquid samples were taken out periodically and analyzed at once in terms of discolouration, pH, H2O2 concentration, TOC content and UV-visible spectrum. Total leached iron was measured at the end of the experiments. Results reported here represent the mean of at least three identical experiments. Stability was tested by recovering the solids from the solution after the reaction, and using them again with fresh OG solution at the same reaction conditions.The UV-visible spectra of samples were recorded from 190–800 nm using a SHIMADZU UV-1800 spectrophotometer. The maximum absorbance wavelength (λmax) of OG is in the visible range, at 492 nm. Prussian blue nanoparticles, ferrocyanide/ferricyanide ions and/or “free” iron cations may be released in treated solutions. Quantification of Fe present in the liquid phase was attempted by different techniques. Total “free” iron was measured with the HACH FerroVer method at the end of each run. The presence of PBNP and ferrocyanide/ferricyanide ions was monitored by UV-visible spectroscopy. A characteristic broad peak near 700 nm indicates the presence of colloidal PBNP.21,22 The presence of ferrocyanide and/or ferricyanide ions can be tracked spectrophotometrically as shown by Chakrabarti and Roberts.23 Total organic carbon was measured using a SHIMADZU TOC-V CPN total organic carbon analyzer. Hydrogen peroxide concentration was determined by a glycemia enzymatic test (Wiener Lab.).
3. Results and discussion
3.1. Characterization of the fresh catalysts
For simplicity and given the similarities found in the experimental results regarding characterization of the catalysts B1 and B2, only results corresponding to catalysts B2 and B3 are shown in this section.BET surface area measured for the support is 224 m2 g−1, whereas for the catalysts, it is around 190 m2 g−1. This slight reduction (about 15%) could be attributed to partial blockage of the porous net. Total iron content in the catalysts is (0.4 ± 0.04) wt%. No significant differences have been observed in this sense.
The catalysts exhibit a well-delimited white core and a blue egg-shell where PBNP are concentrated. The internal and external appearance of B2 and B3 is shown in Fig. SM-1 (ESI†). Catalyst B3 has a thicker PBNP shell when compared with B2.
Table 1 shows the elemental composition of the support (outer surface) and the fresh catalysts (outer surface and three different depths inwards), obtained by SEM-EDS. The alumina used as support does not contain iron on its surface. For B2, surface Fe-content is around 3.4 wt% and abruptly decreases, decaying 75% in 30 μm-depth from the external surface. In contrast, surface Fe-content for B3 is 1.8%wt and remains without significant changes at 30 μm-depth. These outcomes evidence a thinner PBNP layer for B2, in line with the visual inspection presented in Fig. SM-1.† A noteworthy difference between the catalysts arises from the K-contents measured. K is only detected for B3, in a K![[thin space (1/6-em)]](https://www.rsc.org/images/entities/char_2009.gif) :
:![[thin space (1/6-em)]](https://www.rsc.org/images/entities/char_2009.gif) Fe weight ratio near 1
Fe weight ratio near 1![[thin space (1/6-em)]](https://www.rsc.org/images/entities/char_2009.gif) :
:![[thin space (1/6-em)]](https://www.rsc.org/images/entities/char_2009.gif) 3. This result suggests that one of the synthesis methods mostly generates the “soluble” Prussian blue KFe[Fe(CN)6] (B3), although the stoichiometry is not exact, whereas the other one results in the “insoluble” Prussian blue Fe4[Fe(CN)6]3 (B2).12
3. This result suggests that one of the synthesis methods mostly generates the “soluble” Prussian blue KFe[Fe(CN)6] (B3), although the stoichiometry is not exact, whereas the other one results in the “insoluble” Prussian blue Fe4[Fe(CN)6]3 (B2).12
| Sample | Sampling depth | %Fe | %K | %Al | %O |
|---|---|---|---|---|---|
| Alumina | Surface | — | — | 54.6 | 45.4 |
| B2 | Surface | 3.4 | — | 43.9 | 52.7 |
| <1 μm | 3.3 | — | 43.1 | 53.6 | |
| 15 μm | 0.9 | — | 43.7 | 55.4 | |
| 30 μm | 0.5 | — | 43.5 | 56.0 | |
| B3 | Surface | 1.8 | 0.5 | 43.1 | 54.6 |
| <1 μm | 1.1 | 0.2 | 45.7 | 53.0 | |
| 15 μm | 1.6 | 0.6 | 48.9 | 48.9 | |
| 30 μm | 1.7 | 0.6 | 46.7 | 51.0 |
The Fe atoms maps of the outer surface of the catalysts, shown in Fig. SM-2 of ESI,† exhibit a fairly homogeneous distribution and a high density of active sites on the surface.
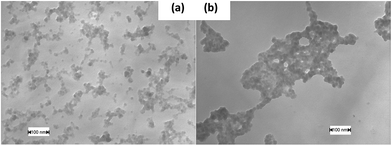
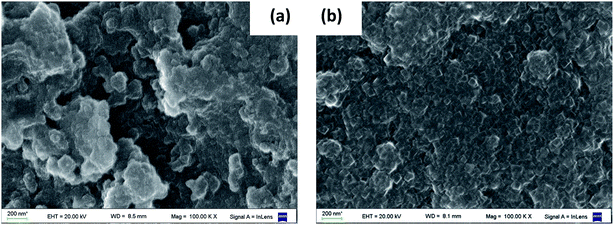
The Scanning Electronic Microscopy (SEM) photographs (100![[thin space (1/6-em)]](https://www.rsc.org/images/entities/char_2009.gif) 000×) of the fresh catalysts are shown in Fig. 1. The alumina surface image is also included for comparison. Fresh B2 catalyst surface shows that the PBNP are apparently dispersed on the alumina surface, increasing its roughness. Some nanoparticles are agglomerated onto the surface, forming bigger structures (larger than 100 nm). These observations are in line with those presented for B1 in Doumic et al.19 TEM images, shown in Fig. 2, indicate that just synthesized PBNP exhibit irregular shape and sizes well below 100 nm, but they rapidly tend to form polymeric agglomerates. On the other hand, the SEM image of B3 catalyst exhibits no appreciable increase in surface roughness compared to alumina.
000×) of the fresh catalysts are shown in Fig. 1. The alumina surface image is also included for comparison. Fresh B2 catalyst surface shows that the PBNP are apparently dispersed on the alumina surface, increasing its roughness. Some nanoparticles are agglomerated onto the surface, forming bigger structures (larger than 100 nm). These observations are in line with those presented for B1 in Doumic et al.19 TEM images, shown in Fig. 2, indicate that just synthesized PBNP exhibit irregular shape and sizes well below 100 nm, but they rapidly tend to form polymeric agglomerates. On the other hand, the SEM image of B3 catalyst exhibits no appreciable increase in surface roughness compared to alumina.
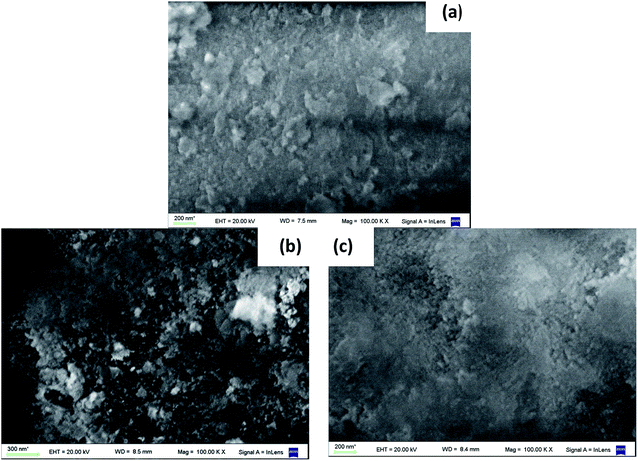 | ||
Fig. 1 SEM photographs (100![[thin space (1/6-em)]](https://www.rsc.org/images/entities/char_2009.gif) 000×) of the surfaces of (a) alumina; (b) fresh B2 catalyst; (c) fresh B3 catalyst. 000×) of the surfaces of (a) alumina; (b) fresh B2 catalyst; (c) fresh B3 catalyst. | ||
The room temperature Mössbauer spectra for both fresh samples are characterized by a quadrupole doublet and a singlet (see Fig. 3). The quadrupole doublet is assigned to high-spin Fe(III) with a 6-fold N coordination environment, and the singlet is assigned to low-spin Fe(II) with a 6-fold C coordination environment, agreeing with the parameters for Prussian blue given in Reguera et al.24 Quadrupole splitting (QS) and isomer shift (IS) values, along with the Fe(II)/Fe(III) ratios calculated from the area of the corresponding subspectra and considering the same recoilless factor for both contributions, are listed in Table 2.
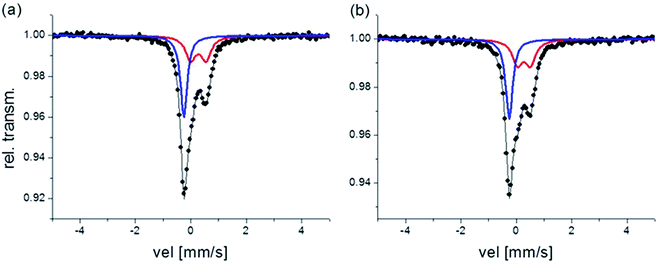 | ||
| Fig. 3 Mössbauer spectra corresponding to the fresh samples, (a) B2 and (b) B3 respectively. Red doublet: Fe(III) contribution, blue singlet: Fe(II) contribution. | ||
| Sample | Doublet Fe(III) | Singlet Fe(II) | Fe(II)/Fe(III) | |
|---|---|---|---|---|
| IS [mm s−1] | QS [mm s−1] | IS [mm s−1] | ||
| B2 | 0.38 | 0.55 | −0.14 | 0.75 |
| B3 | 0.38 | 0.46 | −0.14 | 0.72 |
The QS value depends on the Fe(III) local environmental symmetry, and is closely related with the crystalline order in the compounds. Then, as it is reported in Reguera et al.24 there is an increase in the value of QS for the “insoluble” PB with respect to the “soluble” PB due to systematic vacancies of the [Fe(CN)6]4− group in the “insoluble” PB. Thus, results in Table 2 suggest that B2 can be associated with “insoluble” PB while B3 would be mostly “soluble” PB. This hypothesis agrees with the results obtained for composition by SEM-EDS. In both, Fe(II) cations have zero QS values instead, consistent with a symmetric octahedral environment.
The Mössbauer absorption area ratio, Fe(II)/Fe(III), is another indicative of the “soluble” or “insoluble” nature of PB. In “insoluble” PB this ratio is expected to be 3/4 and in “soluble” PB, it is expected to be 1. In B2 this proportion points to “insoluble” PB; however, for B3 the experimental ratio is different from that expected for the “soluble” PB, indicating that stoichiometry in this sample is not exactly KFe[FeII(CN)6].
3.2. Catalytic activity
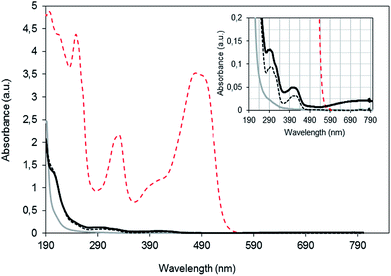
Catalysts are tested in the Fenton-type oxidation of an aqueous OG solution. The operating conditions are selected to promote chemical reaction over adsorption.19 Significant differences are detected in the characteristics of the treated solution. A completely colourless liquid without any precipitate is obtained after reaction with B1 or B2, whereas a bluish solution containing a colloidal sol, presumably of peptized PBNP, is achieved when B3 catalyst is used. To clear up this observation, the corresponding UV-visible spectra are examined and discussed carefully.UV-visible spectra of the solutions before and after treatment with fresh B1, B2 and B3 catalysts are shown in Fig. 4. The UV-visible spectrum of the OG solution exhibits a characteristic peak at 492 nm associated to the azo groups (N![[triple bond, length as m-dash]](https://www.rsc.org/images/entities/char_e002.gif) N), and peaks at 248 and 331 nm in the ultraviolet region, related to the benzene and naphthalene rings of the dye, respectively.25 At the end of the catalytic treatments, the characteristic peaks of OG significantly decrease and no significant absorbance is measured in visible wavelengths. However, remnant peaks are observed within the UV region indicating the dye degradation. H2O2 is completely depleted and it does not contribute to the absorbance measurements between 190 and 240 nm. Thus, signals in the UV region can be related to produced aromatic and carboxylic acids. Carboxylic acids absorb near 210 nm. Maleic, succinic, fumaric, oxalic, formic and acetic acids were identified as intermediates in the OG degradation.19 Moreover, Harrelkas et al.,26 who studied the photocatalytic oxidation of orange G, stated that the presence of end products (nitrates) and the formation of N-containing organics is reflected at 205 nm. In addition, traces of ferricyanide and ferrocyanide ions leached along reaction might contribute.
N), and peaks at 248 and 331 nm in the ultraviolet region, related to the benzene and naphthalene rings of the dye, respectively.25 At the end of the catalytic treatments, the characteristic peaks of OG significantly decrease and no significant absorbance is measured in visible wavelengths. However, remnant peaks are observed within the UV region indicating the dye degradation. H2O2 is completely depleted and it does not contribute to the absorbance measurements between 190 and 240 nm. Thus, signals in the UV region can be related to produced aromatic and carboxylic acids. Carboxylic acids absorb near 210 nm. Maleic, succinic, fumaric, oxalic, formic and acetic acids were identified as intermediates in the OG degradation.19 Moreover, Harrelkas et al.,26 who studied the photocatalytic oxidation of orange G, stated that the presence of end products (nitrates) and the formation of N-containing organics is reflected at 205 nm. In addition, traces of ferricyanide and ferrocyanide ions leached along reaction might contribute.
Further examination of the spectra (see inset graph in Fig. 4), highlights the differences observed between solutions treated with the three catalysts. The spectrum obtained after a 300 min reaction using fresh B3 exhibits a broad peak at about 700 nm evidencing the presence of Prussian blue.21,27 On the contrary, no absorbance is measured beyond 600 nm for B1 and B2, indicating the negligible leaching of PBNP. Hence, PBNP are released from the B3 catalyst whereas negligible PBNP peptization is observed when the B1 or B2 is used.
The treatment conditions may also promote the leaching of not only ferricyanide, but also ferrocyanide species, which in part are oxidised to ferricyanide in contact with H2O2. At the end of the first cycle using B1 and B3, a well-defined peak with its maximum absorbance at 420 nm is detected, indicating the presence of ferricyanide ions. The residual peak at around 300 nm may be also related to ferrocyanide and/or ferricyanide species leached, according to Chakrabarti and Roberts.23 In contrast, these peaks are practically no detected after treatment with B2, indicating negligible leaching of ferricyanide and/or ferrocyanide species. In addition, total “free” iron measured at the end of the runs using a fresh batch of catalyst is about 0.7, 0.4 and 0.5 mg L−1 for B1, B2 and B3, respectively.
It is interesting to remark that, according to our results, the release of PBNP is evidenced neither in B1 nor in B2, in which “insoluble” PBNP are synthesized. The leaching of B1 is basically composed by ferricyanide and/or ferrocyanide and “free” iron species, whereas the Fe leached using B2 is practically in the form of “free” iron. Thus, washing the just prepared catalyst at the reaction temperature (343 K) avoids the release of ferricyanide and/or ferrocyanide into solution during the peroxidation treatment.
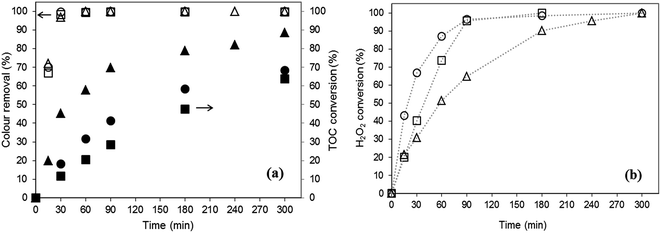
Fig. 5 shows the evolution of colour removal, TOC conversion and H2O2 decomposition along reaction time in the presence of the fresh catalysts. All catalysts are able to fully remove OG from solution within 60 min whereas oxidant is completely consumed at the end of the experiments. Oxidant is more slowly consumed with B2, probably because the species leached using B1 and B3 enhance the oxidant consumption rate. However, this fact has no practical impact on discolouration rate, possibly due to the promotion of scavenger reactions.
The total organic carbon concentration may decrease along reaction time due to mineralization of the organic content and/or organic compounds adsorption; or may even increase due to the release of ferricyanide/ferrocyanide ions into solution. Accordingly, TOC values measured in the present work results from the net contribution of these three factors.
No significant differences are observed in TOC consumption rates for runs performed with B1 and B3, but using B2, a greater TOC conversion is attained (89%). The lower value attained in experiments with B1 and B3 could be explained in terms of the carbon contribution through leaching of ferricyanide/ferrocyanide ions.
3.3. Catalyst stability
The main problems associated with heterogeneous catalyst stability arise from the leaching of the iron active phase and the poisoning of the active catalytic sites by adsorbed organic species or surface oxidation.16,28 Further experiments, described in the Section 2.2, are performed to examine catalysts stability.When B1 and B2 catalysts are reused, a colourless solution (with no solids in suspension nor precipitated) is attained at the end of all cycles. The UV-vis spectra at the end of the thirteen cycles tested using B2 also indicate negligible leaching of ferricyanide or ferrocyanide species (not shown). In contrast, at the end of the first four cycles using B3, a bluish colloidal solution of Prussian blue is observed. Then, from the fifth cycle onwards, a colourless solution is also achieved.
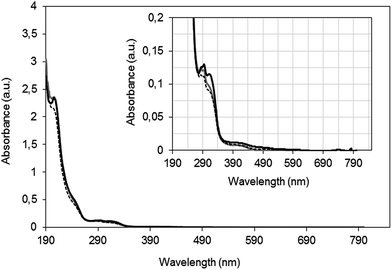
The UV-vis spectra obtained at the end of the fifth cycle with each one of the catalysts are shown in Fig. 6. Oxidant is completely consumed at the end of each run and it does not contribute to the absorbance measured in UV region and the residual peaks evidence the formation of reaction intermediates, as described in Section 3.2. Furthermore, for all the catalysts, the spectra obtained beyond the fifth peroxidation cycle indicate negligible release of PBNP, ferricyanide or ferrocyanide ions.
Total “free” iron leachate using B2 is around 0.4 mg L−1 in each one of the first 4th cycles and then remains constant in values around 0.2 mg L−1 in each cycle. These values are slightly lower than those measured in the successive runs performed with B1.19 For B3, the total “free” iron leachate is around 0.5 mg L−1 in each run. Again, the catalyst B2, based on “insoluble” PBNP, exhibits the smallest amount of total “free” Fe leached without releasing PBNP, ferrocyanide or ferricyanide ions into the reaction media.
Almost complete colour removal (>99.8%) is attained at 90 min (not shown) for all the cycles with the three catalysts tested. For all cycles using B1 and B2, oxidant consumption rate follows a pseudo first order kinetic with respect to the oxidant concentration (R2 > 0.97). For B3, only the data obtained when PB is not released (from the 5th cycle onwards) fit a pseudo first order kinetic (R2 > 0.98). Fig. SM-3 (ESI†) shows the estimated pseudo-first order rate constant values. Apparent kinetic constant values decrease markedly during the first cycles of use and then stabilize. Oxidant consumption rate is, in general, higher in the experiments performed with B3.
Fig. 7 shows the final TOC conversions obtained when reusing B1, B2 and B3 catalysts. From the second cycle onwards, TOC removal is higher for B1 and B2. TOC conversion using B3 exhibits an initial marked decay and then remains around 45% with reuses. The high TOC conversion attained in the first cycle with B2 (89%) is no longer maintained along the successive uses, in which TOC removal stays around 60%. This trend could be explained in terms of reaction intermediates adsorption. Furthermore, an increase in TOC concentration is observed during the first 15 min of experiments performed with a used sample of catalyst (B1, B2 or B3). See as an example the average TOC conversion profile obtained re-using B2 included in Fig. SM-4 (ESI†). These results may indicate the release of organic compounds onto the solution.
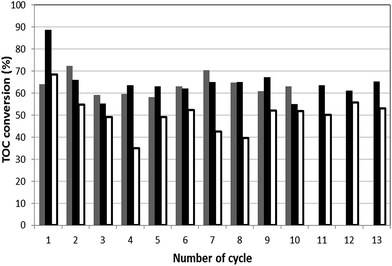 | ||
Fig. 7 TOC conversions obtained at the end of each 300 min-cycle. ( ) B1; ( ) B1; ( ) B2 and ( ) B2 and ( ) B3 catalysts. Operating conditions: pH0 = 3, T = 343 K, [H2O2]0 = 9 mmol L−1, [catalyst] = 6.5 g L−1. ) B3 catalysts. Operating conditions: pH0 = 3, T = 343 K, [H2O2]0 = 9 mmol L−1, [catalyst] = 6.5 g L−1. | ||
3.4. Intermediates adsorption/desorption during peroxidation experiments
Visual inspection of the catalysts beads reveals no changes in their characteristic colours after use, indicating that OG does not remain adsorbed. However, non-coloured organic reaction intermediates adsorption may occur. This finding is reflected in the experimental TOC trends shown in Fig. SM-4.† As the first cycle proceeds, reaction intermediates are adsorbed leading to a relatively low residual TOC concentration. From the second cycle on, we propose the existence of three contributions that affect the TOC measurements. At first, when the catalyst is contacted again with fresh OG solution and oxidant, organic intermediates desorption prevails, increasing the TOC concentration. Then, mineralization and/or adsorption of partially oxidized intermediates occur with a resulting decrease in TOC values. Adsorbed intermediates are released during the first minutes of the next cycle.Additional experiments were performed in order to evaluate the intermediates desorption at the reaction conditions. The solid is recovered from the solution after the last cycle, dried at room temperature and immersed in a known volume of bidistilled water under stirring at pH0 = 3 and 343 K. The evolution of UV-vis spectra is monitored until no changes are detected. For all the catalysts, the shape of UV-vis spectra attained at the end of desorption experiments evidences the occurrence of reaction intermediates desorption, indicating reversible adsorption (not shown).
3.5. Homogeneous contribution
As pointed out in Section 3.3, the total “free” iron leached with B2 is low. Nevertheless, its contribution as homogeneous catalyst needs to be evaluated and compared to that displayed by the active sites at the solid surface.Therefore, further experiments are performed using 0.2 mg L−1 of homogeneous ferrous iron (T = 343 K, pH0 = 3, [H2O2]0 = 9 mmol L−1). Faster discolouration rate is achieved in the homogeneous experiment: discolouration is completely fulfilled within the first 60 min. The homogenous oxidant decomposition presents a tenfold decrease (not shown). TOC results are compared in Fig. SM-4,† indicating that homogeneous TOC removal is further below heterogeneous conversion. This analysis highlights the prevalence of the heterogeneous catalytic oxidation of OG.
3.6. Characterization of the used catalysts
Catalysts are characterized after 65 hours of usage. Visual inspection reveals no significant changes in their external aspect. However, SEM determinations show more definite cubic particles of less than 100 nm for used B3 beads, as shown in Fig. 8. BET surface remains practically constant (180 m2 g−1) suggesting that there is no significant blockage of pores after the experiments. The loss of total Fe is low: around 10 and 25% for B2 and B3, respectively.Table 3 exhibits chemical composition of the used catalysts determined by SEM-EDS analysis at different depths from surface. In both catalysts, Fe content increases near the catalyst surface after usage, revealing an outward migration of Fe. K content clearly decreases in B3 outer layer, probably due to “soluble” to “insoluble” PB transformation.29 In the used samples, C and S are detected evidencing adsorption of intermediate products arising from OG oxidation.
| Sample | Sampling depth | %Fe | %K | %C | %S | %Al | %O |
|---|---|---|---|---|---|---|---|
| B2 | Surface | 4.1 | — | 8.5 | 0.9 | 36.7 | 49.8 |
| <1 μm | 1.4 | — | 38.6 | 0.2 | 26.1 | 33.7 | |
| 15 μm | 0.9 | — | — | 1.1 | 42.9 | 55.1 | |
| 30 μm | 0.5 | — | — | 1.1 | 44.6 | 53.8 | |
| B3 | Surface | 7.4 | 0.2 | — | 0.8 | 44.2 | 47.4 |
| <1 μm | 3.2 | 0.2 | 23.1 | 0.4 | 30.6 | 42.5 | |
| 15 μm | 0.9 | — | — | 0.8 | 45.5 | 52.8 | |
| 30 μm | 0.4 | — | — | 0.9 | 46.3 | 52.4 |
When divided in halves, B2 remains with a white core and a blue egg-shell, but B3 also exhibits an internal bluish circle and its external PBNP layer width decreases. Photographs are included in Fig. SM-5 of ESI.† This indicates that PBNP migrate inside the sphere, supporting the formation of “soluble” PBNP, which has a greater tendency to peptize. The Mössbauer spectra obtained from the used catalyst samples have a signal-to-noise ratio which is poor due to the limited amount of sample. However, in the case of B2, from the obtained fitting data is reasonable to distinguish between Fe(II) and Fe(III) species (Fig. 9).
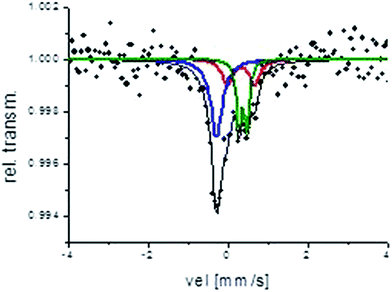 | ||
| Fig. 9 Mössbauer spectrum corresponding to the used B2 sample. Red and green doublets: Fe(III) contribution, blue singlet: Fe(II) contribution. | ||
It can be observed that the ratio Fe(II)/Fe(III) decreases to about 1.27. Fe(III) is transformed into two different Fe(III) doublets, denoting Fe(III) sites with different surroundings. This result might indicate partial reduction of PB after use and/or formation of another Fe(III) compound, presumably iron oxide or a complex between Fe(III) and intermediate products arising from the dye oxidation.
4. Conclusions
PBNP/γ-Al2O3 catalysts are prepared following different relatively simple and economic synthesis procedures. The two-step impregnation process using FeCl3 and K4[Fe(CN)6] aqueous solutions (B3) promotes the formation of “soluble” Prussian blue nanoparticles. Conversely, “insoluble” PBNP are synthetized through the reaction between FeCl3 and K3Fe(CN)6 using H2O2 as reducing agent. Once the PBNP are supported, different washing procedures are used, leading to B1 and B2 samples. The B2 sample was thoroughly rinsed with water at the reaction temperature; this procedure seems to minimize the release of the residual ferrocyanide and/or ferricyanide ions into the reaction media. Fresh and used catalysts are characterized by BET surface area, SEM, EDS, TEM, Mössbauer spectroscopy, total iron content and UV-vis spectrophotometry.The three PBNP/γ-Al2O3 catalysts have shown to be active in the peroxidation of the model azo dye orange G. However, catalysts based on “insoluble” PBNP (B1 and B2) have shown better behavior in terms of discolouration, mineralization, efficient peroxide consumption and stability. Among these samples, B2 presents better results. Its catalytic performance is followed along 13 cycles of 300 min each, resulting in 100% of dye degradation and 60% of TOC reduction. Catalyst stability is attributed to low iron leaching (around 10% after thirteen cycles) and to the reversible adsorption of organic intermediates that avoids the loss of activity due to the blockage of sites and/or pores. These significant results highlight the potential of B2 as a heterogeneous Fenton-type catalyst.
Acknowledgements
Financial support from Consejo Nacional de Investigaciones Científicas y Técnicas – CONICET – (PIP-112201101-00575), Universidad de Buenos Aires – UBA – (20020130100544BA), Universidad Nacional de Mar del Plata – UNMdP – (ING423/15) and Agencia Nacional de Promoción Científica y Tecnológica – ANPCyT – (PICT-2014-0704) is gratefully acknowledged. We express our gratitude to C. Rodriguez and H. Asencio for their technical support and to Sasol Germany GmbH, for supplying alumina spheres.References
- T. L. P. Dantas, V. P. Mendonca, H. J. José, A. E. Rodrigues and R. F. P. M. Moreira, Chem. Eng. J., 2006, 118, 77–82 CrossRef CAS.
- A. Quintanilla, A. F. Fraile, J. A. Casas and J. J. Rodríguez, J. Hazard. Mater., 2007, 146, 582–588 CrossRef CAS PubMed.
- R. C. C. Costa, F. C. C. Moura, J. D. Ardisson, J. D. Fabris and R. M. Lago, Appl. Catal., B, 2008, 83, 131–139 CrossRef CAS.
- X. Xue, K. Hanna and N. Deng, J. Hazard. Mater., 2009, 166, 407–414 CrossRef CAS PubMed.
- L. Doumic, Doctor, Universidad de Buenos Aires, Buenos, 2015.
- E. G. Garrido-Ramírez, B. K. G. Theng and M. L. Mora, Appl. Clay Sci., 2010, 47, 182–192 CrossRef.
- P. Xu, G. M. Zeng, D. L. Huang, C. L. Feng, S. Hu, M. H. Zhao, C. Lai, Z. Wei, C. Huang, G. X. Xie and Z. F. Liu, Sci. Total Environ., 2012, 424, 1–10 CrossRef CAS PubMed.
- S.-Q. Liu, S. Cheng, L.-R. Feng, X.-M. Wang and Z.-G. Chen, J. Hazard. Mater., 2010, 182, 665–671 CrossRef CAS PubMed.
- X. Q. Zhang, S. W. Gong, Y. Zhang, T. Yang, C. Y. Wang and N. Gu, J. Mater. Chem., 2010, 20, 5110–5116 RSC.
- H. Wang and Y. Huang, J. Hazard. Mater., 2011, 191, 163–169 CrossRef CAS PubMed.
- A. A. Karyakin, Electroanalysis, 2001, 13, 813–819 CrossRef CAS.
- F. Scholz, D. Schwudke, R. Stösser and J. Bohácek, Ecotoxicol. Environ. Saf., 2001, 49, 245–254 CrossRef CAS PubMed.
- X. Li, J. Wang, A. I. Rykov, V. K. Sharma, H. Wei, C. Jin, X. Liu, M. Li, S. Yu, C. Sun and D. D. Dionysiou, Catal. Sci. Technol., 2015, 5, 504–514 CAS.
- M. Munoz, Z. M. de Pedro, J. A. Casas and J. J. Rodríguez, Appl. Catal., B, 2015, 176–177, 249–265 CrossRef CAS.
- J. Deng, X. Wen and Q. Wang, Mater. Res. Bull., 2012, 47, 3369–3376 CrossRef CAS.
- P. V. Nidheesh, RSC Advances, 2015, 5, 40552–40577 RSC.
- H. Lim, J. Lee, S. Jin, J. Kim, J. Yoon and T. Hyeon, Chem. Commun., 2006, 463–465 RSC.
- M. Xia, M. Long, Y. Yang, C. Chen, W. Cai and B. Zhou, Appl. Catal., B, 2011, 110, 118–125 CrossRef CAS.
- L. Doumic, G. Salierno, M. Cassanello, P. Haure and M. Ayude, Catal. Today, 2015, 240, 67–72 CrossRef CAS.
- R. A. Brand, Normos program, Universität Duisburg, Duisburg (Germany), 1987 Search PubMed.
- L. Samain, F. Grandjean, G. J. Long, P. Martinetto, P. Bordet and D. Strivay, J. Phys. Chem. C, 2013, 117, 9693–9712 CAS.
- P. C. Pandey and A. K. Pandey, Electrochim. Acta, 2014, 125, 465–472 CrossRef CAS.
- M. H. Chakrabarti and E. P. L. Roberts, J. Chem. Soc. Pak., 2008, 30, 817–823 CAS.
- E. Reguera, J. Fernández-Bertrán, C. Díaz and J. Molerio, Hyperfine Interact., 1992, 73, 285–294 CrossRef CAS.
- L. I. Doumic, P. M. Haure, M. C. Cassanello and M. A. Ayude, Appl. Catal., B, 2013, 142–143, 214–221 CrossRef CAS.
- F. Harrelkas, A. Paulo, M. M. Alves, L. El Khadir, O. Zahraa, M. N. Pons and F. P. van der Zee, Chemosphere, 2008, 72, 1816–1822 CrossRef CAS PubMed.
- M. Farah, C. Billing, C. W. Dikio, A. N. Dibofori-Orji, O. O. Oyedeji, D. Wankasi, F. M. Mtunzi and E. D. Dikio, Int. J. Electrochem. Sci., 2013, 8, 12132–12146 Search PubMed.
- F. Martínez, J. A. Melero, J. Á. Botas, M. I. Pariente and R. Molina, Ind. Eng. Chem. Res., 2007, 46, 4396–4405 CrossRef.
- R. K. Adhikamsetty and S. B. Jonnalagadda, Bull. Chem. Soc. Ethiop., 2009, 23, 47–54 CAS.
Footnote |
| † Electronic supplementary information (ESI) available. See DOI: 10.1039/c6ra06618f |
| This journal is © The Royal Society of Chemistry 2016 |

