Isotopic homogenization and scrambling associated with oxygen isotopic exchange on hot platinum: studies on gas pairs (O2, CO2) and (CO, CO2)†
K. Prasannaa,
S. K. Bhattacharyaac,
Prosenjit Ghosh*ab,
Sasadhar Mahatacd and
Mao-Chang Liangc
aCentre for Earth Sciences, Indian Institute of Science, Bangalore, India. E-mail: pghosh@ceas.iisc.ernet.in
bDivecha Centre for Climate Change, Indian Institute of Science, Bangalore, India
cResearch Center for Environmental Changes, Academia Sinica, Taipei, Taiwan
dXi'an Jiaotong University, Xi'an, China
First published on 17th May 2016
Abstract
The catalytic exchange between O2 and CO2 on hot platinum leads to isotope scrambling in CO2 and homogenization of the oxygen isotopes in the two phases (O2 and CO2) even though the two gases could be widely different in isotope ratios from each other (e.g., about 45‰ in δ18O) before the exchange. After the exchange, the δ18O values of the gases become close to each other (within 2‰) depending on the time and temperature. The clumped-isotope analysis of the post-exchange CO2 samples shows that the Δ47 values (relative to the pre-exchange values) decrease with increase in temperature from near zero (at ∼25 °C) to about −0.8 ± 0.1‰ (at ∼700 °C). The low value of −0.8‰ equals the values typically obtained for pure CO2 heated to 1000 °C inside quartz tubes suggesting a scrambled state. If the catalytic exchange between CO2 and O2 is associated with isotopic scrambling (or random mixing) a microscopic mechanism of isotopic mixing can be inferred. It seems that CO2 and O2 dissociate in the adsorbed state on platinum (or quartz surfaces) and the product CO molecules and O atoms mix uniformly while doing a random walk on the hot surface and produce two reservoirs (CO and O) where the three oxygen isotopes are randomly distributed. This can produce the observed internal isotopic scrambling in CO2 when CO and O recombine to form CO2 molecules on the platinum surface and desorb. Experiments using CO–CO2 gas pairs over hot platinum also show homogenization showing exchange of CO as a molecular entity and supporting the suggested mechanism.
A. Introduction
There are twelve stable isotopologues of CO2 comprised of different combinations of 12C, 13C, 16O, 17O and 18O like 16O12C16O, 16O13C16O, etc. The equilibrium thermodynamic model predicts that heavy isotopes 13C and 18O tend to accumulate in the molecular species 16O13C18O and consequently its abundance is more than expected from the stochastic distribution.1 This is due to the lower zero point energy of 16O13C18O compared to the isotopologue 16O13C16O or 16O12C18O (the two dominant minor species). This tendency is popularly known as ‘clumping’ which means enhanced association of two heavy isotopes. Clumping depends on the temperature of equilibration, and this dependence forms the basis of Clumped Isotope Thermometry which requires analysis of a given sample of CO2 and its stochastic equivalent.1 Theoretically, the stochastic distribution in a particular sample of CO2 can be calculated if the abundances of isotopic atoms (12C, 13C, 16O, 17O and 18O) are known.2 Experimentally, however, one cannot conclusively decide when a particular sample of CO2 achieves stochastic distribution since there are issues of isotopic fractionation during sample preparation and mass spectrometric analysis. For analytical purpose one supposes that the random distribution is attained when a sample of CO2 is heated to a high temperature (1000 °C) in a quartz tube for a few hours. It is thought that interaction of the gas molecules among themselves and with the wall should bring about the expected randomness. Such a gas sample is assumed to define the ‘zero’ (within ±0.03‰) in the scale of “clumpiness”.3For clumped isotope thermometry, one first analyzes a sample gas for five isotopologue ratios (like ratio R47 = n(47)/n(44) where n is number of ions of mass 47 and 44) and then heats up the same gas sample (after retrieving it from the mass spectrometer) to 1000 °C and reanalyzes it for the same ratios. Dividing the first ratio with the second one, after proper calibration, one obtains the clumpiness of the sample gas relative to the heated gas (in Δ47 scale defined later). However, the question remains whether the sample gas heated in this way really attains the complete randomness. Wang et al.2 have shown by a theoretical model that CO2–CO2 interaction and exchange should bring about randomness in the distribution if equilibrium is attained at high temperature ∼1000 °C but possible wall effect and finite time of heating was not considered. It is of course expected thermodynamically that at high enough temperature and long enough time any sample of CO2 will attain stochastic distribution.
A recent analytical method4,5 involving exchange of CO2 and O2 in presence of hot platinum (∼680 °C) for two hours provided a useful technique for determination of 17O/16O of CO2. It was noted that this particular exchange reaction mixes the O-isotopes among the two gases so efficiently that the post-exchange isotopic ratios are nearly identical. The mixing was used to obtain the 17O/16O ratio in CO2 which cannot, otherwise, be derived from the measured ion mass ratio of 45/44 due to interference from 13C/12C ratio. Despite the success of this method to achieve extremely high precision (about 7 parts per million) the mechanism of exchange was not clear. It was thought to be driven by a catalyzed break down of the adsorbed molecular species (O2 and CO2) on the surface of the platinum followed by isotopic exchange.5 But whether it was thermodynamic exchange process or simple mechanical mixing remained a puzzle.
In this study we aimed to understand the mechanism of this exchange by using a novel approach which combines both isotopic analysis of O2 and CO2 as well as analysis of Δ47 (defined later) of the same CO2 which has undergone exchange. The latter analysis gives us an idea about the degree of scrambling of the CO2 gas in its isotope distribution before and after exchange. Isotopic homogenization and scrambling should be intimately related if the breakdown of CO2 (to CO + O) and O2 (to O + O) takes place followed by mixing of O-atoms from the two sources. It would imply that the process is not a Urey-type thermodynamic exchange where the zero point energy governs the reaction. It would also imply that the twelve CO2 isotopic species (like 16O12C16O, 16O13C16O… etc.) would not obey intra-molecular thermodynamic distribution and the post-exchange CO2 gas would show signature of scrambling by reduced amount of clumpiness.
While developing the platinum exchange technique for high precision reported in our recent work5 we analyzed a few CO2 samples for clumped isotope ratio Δ47 but the data were preliminary with large uncertainty. The present work is a more intensive study aimed to address exclusively the issue of mechanism of exchange with higher precision and accuracy. New experiments on temperature variation of Δ47 show how the catalysis induced exchange follows a smooth variation (probably Sabatier effect). We also carried out blank experiments to isolate the effect of the quartz exchange on individual gases. In addition to the exchange of O2 and CO2 we investigated exchange of gas pair CO–CO2. If CO2 indeed breaks down as seen in case of nickel catalyst6 then CO molecules from this source would also be able to exchange with a second adsorbed reservoir of CO and one would have homogenization of both carbon and oxygen isotopes. Indeed the results obtained in this work justify our preliminary conclusion on a firmer basis. This study may have interesting applications in isotope geochemistry where surface reactions mediated by catalyst play an important role. For example, in case of leafs there is rapid exchange of H2O and CO2 mediated by carbonic anhydrase catalyst. This study may throw light in understanding such cases of isotope exchange.
B. Experimental method
A gas extraction line (made of glass and shown in Fig. 1) was fabricated in the Centre of Earth Sciences, Indian Institute of Science, Bangalore, to study the exchange of oxygen isotopes between O2 and CO2 on hot platinum. The reaction section consists of a 1/4 inch diameter quartz tube containing 3–4 small platinum strips (2 mm × 10 mm); the platinum containing part of the tube was placed inside a furnace. This section was connected to the main line by ultra-Torr connector and could be easily disconnected when required. Following the protocol of Mahata et al.,4,5 the reaction time was kept fixed at 2 hours and the temperature maintained at ∼700 °C by using a controller where the thermocouple sensor was kept inside the cylindrical heater close to the platinum containing part. The temperature could be kept constant to within ±10 °C.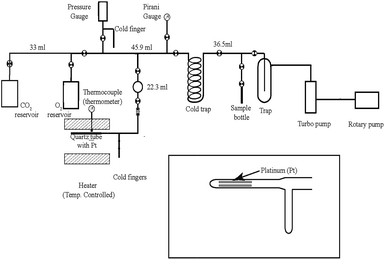 | ||
| Fig. 1 Schematic diagram of the gas extraction line for CO2 and O2 isotope exchange in presence of heated platinum. | ||
For O2–CO2 exchange nearly equal amount of the two gases (to ensure equal number of oxygen atoms in the two gas phases) are taken in the heated quartz tube section containing the platinum strips. The protocol is as follows. First, a sample of CO2 is taken from an attached flask in the line. After taking an aliquot from this gas (to be used as the initial CO2 sample) a section of the line (with known volume V) is filled with this gas and its amount (n mole) is calculated using pressure (P) read by a Baratron gauge at the room temperature (T) and assuming ideal gas law: PV = nRT. This aliquot of CO2 is transferred completely to the quartz segment by cryogenically trapping in the cold finger and is isolated by closing the lower stop cock. Next, a sample of O2 is taken from a second flask into the line including a transfer volume (between two stop cocks shown in Fig. 1) connected to the reactor. The pressure of O2 is adjusted such that its amount in the transfer volume is close to that of the CO2. After waiting for about 5 minutes to ensure uniformity the upper stop-cock is closed and the lower stop cock is opened to commence the reaction. The rest of the gas in the line is collected as the initial O2 sample. Only the platinum containing part of the quartz tube is heated to the desired temperature and the rest of the reaction section remains at room temperature. We have earlier checked that in about two hours the exchange is complete and a steady state is attained (at a temperature of 680 °C) despite the temperature gradient in the reactor.4 For CO–CO2 exchange exactly similar procedure was adopted except that the amount of CO was usually taken to be twice that of CO2 to ensure equimolar O-atom content of the reacting gases.
After the exchange the CO2 fraction is extracted from either O2 or CO by passing the gas mixture through a cold finger (kept at −196 °C) while collecting the O2 or CO in a sample tube (kept at the sampling port) containing a few pellets of molecular sieve (MS13X) and cooled to liquid nitrogen temperature.7,8 Later on, the CO2 fraction is also collected in a sample tube by liquid nitrogen. The gases (O2, CO2 and CO) are analyzed for isotope ratios expressed in the standard δ-notation defined below:
| δ18O = [R18sam/R18std − 1] × 1000 in per mil (‰) |
| Δ47 = [R47sam/R47stochastic − 1] × 1000 |
Following the exchange, the CO2 gas is analyzed for δ13C and δ18O and the O2 gas is analyzed for δ17O and δ18O using a MAT 253 mass spectrometer (MS) operated in the dual inlet mode. We thus obtain the isotopic composition of the two reacting gases (O2–CO2 pair or CO–CO2 pair) as well as the final composition of the product gases after the exchange. The MS working gases are calibrated relative to the international standards VPDB and VSMOW by standard techniques9,10 and also through inter-laboratory (Academia Sinica and Utrecht University) cross-calibration. The δ-values (in ‰) of our local standards are as follows: Linde CO2 with δ13C = −4.411 (VPDB), δ18O = 24.592 (VSMOW); OASIS CO with δ13C = −492.7 (VPDB), δ18O = −297.5 (VSMOW) and OASIS O2 with δ17O = −11.504 (VSMOW), δ18O = −21.720 (VSMOW). Using these values of the three MS working standards all raw δ-values are converted to VPDB and VSMOW scale. The analytical precisions in the mass spectrometric analysis are typically 0.011, 0.023 and 0.011 for δ13C, δ17O and δ18O, respectively. However, reproducibility of analysis of samples (taking into account the processing protocols) based on repeat analysis of 12 samples have typical standard deviation (1σ) values: 0.17, 0.11 and 0.17‰ for δ13C, δ17O and δ18O respectively. Various uncontrolled kinetic fractionations taking place in the reactor and those associated with gas separation and absorption–desorption in molecular sieves add up to give higher dispersion. This is evident from the standard deviation of the oxygen isotope anomaly values (defined as Δ17O = δ17O − 0.516 × δ18O) which is about 0.028‰ since the 17O/16O and 18O/16O fractionations cancel out in the calculation of anomaly. This is the reason for getting a high precision (±0.007‰) in the estimation of Δ17O of CO2 by Mahata et al.5 It is to be noted that any leakage in the vacuum system or presence of minute quantities of water would have deleterious effects on the results since that would mean extra sources of oxygen with widely different isotope ratios that can exchange with CO2. However, as discussed in Mahata et al.5 the blank experiments did not reveal any such exchange. CO2 samples were heated in the same set up with platinum but without oxygen and the changes in the δ18O values were less than 0.04‰ indicating insignificant contribution from any contaminant.
In addition to the IISc experiments, a second of set of experiments (using O2–CO2 pair) was performed in Academia Sinica using the system described in Mahata et al.4 and following essentially the same protocol as given above. However, there is a notable difference between the two setups. The relative δ-values of the O2 and CO2 in the two laboratories were quite different. In case of IISc experiments, the δ18O values (in VSMOW scale) are, O2: −21.54 ± 0.18; CO2: 25.16 ± 0.17‰. But for Academia Sinica the respective values are (for three different pairs): pair 1: [O2: 32.75 ± 0.20; CO2: 15.41 ± 0.05‰]; pair 2: [O2: 32.79 ± 0.20; CO2: 16.38 ± 0.05‰]; and pair 3: [O2: 32.61 ± 0.20; CO2: 20.82 ± 0.05‰]. These choices with different sets of values allowed us to check if the initial compositions have any influence on the degree of homogenization. As the results will show, it does not matter whether the δ18O of initial O2 is less or more than the δ18O of initial CO2 or how different the values are to the final homogenization state. The data obtained in the Academia Sinica system are added to the IISc data set and are given in ESI† tables and figures while discussing the results of Δ47 analysis. It is evident that there is fair degree of consistency in the two sets of results.
C. Results
The analytical data related to the catalysis induced exchange (for IISc experiments only) are given in ESI Table 1† for O2–CO2 and ESI Table 2† (for δ18O) and ESI Table 3† (for δ13C) in case of CO–CO2 exchange. Note that in these tables the simple d-value has been replaced by logarithmic definition, following Miller (2002)11 who suggests that in the oxygen three isotope plot if we use the logarithmic definition of δ-values i.e., 1000 × ln(1 + δ/1000) the slope of the regression line is invariant to the choice of the reference material and is especially preferred when large δ-differences occur like in Fig. 2. The δ13C values for the O2–CO2 exchange case are not shown because, as expected, the initial and final values remain the same within ±0.005‰. This also proves that there is no mass loss or gain in the system as that would surely alter the isotope ratio of carbon. ESI Table 1† shows that as a result of exchange between O2 and CO2 (taken in nearly equimolar proportions and at temperatures ranging between 600 and 800 °C) the δ18O of O2 phase increases by an amount close to the amount by which δ18O of CO2 phase decreases (schematically shown in Fig. 2). Since the number of atoms of O2 and CO2 are nearly equal, mass balance requires that decrease in δ18O value of CO2 must equal the increase in δ18O value of O2. The δ18O value of O2 at the start of the process is −21.8‰ (VSMOW) and that of CO2 is +24.8‰ (VSMOW). The exchange brings their δ18O values close to each other within a few ‰ depending on the time and the temperature. Given a rather long time (∼25 h) and temperature of 700 °C the two δ18O values become almost identical to within 0.3‰ (sample 7 and Fig. 2). This demonstrates that the exchange leads to homogenization of isotope ratios at a particular time–temperature combination. It is obvious that the post-exchange δ18O values of the two gases are not what one expects in equilibrium isotope exchange reaction between O2 and CO2. In that case, at 700 °C CO2 would have δ18O value higher by about 6.4‰ as can be derived from the ratio of β-values (see the table of reduced partition function ratios in Richet et al.12). We therefore characterize the process as isotopic mixing or homogenization rather than isotopic exchange in the sense of equilibrium thermodynamics.13 Platinum catalyst plays an important role in bringing about the homogenization. This is clearly evident from the results of the samples 20 and 21 where no platinum was used and the changes in δ18O values were minimal. We also note that the magnitude of exchange reduces with temperature and at ∼300 °C the change in δ18O value is close to zero (Fig. 3).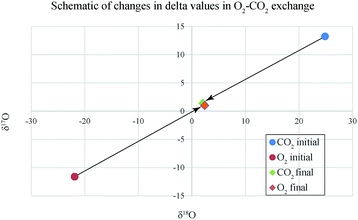 | ||
| Fig. 2 Isotopic exchange between O2 and CO2 with μmole ratio of 47/49 in presence of platinum catalyst at 700 °C. The starting composition of O2 (−21.8, −11.5) increases to (2.4, 1.0) after exchange while the composition of CO2 decreases correspondingly from (24.8, 13.2) to (2.1, 1.4). At the final stage the two delta values should be identical but we find that O2 δ18O is little higher (∼0.3) than that of CO2. This is due to the interfering exchange with quartz (δ18O ∼ 10) which increases the δ18O of final O2 while reducing the δ18O of final CO2 (see Fig. 3). Numbers are in ‰ relative to VSMOW. | ||
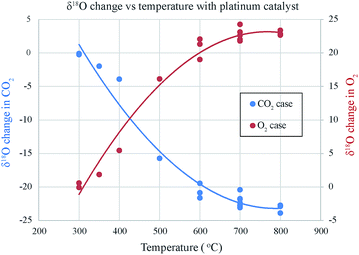
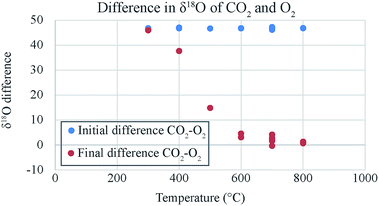
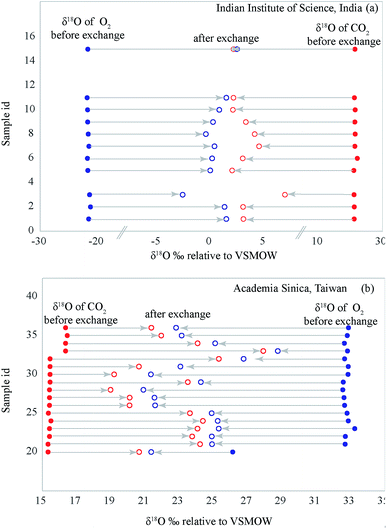
As the temperature increases the δ18O value of each gas changes and reaches a plateau at about 600 °C. Additionally, with increasing temperature (for ∼2 hours) the difference between the two δ18O values reduces (Fig. 4). These two observations seem to display the well-known Sabatier effect showing temperature variation in the catalytic efficiency of the platinum.14 Fig. 5 shows that for both IISc and Academia Sinica experiments, the gas compositions approach each other and the final values are close (within 0.3‰) when the time given is large enough for the exchange reaction (∼20 hours for sample ID 15).
In case of CO–CO2 exchange the isotopes of both carbon and oxygen can change (Fig. 6) unlike O2–CO2 case where carbon isotopes remain invariant. However, in case of CO/CO2 close to two, equal number of O-atoms from CO and CO2 are available whereas C-atoms from CO were twice that from CO2. Therefore, it is expected that the magnitude of exchange in the two isotope ratios would not be the same. Our CO tank happens to be extremely depleted in both 18O and 13C. We calibrated it by converting CO to CO2 by discharge and measuring the product CO2 against our tank CO2 [δ18O = +24.8 (VSMOW) and δ13C = −4.411 (VPDB) in ‰]. The values for CO found by this method are δ18O = −280.2‰ (VSMOW) and δ13C = −495.0‰ (VPDB). We should mention that the discharge of CO does not convert 100% of the carbon to CO2 and there is a large carbon deposit due to the disproportionation reaction. This can potentially change the δ13C value of the CO2 product from that of the CO. Therefore, we checked the assignment of the δ18O and δ13C values by cross-calibration with the Utrecht University laboratory of Prof. Thomas Rockmann and found them to be consistent. However, the extremely negative δ13C value of the tank CO introduces non-linearity issue and the assigned value may have large uncertainty.
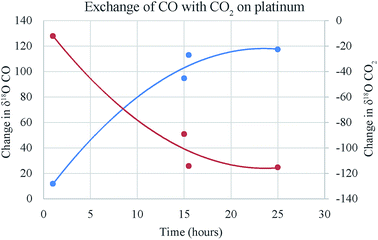 | ||
| Fig. 6 Changes in δ13C of CO and CO2 due to exchange in presence of platinum with time. The time required to reach a steady state (about 20 h) is much higher compared to O2–CO2 exchange time (about 2 h) on platinum (based on data in ESI Table 2†). | ||
Despite the above-mentioned problem of calibration we find that the negative changes of δ18O and δ13C values in CO2 match the corresponding increases in CO reasonably well when corrected for the atom ratio. For blank runs in both cases (only CO or only CO2 with platinum in quartz tube) the changes are negligible. However, when both CO and CO2 are present in the quartz tube, even without platinum there is a large change (in both δ18O and δ13C; see ESI Tables 2 and 3†) unlike the case of O2–CO2 (see ESI Table 1†).
This change is somewhat less than that obtained with platinum (compare samples 3, 4 and 5) but is still appreciably large. It seems that the heated quartz surface alone can act as catalyst for the CO–CO2 exchange at 700 °C. However, this result has to be investigated further with a more positive (in δ18O and δ13C) CO tank. For oxygen isotope ratio the changes in the two gases are nearly equal as expected (see the 1![[thin space (1/6-em)]](https://www.rsc.org/images/entities/char_2009.gif) :
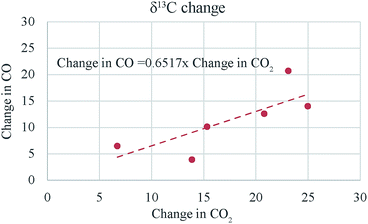
:![[thin space (1/6-em)]](https://www.rsc.org/images/entities/char_2009.gif) 1 line in Fig. 7) but for carbon isotope ratio the change in CO is less than that in CO2 (see Fig. 8) even when the latter is corrected for the atom ratio (i.e., multiplied by CO2/CO molar ratio to normalize the change in CO2 to the mole number of CO). A comparison of the numbers in column 6 and 9 (ESI Table 3†) show that the atom ratio corrections to the CO2 δ13C change cannot compensate for the difference fully and apparently the carbon isotope balance is not satisfied within 10‰. We suspect that this could be due to the problem of calibration since the δ13C value of CO is −495‰ as against that of CO2 being −4.4‰. A change of 10‰ in CO2 may not show up as equivalent change in CO (corrected for mass ratio) unless the two scales are consistent to a few per mil level. We conclude that the CO–CO2 exchange results are only indicative at this stage due to the limitation imposed by the hugely different isotope ratios of the CO tank that we have.
1 line in Fig. 7) but for carbon isotope ratio the change in CO is less than that in CO2 (see Fig. 8) even when the latter is corrected for the atom ratio (i.e., multiplied by CO2/CO molar ratio to normalize the change in CO2 to the mole number of CO). A comparison of the numbers in column 6 and 9 (ESI Table 3†) show that the atom ratio corrections to the CO2 δ13C change cannot compensate for the difference fully and apparently the carbon isotope balance is not satisfied within 10‰. We suspect that this could be due to the problem of calibration since the δ13C value of CO is −495‰ as against that of CO2 being −4.4‰. A change of 10‰ in CO2 may not show up as equivalent change in CO (corrected for mass ratio) unless the two scales are consistent to a few per mil level. We conclude that the CO–CO2 exchange results are only indicative at this stage due to the limitation imposed by the hugely different isotope ratios of the CO tank that we have.
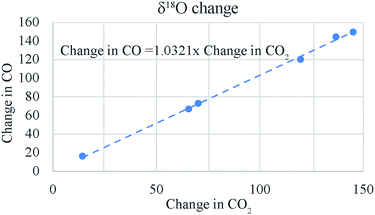 | ||
Fig. 7 The change (in absolute magnitude) in δ18O of CO is nearly equal to the change in δ18O of CO2 leading to a 1![[thin space (1/6-em)]](https://www.rsc.org/images/entities/char_2009.gif) : :![[thin space (1/6-em)]](https://www.rsc.org/images/entities/char_2009.gif) 1 slope for the two changes. 1 slope for the two changes. | ||
D. Discussion
A model that can account for the above observations is one that involves catalyzed breakdown and exchange of molecules and atoms on the platinum surface. For CO2–O2 exchange we visualize the exchange reaction to occur as:| CO2 → CO2ads, CO2abs → COads + Oads, O2 → O2ads, O2ads → Oads + Oads |
The catalytic reaction starts by adsorption of the reactants CO2 and O2 to the platinum catalyst spontaneously. For most metal surfaces the O2 molecules dissociate upon adsorption. The oxygen isotopic exchange studies by several researchers (Bedrane et al., 2005; Sandler and Durigon, 1968; Chin et al., 2011; Boreskov, 1964)15–18 provide ample proof of dissociative adsorption of O2 by metal particles. The reason is two-fold: firstly, the free electrons from the metal fill the anti-bonding orbital of O2 molecule and secondly, the bonding of the two atoms to the surface is energetically more favourable than that of one molecule.19 The CO2* molecules (a small fraction of the total) can also dissociate to CO* and O* though with a much lower rate (energy barrier ∼ 125 kJ mol−1) than O2 dissociation (which does not require activation energy). In contrast, the reverse reaction of CO* + O* → CO2* has a low energy barrier 50 to 100 kJ mol−1 and can take place faster.14 The O*-atoms (and CO* molecules) move around on the platinum surface in a two-dimensional Brownian motion with a mean residence time of about 60 msec.20,21 Consequently, a reservoir of adsorbed O*-atoms builds upon the platinum surface by contribution from both CO2* and O2* and they are mixed up due to migration of the O*-atoms from their original site of adsorption, thus losing their source identity (or isotopic composition). Therefore, when the molecules form again by reverse reactions, the O*-atoms are derived from a completely homogenized reservoir (with mass balance composition) and the oxygen isotopic compositions of the resultant O2 and CO2 are almost equal. In a comparable case, a homogeneous isotope mixing in the product CO2 formed by catalytic CO oxidation on platinum surface was inferred by earlier studies.22,23 Finally, the product molecule CO2 being relatively unreactive with the platinum surface desorb from the catalyst surface in an endothermic step. The O2 and CO2 molecules in the gas phase soon attain an isotopic steady state with the adsorbed species of the same.
Due to this set of processes there is a reservoir of CO and O along with CO2 and O2 (all in the adsorbed state on the hot platinum surface) which can interact with each other. Depending on the temperature and time and the rates of the various processes a steady state is reached where the oxygen isotope ratios become indistinguishable in the two phases (CO2 and O2). From the results it is clear that in the present experimental configuration it takes about 2 hours at 700 °C to achieve this steady state. The isotope ratios are identical in the two gas phases (CO2 and O2) in this case and that is possible only if a random distribution is present where the zero point energy difference of the various species of molecules does not play any role in controlling the steady state composition. The clumped isotope results should show this clearly since the 13C18O16O abundance (or clumpiness) would be higher than dictated by random distribution only if the zero point energy of this isotopologue plays a role. For the purpose of present discussion the clumpiness Δ′47 is defined here with reference to the composition of the gas before any exchange, that is as: Δ′47 = Δ47 (post-exchange) − Δ47 (pre-exchange). With this definition, we note that in the present case of O2–CO2 exchange the clumpiness decreases with increase in temperature (Fig. 9) and even at a low temperature of ∼600 °C it attains the composition of the CO2 gas heated to 1000 °C.
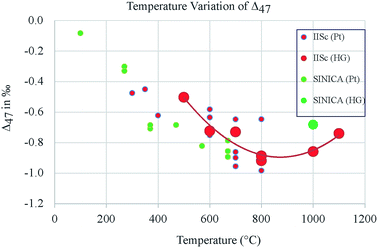 | ||
| Fig. 9 Clumpiness of CO2 [defined as the change: Δ47 (post-exchange) − Δ47 (pre-exchange) in ‰ VSMOW] as a function of temperature (ESI Table S1†). Increased negative values indicate more stochasticity. Catalytic exchange of CO2 with O2 at temperatures above 600 °C (for 2 h or more) induces clumpiness close to that of the CO2 gas heated to 1000 °C without O2 and platinum. At 300 °C the clumpiness is close to zero (less stochasticity). Symbols: IISc – Indian Institute of Science, SINICA – Academia Sinica, Taiwan, HG – Heated Gas CO2 at 1000 °C. Pt – Platinum. Uncertainty in the values is typically about ±0.1‰. | ||
The plot also suggests that for a range of temperature (500 to 1100 °C) the randomness obtained for the heated gas (without platinum and without O2) has a broad peak (at ∼800 °C, in a resolution of 100 °C) after which it decreases slightly. This Gaussian type behaviour is the feature of catalytic Sabatier effect10 and the values provide a measure of scrambling brought about in CO2 by contact with heated quartz inducing a catalytic reorganization of the isotopes. However, there is a large uncertainty in the values (∼±0.1‰) and this issue should be investigated further. If confirmed by future experiments, this could mean that heated gas (as obtained experimentally at 1000 °C) still has some amount of residual clumpiness. However, that does not diminish the usefulness of the heated gas as a convenient means of defining the zero of the clumpiness scale and the conventional clumped isotope thermometry based on this scale is perfectly reasonable. Sample numbers 20 and 21 refer to two cases of O2–CO2 reaction when there was no platinum in the reaction chamber. These data (ESI Table 1†) show that without platinum the two gases do not exchange their isotopes. However, a sample of CO2 heated without O2 and without platinum attains the randomness as before. This (ESI Table 1†) result probably shows that CO2 in presence of heated quartz alone may achieve randomness by a process which is quite different from the homogenization process due to catalyzed exchange with O2 on heated platinum. But both lead to randomness in the CO2 molecules in the reactor. This could be the reason that in case of CO–CO2 experiments there is reasonable exchange even when they are in heated quartz tube without any platinum.
The proposed mechanism is further supported by the results of CO–CO2 exchange carried out in a similar way using platinum. In this case the adsorbed species are CO, CO2 and O and the mixing takes place between CO coming from CO2 breakdown and the original CO. The rate constants are presumably much slower here and therefore the O-isotope ratios in the post-exchange gases are not equal in two hours of exchange. For 25 hours exchange at T = 700 °C (sample CO_CO2_5) the δ18O values (in ‰ VSMOW) obtained are: −94.3 (CO2) and −179.3 (CO). These values differ widely (by about 40‰) from the number −132.6‰, the estimated mean δ18O value (weighted by the respective mole amounts) if the two gases were mixed uniformly. For O-isotopes the mixing is mediated by the two sources of oxygen, CO molecules and O-atoms, but that is not so in case of C-isotopes (mediated only by CO). Therefore, the change (brought about in a given time and temperature) in case of δ13C value is much smaller. For Sample 5 the δ13C change in CO2 is about 40‰ which is lower than the δ18O change by more than a factor of two. The clumpiness of the CO2 samples from CO–CO2 exchange could not be measured due to slight contamination of CO (high δ49 value). In future, we plan to clean the CO2 by GC and analyze it for Δ47. We note that there is another means of checking the randomness in the exchange of CO2–O2. If the suggested mechanism is correct the isotopes in the O2 phase are also expected to be randomly distributed which can be checked by measuring the 18O18O abundance and comparing that to the one expected for random distribution.
E. Conclusions
O2 and CO2 do not react in simple gas phase but in presence of hot platinum they exchange their oxygen isotopes rapidly. It is known that this exchange carried out at ∼700 °C in a platinum containing quartz tube reaches a steady state in about two hours when the oxygen isotope ratios of the two gases become equal to each other within a few ‰. It is still not known how this exchange occurs in the microscopic scale. To get an insight, we carried out clumped isotope analysis of the post-exchange CO2 gas (following standard procedure outlined by the CALTECH group) which measures the abundance of 13C18O16O isotopologue (mass 47) in a sample of CO2 and calculates the deficiency of this species from the equilibrium thermodynamic prediction in terms of isotope anomaly Δ47. The magnitude of Δ47 gives the degree of randomness in the isotopic distribution of 13C, 18O and 16O to form the mass 47 species and has a value of nearly −1‰ (in the CALTECH scale) for a completely scrambled distribution. We find that the post-exchange CO2 has Δ47 value close to that expected from a random distribution. This suggests that two processes (exchange on platinum and scrambling due to heating) occur in tandem and can be explained simply as due to mixing of O-atoms and CO molecules formed by breakdown of the O2 and CO2 molecules to generate two homogeneous reservoirs on the platinum surface. We suspect that a similar process occurs on the quartz surface also but without any O2 adsorption because O2 and CO2 do not exchange in a quartz tube alone. We also found that CO and CO2 gas pairs exchange their oxygen and carbon isotopes which is only possible if CO2 breakdown to CO + O occurs in the adsorbed state and the CO gas also gets adsorbed and mixes with the CO from CO2 on the platinum surface, albeit with less efficiency.Acknowledgements
This work was supported by Divecha Centre for Climate Change. This manuscript was improved by thoughtful feedback from Prof. John Eiler. SKB acknowledges Academia Sinica, Taiwan and Centre for Earth Sciences, Indian Institute of Science, Bangalore, India for support and facilities.Notes and references
- J. M. Eiler and E. Schauble, Geochim. Cosmochim. Acta, 2004, 68, 4767–4777 CrossRef CAS.
- Z. Wang, E. A. Schauble and J. M. Eiler, Geochim. Cosmochim. Acta, 2004, 68, 4779–4797 CrossRef CAS.
- K. J. Dennis, H. P. Affek, B. H. Passey, D. P. Schrag and J. M. Eiler, Geochim. Cosmochim. Acta, 2011, 75, 7117–7131 CrossRef CAS.
- S. Mahata, S. K. Bhattacharya, C.-H. Wang and M.-C. Liang, Anal. Chem., 2013, 85, 6894–6901 CrossRef CAS PubMed.
- S. Mahata, S. K. Bhattacharya and M.-C. Liang, Rapid Commun. Mass Spectrom., 2016, 30, 119–131 CrossRef CAS PubMed.
- T. Osaki and T. Mori, React. Kinet. Catal. Lett., 2006, 89, 333–339 CrossRef CAS.
- O. Abe, Rapid Commun. Mass Spectrom., 2008, 22, 2510–2514 CrossRef CAS PubMed.
- I. Ahn, M. Kusakabe and J. I. Lee, Rapid Commun. Mass Spectrom., 2014, 28, 1321–1328 CrossRef CAS PubMed.
- R. Gonfiantini, W. Stichler and K. Rozanski, IAEA-TECDOC, 1995, 825, 13–29 Search PubMed.
- W. A. Brand, J. Mass Spectrom., 1996, 31, 225–235 CrossRef CAS.
- M. F. Miller, Geochim. Cosmochim. Acta, 2002, 66, 1881–1889 CrossRef CAS.
- P. Richet, a. Y. Bottinga and M. Javoy, Annu. Rev. Earth Planet. Sci., 1977, 5, 65–110 CrossRef CAS.
- H. C. Urey, J. Chem. Soc., 1947, 562–581 RSC.
- I. Chorkendorff and J. W. Niemantsverdriet, Concepts of modern catalysis and kinetics, John Wiley & Sons, 2006 Search PubMed.
- S. Bedrane, C. Descorme and D. Duprez, Appl. Catal., A, 2005, 289, 90–96 CrossRef CAS.
- Y. L. Sandler and D. Durigon, J. Phys. Chem., 1968, 72, 1051–1057 CrossRef CAS.
- Y.-H. Chin, C. Buda, M. Neurock and E. Iglesia, J. Am. Chem. Soc., 2011, 133, 15958–15978 CrossRef CAS PubMed.
- G. Boreskov, Adv. Catal., 1964, 15, 285–339 CAS.
- N. Niemantsverdriet and B. E. Nieuwenhuys, Catalysis and Surface Science, UNESCO-EOLSS, Paris, France, 2014 Search PubMed.
- G. Ertl, Angew. Chem., Int. Ed., 2008, 47, 3524–3535 CrossRef CAS PubMed.
- S. Renisch, R. Schuster, J. Wintterlin and G. Ertl, Phys. Rev. Lett., 1999, 82, 3839 CrossRef CAS.
- S. Akhter and J. White, Surf. Sci., 1986, 171, 527–542 CrossRef CAS.
- J. Wintterlin, S. Völkening, T. Janssens, T. Zambelli and G. Ertl, Science, 1997, 278, 1931–1934 CrossRef CAS PubMed.
Footnote |
| † Electronic supplementary information (ESI) available: ESI Tables 1–3. See DOI: 10.1039/c6ra08286f |
| This journal is © The Royal Society of Chemistry 2016 |

