Facile fabrication of reduced graphene oxide/CuI/PANI nanocomposites with enhanced visible-light photocatalytic activity†
Xiufang Wang*,
Jun Zhang,
Kehua Zhang,
Wensheng Zou and
Shaohua Chen
Anhui Key Laboratory of Advanced Building Materials, Anhui Jianzhu University, Hefei, Anhui, P. R. China. E-mail: wxfrye159@sina.com
First published on 3rd May 2016
Abstract
Novel reduced graphene oxide/CuI/polyaniline (rGO/CuI/PANI) heterostructure nanocomposites have been successfully synthesized by a simple self-assembly approach for the first time. Microstructure studies show the CuI nanoparticles and PANI nanorods evenly disperse on the surface of rGO. The results of photocatalytic experiments demonstrate that the rGO/CuI/PANI nanocomposites exhibit significantly enhanced photocatalytic activity for the degradation of organic pollutants and water splitting H2 production under visible light irradiation. It could be attributed to synergistic effects originating from the rGO/CuI/PANI heterostructures. The CuI/PANI heterostructures facilitate the transformation of electrons, which are excited by light irradiation in the conduction band of PANI. The rGO should be an electron transfer channel, which can readily reduce the recombination probability of photogenerated electron/hole pairs and enhance the charge separation efficiency, leading to higher photocatalytic performance and effectively inhibited photo-corrosion. Moreover, rGO/CuI/PANI composites show remarkable stability and cyclic performance. The present work provides new insights into the synthesis of GO-based heterostructures, and the developed nanocomposites would have potential applications in the energy and environmental related fields.
Introduction
Environmental issues and the energy crisis are becoming a serious challenge for society as they hinder economic growth and contaminate water resources, endangering both wildlife and human life.1 Solar energy conversion by photocatalysis has been attracting much interest as a promising technology for a sustainable future in the context of the aggravating energy and environmental problems such as pollution and global warming.2 Recently, semiconductor photocatalysts as a promising technique for solar energy conversion have been widely investigated with respect to the decomposition of toxic and hazardous organic pollutants as well as the generation of hydrogen towards solving these environmental and energy problems.3,4 However, photocatalysts still suffer from low quantum efficiency or poor stability.5 Remarkable strides have been made toward increasing the efficiency of solar energy conversion in the past few decades.Graphene is a two-dimensional single sheet of carbon atoms arranged in a hexagonal network, and the two dimensional graphene sheets possess exceptional mechanical characteristics, excellent optical transparency, superior electrical conductivity, high thermal conductivity, and large surface area.6–10 In addition to these, graphene could also dissociate the excited charge carrier at very fast rate to increase the photocatalytic activity. Therefore, more efforts and new strategies to synthesize grapheme or rGO/semiconductor composite photocatalysts are indispensable. In recent years, the explosion of grapheme/semiconductor composite photocatalysts research with improved solar-to-energy conversion efficiency has been witnessed, and using the graphene/semiconductor composite photocatalysts has become a large field on their own.11–17 Gao et al. prepared a Bi2WO6–graphene photocatalyst by an in situ hydrothermal reaction. It showed enhanced photocatalytic activity for the degradation of rhodamine B under visible light due to the electronic interaction and charge equilibration between graphene and Bi2WO6.18 Wu et al. described the preparation of α-Fe2O3/graphene composites for photocatalytic water oxidation.19 Investigations showed that electron transfer to the graphene could increase the charge separation and suppress the charge recombination, leaving long-lived holes in the α-Fe2O3 to oxidize water, increasing the photocatalytic water splitting rate. The work by Yang et al. demonstrated that the transfer of photogenerated electrons from the surface of Ag3PO4 to graphene sheets also reduces the possibility of decomposing Ag+ to metallic Ag, promising an improved stability of the recyclable Ag3PO4–graphene composite photocatalyst.20 In particular, the rGO has most of the excellent properties, thanks to its similar laminated structure with graphene, and also offers better dispersancy and binding force with other base materials due to the functional groups on its surface, which is conducive to construct various composites. It is more important that rGO is supposed to be an electron transfer channel, which is used to reduce the recombination of electron–hole pairs, thus enhancing photoconversion efficiency of the photocatalytic materials, resulting in enhanced photo-conversion efficiency of the photocatalytic materials. Because of these exceptional properties, more attention has been exclusively focused on combining rGO with active materials in order to synthesis photocatalysts. Wang et al. synthesized rGO/TiO2 nanocomposites, where monodisperse anatase TiO2 nanoparticles were deposited on the surface of rGO sheets without agglomeration. The as-prepared rGO/TiO2 nanocomposites exhibited enhanced photocatalytic activities compared to the reported rGO/P25 samples in both photocatalytic H2 evolution from a methanol solution and degradation of methylene blue.21 Guo et al. described the successful synthesis of Au@r-GO/TiO2 yolk@shell nanostructures and their high photocatalytic performances towards the decomposition of rhodamine B and water splitting H2 production had been demonstrated.22 Wang et al. prepared the Ag–AgBr/TiO2/rGO nanocomposite using the solvothermal–photoreduction method and demonstrated it was an efficient photocatalyst for the degradation of penicillin G in the presence of visible light.23 Zhang reported a nanocomposite of Cu2O/rGO/nano-chitosan with diverse functionalities by a feasible one-step in situ reduction synthesis. The superior photocatalytic ability of Cu2O@rGO@chitosan compared to the pristine Cu2O nanospheres and Cu2O@rGO nanocomposites was attributed to high porosity from rGO, an efficient charge transfer from Cu2O to rGO, and high adsorption ability of chitosan.24 Vinoth et al. developed the rGO supported AgI-meso TiO2 photocatalyst via a simple ultrasonic method. This composites exhibited high photocatalytic activity for the degradation of both MO and RhB dyes.25 Li et al. used solvothermal and microwave-assisted method to synthesize rGO/ZnIn2S4 nanocomposites with superior photocatalytic performance.26,27 Despite all the above efforts, rational design of rGO-based semiconductor composite photocatalysts with enhanced photocatalytic performances is still a great challenge.
Cuprous iodide (CuI), a semiconductor material, has attracted much attention due to its many particular features such as negative spin–orbit splitting, a large ionicity, anomalous diamagnetism behavior, new high-pressure phase and potential applications in solid-state solar cells, superionic conductor, and catalysis for the synthesis of organic compounds. The band gap of CuI is 3.1 eV, only UV light can excitate the CuI nanoparticles to generate electron–hole pairs, greatly impeding its widespread application. The functional groups present on GO or rGO surface have been most extensively used for anchoring the Cu2+ ions. Accordingly, Cu2O–graphite/graphene composites have been prepared using Cu2+ anchored GO dispersion at elevated temperatures in the presence of reducing agents such as glucose, ethylene glycol, or o-anisidine.28–30 Our group synthesized CuI/PANI nanocomposites using Cu2+ as the oxidant for aniline in the presence of KI.31 On this basis, we want to design and synthesize rGO/CuI/PANI nanocomposites, which will broaden the application field of CuI and synthesize novel nanocomposites. Moreover, there is still little work focusing on constructing rGO/CuI/PANI composites for visible light driven photocatalytic application.
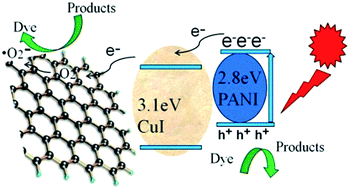
Heterostructured photocatalysts have a better performance than either of the parent phases, which are one of the most popular structures for enhanced photocatalytic activity. The presence of the heterojunctions changes the band bending at the interfaces and provides a driving force for the separation of photogenerated electrons and holes, so that the photocatalysts with heterojunctions can mitigate the effects of carrier recombination and back-reaction, which in turn increases photochemical reactivity. Suitable cocatalysts loaded on the surface of rGO can serve as active centers for pollutant degradation as well as H2 generation. Herein, we have reported the successful synthesis of rGO/CuI/PANI nanostructures and their high photocatalytic performances towards the decomposition of dyes and water splitting H2 production. In this synthesis, the functional groups on GO surface have anchored the Cu2+ ions and formed GO–Cu2+ complex. The Cu2+ ions and GO have been reduced to Cu+ and rGO using aniline as the reductant in the presence of KI, and the aniline has been oxidized into PANI. Accordingly, rGO/CuI/PANI composites have been synthesized (Scheme 1). Results from photocatalytic experiments suggest that rGO/CuI/PANI nanostructures show high photocatalytic performances in degradation of dyes and water-splitting H2 production under visible light irradiations, indicating their promising application as efficient visible light photocatalysts.
Experimental section
Materials
Aniline, graphite, potassium permanganate, sulfuric acid (98%), sodium nitrate, copper sulfate, potassium iodide and rhodamine B were all analytical-grade reagents (Shanghai Chemical Reagent Co. Ltd., China). The other reagents were used as received without further purification. Double distilled water was used throughout the experiment to prepare the solutions.Synthesis of rGO/CuI/PANI composite photocatalysts
Synthesis of rGO/CuI/PANI composites
In a typical experimental procedure, 50 mg of GO was first dispersed in 50 mL of water. To this suspension, 1.52 g CuSO4·5H2O was added. The solution was heated by a water bath at 60 °C for 12 h for immobilization of Cu2+ ions on the surface of GO under the mechanical stirring. The Cu2+–GO was collected from the solution, and washed three times with deionized water. The obtained Cu2+–GO was redispersed in 50 mL 0.5 M KI aqueous solution. 0.18 mL of aniline was added into above mixture under stirring for 8 h at room temperature.The possible chemical reactions can be formulated as the following eqn (1) and (2):
| Cu2+ + aniline + I− → CuI + PANI | (1) |
| GO + aniline → rGO + PANI | (2) |
Finally, the black precipitate was separated and washed with deionized water and ethanol. The as-prepared rGO/CuI/PANI products were dried at 60 °C in an oven under vacuum for 24 h.
For comparison, pure CuI, PANI, GO/CuI were also synthesized.
Characterization
SEM images were taken using a field-emission scanning electron microscope (JSM-7500F, Japan) operated at an accelerating voltage of 5 kV. TEM images were performed by using a JEM-2100F instrument with a field emission gun operating at 200 kV. XRD measurements were performed on a Philips X'pert MPD instrument using Cu Kα radiation (50 kV). XPS was performed on an ESCALAB-MKII spectrometer (VG Co., U.K.) with Al Kr X-ray radiation as the X-ray source for excitation. FTIR spectra were obtained using a NEXUS-870 spectrophotometer (frequency range from 4000 to 500 cm−1) with a KBr pellet. UV-vis absorption spectrum of the sample dispersed in distilled water through ultrasonic irradiation was obtained with U-4100 UV spectrophotometer in the range of 200–1000 nm. Raman spectra were measured with a Renishaw 2000 model confocal microscopy Raman spectrometer with a CCD detector and a holographic notch filter (Renishaw Ltd., Gloucestershire, UK).Photocatalytic activity measurement
Water splitting H2 production
10.0 mg catalyst was dispersed in 10.0 mL solution containing water and methanol (VH2O/Vmethanol = 3/1) under stirring for 20 min, and nitrogen was bubbled for 30 min to remove the dissolved oxygen and then sealed with a parafilm. The suspension was irradiated under stirring with a Xe light source through filters with nominal cutoff wavelength of λ < 420 nm, power density 100 mW cm−2. The photocatalytic system was maintained at room temperature. The gas produced was periodically withdrawn with a syringe and examined by a gas chromatography.Results and discussion
Morphology and structure characterization
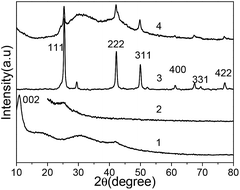
XRD patterns of the pure GO, PANI, CuI and rGO/CuI/PANI composites are shown in Fig. 1. As shown in curve 1, a diffraction peak appearing at around 2θ = 10.8° is observed, corresponding to an interlayer spacing of 0.87 nm larger than that of graphite (0.34 nm), which demonstrates the existence of oxygen containing functional groups such as hydroxyl and carboxyl groups.33 Pure PANI is amorphous and has a broad band at 28° (curve 2), which is ascribed to the periodicity parallel to the polymer chains of PANI.34 The diffraction peaks of the CuI nanocrystal can be indexed to the facial cubic cell of marshite CuI (γ-CuI) with lattice constant a = 6.051 Å, which agrees well with the reported data (JCPDS no. 06-0246), and it is confirmed by the observed distinctive reflection peaks at 2θ = 25.3, 42.1, 49.9, 61.2, 67.5 and 77.1 (curve 3). The XRD pattern of the rGO/CuI/PANI composites is present in curve 4. The diffraction peak at 10.8° disappears in the composite, and it indicates that GO sheets have been transformed to rGO, which is caused by the reducing action of aniline. The diffraction peak around 28° that appears in the curve means the existence of PANI. Moreover, besides the PANI broad peak, several sharp diffraction peaks appear, and they are the diffraction peaks of the CuI nanocrystal. The average diameter of the CuI nanoparticles is evaluated by the Scherrer equation, which is about 20 nm. These results confirm the presence of PANI and CuI in the composites.Fig. 2a shows the FTIR spectra of pure PANI, CuI, GO and rGO/CuI/PANI nanocomposites. In the case of GO, the broad and intense peak centered at 3410 cm−1, which is related to the OH groups, and the peak at 1720 cm−1 corresponds to the stretching vibrations of C![[double bond, length as m-dash]](https://www.rsc.org/images/entities/char_e001.gif) O carboxylic moieties. The peak at 1610 cm−1 is associated with the skeletal vibrations of aromatic C
O carboxylic moieties. The peak at 1610 cm−1 is associated with the skeletal vibrations of aromatic C![[double bond, length as m-dash]](https://www.rsc.org/images/entities/char_e001.gif) C bond or intramolecular hydrogen bonds. Other bands at 1390, and 1066 cm−1 correspond to C–O–H deformation and C–O stretching vibrations, respectively.35 Therefore, it suggests the existences of the abundance of hydroxyl and oxygenous groups on the surface of GO, which makes GO to be convenient for further modification with Cu2+. But in the rGO/CuI/PANI, the peaks at 1720 and 1066 cm−1 which assign to C
C bond or intramolecular hydrogen bonds. Other bands at 1390, and 1066 cm−1 correspond to C–O–H deformation and C–O stretching vibrations, respectively.35 Therefore, it suggests the existences of the abundance of hydroxyl and oxygenous groups on the surface of GO, which makes GO to be convenient for further modification with Cu2+. But in the rGO/CuI/PANI, the peaks at 1720 and 1066 cm−1 which assign to C![[double bond, length as m-dash]](https://www.rsc.org/images/entities/char_e001.gif) O vibrations and C–O stretching vibrations observed on GO decrease in the intensity, revealing that GO has been successfully reduced to rGO during the reaction process.27 For pure PANI, the peak at 1562 and 1495 cm−1 are due to the C
O vibrations and C–O stretching vibrations observed on GO decrease in the intensity, revealing that GO has been successfully reduced to rGO during the reaction process.27 For pure PANI, the peak at 1562 and 1495 cm−1 are due to the C![[double bond, length as m-dash]](https://www.rsc.org/images/entities/char_e001.gif) C stretching vibration of quinoid and benzenoid rings, and peak at 1283 cm−1 is related to the C–N stretching modes. The bands at 1130 and 825 cm−1 are the distinctive features of C–H in-plane and C–H out-of-plane bending, respectively. The CuI has no obvious peak, which is consistent with the literature report.31 It is noteworthy that, for rGO/CuI/PANI, some peaks assigned to PANI, such as 1495 and 825 cm−1, are blue-shifted. The peak at 1562, 1283 and 1130 cm−1 have been weakened. The hydrogen bonding and π–π interaction between the PANI ring and rGO might be responsible for these spectral evolutions.
C stretching vibration of quinoid and benzenoid rings, and peak at 1283 cm−1 is related to the C–N stretching modes. The bands at 1130 and 825 cm−1 are the distinctive features of C–H in-plane and C–H out-of-plane bending, respectively. The CuI has no obvious peak, which is consistent with the literature report.31 It is noteworthy that, for rGO/CuI/PANI, some peaks assigned to PANI, such as 1495 and 825 cm−1, are blue-shifted. The peak at 1562, 1283 and 1130 cm−1 have been weakened. The hydrogen bonding and π–π interaction between the PANI ring and rGO might be responsible for these spectral evolutions.
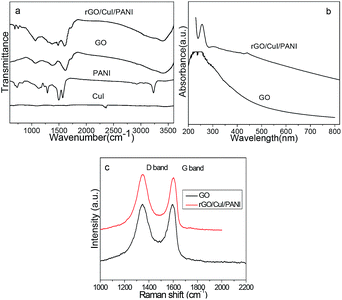 | ||
| Fig. 2 (a) FTIR spectra of PANI, GO and rGO/CuI/PANI; (b) UV-vis absorbance spectra of GO and rGO/CuI/PANI. (c) Raman spectra of GO and rGO/CuI/PANI. | ||
UV-vis absorbance spectra shown in Fig. 2b also prove the reduction of GO in rGO/CuI/PANI composites. The characteristic absorption peak of GO at about 228 nm red shifts to 258 nm in rGO/CuI/PANI, which is close to the characteristic peak of rGO at 270 nm. The absorption peak at 440 nm in composites is the characteristic peak of CuI, which originates from the excitation of electrons from the valance band to the conduction band. On the other hand, the composite material shows absorption in the 200–800 nm range, implying the introduction of PANI and CuI can broaden the visible light absorption.
Raman spectroscopy is the most direct and nondestructive technique for characterizing the structure and quality of carbon materials, particularly for identifying defects and ordered and disordered structures. The Raman spectrum of GO exhibits two significant peaks at approximately 1350 and 1580 cm−1 (Fig. 2c), which correspond to the D band and G band. The G band, which is related to the E2g vibration mode of sp2 carbon domains, can be used to determine the degree of graphitization. The D band is associated with structural defects and the partially disordered structures of the sp2 domains. For the spectrum of the nanocomposites, the intensity of both the D and G bands increases after the formation of CuI and PANI on the surface of the rGO nanosheets. At the same time, the ID/IG ratio increases from 0.96 to 1.18. Since the ratio of ID/IG is an indicator of the graphitization degree of carbonaceous materials, the higher ID/IG observed over the as-prepared nanocomposites as compared to that of GO suggests a successful reduction of GO to rGO in the nanocomposites.27 These results of the FT-IR and Raman spectra all confirm that GO is reduced to rGO in the resultant nanocomposites.
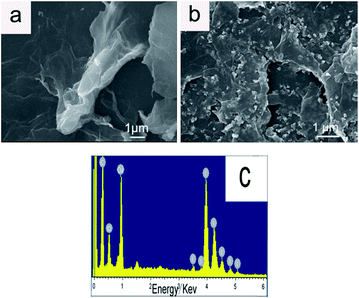
The morphologies of GO and rGO/CuI/PANI nanocomposites are visualized using SEM (Fig. 3). As shown in Fig. 3a, wrinkled and aggregated nanosheets are observed. The crumpled and overlaid nanosheets of GO indicate that multilayer nanosheets are formed. The clear contrast between CuI nanoparticles and rGO is observed, and the CuI nanoparticles are grown and deposited on rGO nanosheets with narrow particle sizes, as observed in Fig. 3b. The CuI nanoparticles have been assembled uniformly on the surface of rGO. The uniform distribution of CuI nanoparticles on rGO sheets can minimize the aggregation of nanoparticles and maximize the reactive sites. The diameter of CuI is around 20 nm, which is corresponding to the value calculated by the Scherrer equation. There are some nanorods in the composites, they are should be PANI. On the basis of the TG curve (Fig. S1†), the amount of GO, PANI and CuI in nanocomposites is estimated to be about 19%, 13% and 68%. The CuI nanoparticles in rGO/CuI composites become large and irregular with wide particle sizes (Fig. S2†), which may affect the photocatalytic effect (see Fig. 6c). In Fig. 3c, the distributions of Cu, I, C and O have been shown in the picture. There are no other impurities existing in the rGO/CuI/PANI composites.
The morphology and microstructure of the sample is analyzed by TEM. As is shown in Fig. 4a, the blank-GO exhibits the sheet-like morphology with a smooth surface. The crumpled membrane indicates that GO sheets are flexible, and also GO sheets are multilayer rather than a single layer, which further confirms the results of the sharp peak in XRD patterns of GO. The morphology of rGO/CuI/PANI nanocomposites is evidently different from that of sole GO. The TEM image of rGO/CuI/PANI in Fig. 4b clearly shows the uniform distribution of spherical CuI nanoparticles over the nanosheet surface (see white arrows). The average particle size of the CuI nanoparticles is found to be around 20 nm. The uniform nanofibers should be PANI. The average diameter of PANI is about 3 nm, and length is 100 nm (see black arrows). The PANI and CuI nanoparticles are fixed on the stacked rGO sheets, which is consistent with the results of SEM and XRD. All the results indicate that rGO/CuI/PANI nanocomposites have been successfully synthesized. The HRTEM image is shown in Fig. 4c. The interplanar distance is determined to be 0.318 nm, which coincides well with the d-spacing value of the (111) plane of the cubic CuI crystal, demonstrating the high crystallinity of the product. Meanwhile, the selected area electron diffraction (SAED) reveals that the nanoparticles are single crystal structure (Fig. 4d).
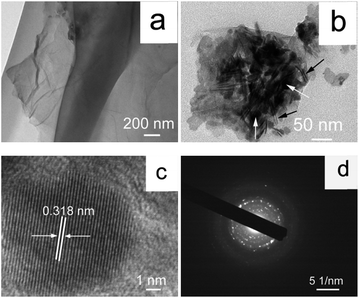 | ||
| Fig. 4 TEM images of GO (a), rGO/CuI/PANI (b), high-resolution TEM image of rGO/CuI/PANI (c), and SAED pattern (d). | ||
Fig. 5 exhibits the X-ray photoelectron spectroscopy results of the freshly obtained rGO/CuI/PANI sample for further investigating the elemental compositions and chemical states. As the full XPS spectrum of rGO/CuI/PANI composites (Fig. 5a) shows all detected elements are C, O, N, Cu, and I, which is consistent with the formation of rGO/CuI/PANI composites. Fig. 5b presents a high resolution XPS spectrum of C 1s from rGO/CuI/PANI. The XPS peak of C 1s is decomposed into five Gaussian peaks at 284.4, 285.6, 286.5, 287.8, and 289.1 eV, corresponding to C![[double bond, length as m-dash]](https://www.rsc.org/images/entities/char_e001.gif) C/C–C in aromatic rings, C–O/C–N, epoxy C–O–C, C
C/C–C in aromatic rings, C–O/C–N, epoxy C–O–C, C![[double bond, length as m-dash]](https://www.rsc.org/images/entities/char_e001.gif) O/C
O/C![[double bond, length as m-dash]](https://www.rsc.org/images/entities/char_e001.gif) N, and carboxyl COOH groups, respectively, which confirms the characteristic peaks of rGO. The high-resolution N 1s spectrum (Fig. 5c) shows a peak at 399.4 eV for the C
N, and carboxyl COOH groups, respectively, which confirms the characteristic peaks of rGO. The high-resolution N 1s spectrum (Fig. 5c) shows a peak at 399.4 eV for the C![[double bond, length as m-dash]](https://www.rsc.org/images/entities/char_e001.gif) N bond, 401.7 eV for N–C, and 402.0 eV for –NH2. They are the characteristic peaks of PANI. Fig. 5d and e show XPS spectra of Cu 2p and I 3d core level acquired from an as-prepared sample. The positions of the peaks of Cu 2p1/2 and 2p3/2 of the sample are 952.2 eV and 932.2 eV, respectively, without the shake-up, which implies a feature of Cu+. The peak positions of I 3d, 619.5 eV and 631.0 eV are in good agreement with the literature data for CuI material.31 The formation of rGO/CuI/PANI nanocomposites can be ascribed to multiple interactions in the precursors solution: (1) the adsorbed Cu2+ ions and GO are reduced by excess aniline, at the same time, the aniline is oxidized to PANI, and (2) the π–π stacking, hydrophobic interaction and electrostatic attraction between rGO and PANI, then the rGO/CuI/PANI composites are formed.
N bond, 401.7 eV for N–C, and 402.0 eV for –NH2. They are the characteristic peaks of PANI. Fig. 5d and e show XPS spectra of Cu 2p and I 3d core level acquired from an as-prepared sample. The positions of the peaks of Cu 2p1/2 and 2p3/2 of the sample are 952.2 eV and 932.2 eV, respectively, without the shake-up, which implies a feature of Cu+. The peak positions of I 3d, 619.5 eV and 631.0 eV are in good agreement with the literature data for CuI material.31 The formation of rGO/CuI/PANI nanocomposites can be ascribed to multiple interactions in the precursors solution: (1) the adsorbed Cu2+ ions and GO are reduced by excess aniline, at the same time, the aniline is oxidized to PANI, and (2) the π–π stacking, hydrophobic interaction and electrostatic attraction between rGO and PANI, then the rGO/CuI/PANI composites are formed.
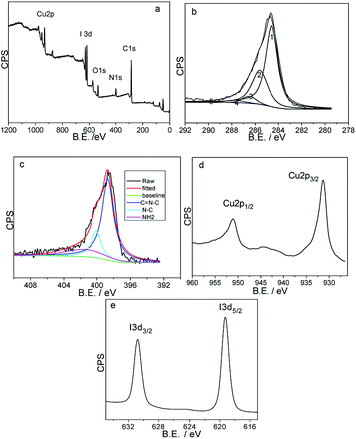 | ||
| Fig. 5 XPS scans of rGO/CuI/PANI nanocomposites (a) survey spectrum (b) C 1s, (c) N 1s, (d) Cu 2p and (e) I 3d. | ||
Photocatalytic performances of rGO/CuI/PANI heterostructures
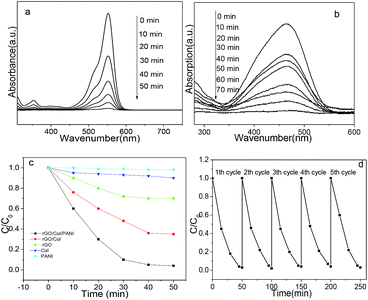
It is believed that the rGO/CuI/PANI composites may have the potential to enhance their visible light photocatalytic performances for the photocatalytic degradation of the organic dyes. The catalytic activity of the rGO/CuI/PANI composites is firstly investigated by photodegradation of RhB under visible light irradiation. Without any catalyst, nearly no degradation of RhB is detected under visible-light irradiation during the catalytic period, and the target molecule RhB is relatively stable in aqueous solutions. Furthermore, a photodegradation reaction cannot be observed in the presence of rGO/CuI/PANI samples when the reaction mixture is maintained in darkness. Similar results can be also observed from MO solution with the same model reactions. When the as-synthesized rGO/CuI/PANI composites are added into the solution, but performed in dark, very little degradation of RhB is found even when the irradiation time is prolonged to 4 h. Therefore, the light illumination is necessary for efficient degradation, and the degradation of RhB is caused by the photocatalytic reactions on rGO/CuI/PANI samples. The characteristic absorption of RhB at λ = 553 nm is used to monitor the photocatalytic degradation process. Fig. 6a shows the UV-vis absorption spectra of the aqueous solution of RhB with rGO/CuI/PANI as photocatalyst for various durations. The absorption decreases rapidly with the extension of the exposure time, and completely disappears only after about 50 min. So the rGO/CuI/PANI catalyst shows the excellent photocatalytic activity for degradation of RhB. Although the as-prepared rGO/CuI/PANI composites exhibit higher visible-light-driven photocatalytic activity, the stability during photocatalytic reactions is also important in view of its applications. To evaluate the stability and renewable catalytic activity of the composites, the circulating runs in the photocatalytic degradation of RhB under visible light irradiation are also investigated. As shown in Fig. 6d, it can be seen that the photocatalytic activity of the composites does not show any obvious loss after five recycles for the photodegradation of RhB. It suggests that the composites are stable and have not been photocorroded during the photocatalytic degradation of the model dye molecules, which is very important for its practical applications. Fig. 6b shows the UV-vis absorption spectrum of MO with rGO/CuI/PANI powder as photocatalyst with the increase of time. In 70 min, the MO is degraded completely, and this indicates that the rGO/CuI/PANI photocatalyst also shows enhanced photocatalytic activity for the degradation of MO.As a comparison, RhB photodegradation using different samples is also performed under the same conditions. The concentration of RhB in the presence of pure PANI and CuI has almost no change in 50 min (Fig. 6c). Moreover, only 25% RhB can be photodegraded by pure rGO after 50 min. The RhB degrading rate of rGO/CuI sample reaches 78%. The rGO/CuI/PANI sample shows the highest activity with an RhB degrading rate of 96%. One side, rGO and PANI process large specific surface area and have a strong affinity to the organic dye molecules by π–π interactions. The different photodegradation rates may be attributed to the electrostatic interaction between dyes and PANI and rGO, which affects the adsorption results on surface of the samples. Good adsorption helps in promoting the photodegradation of the dyes while poor adsorption is not conducive to the photochemical reactions. On the other hand, rough surface and good dispersibility of the composites can provide more reactive adsorption/desorption sites for adsorption of dye pollutants, which is especial important for enhancing the catalytic degradation efficiency.
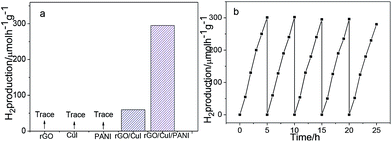
Currently, H2 has been established to be one of the most clean, sustainable, and alternative fuels because of its high energy density and environmentally-friendly product from water. To further investigate the enhanced photocatalytic property of the rGO/CuI/PANI heterostructures, the evolution of H2 is measured in the presence of methanol, a sacrificial hole scavenger under simulated sunlight irradiation. Fig. 7a shows the photocatalytic H2 production performances of rGO, CuI, PANI, rGO/CuI, and rGO/CuI/PANI composites. The CuI, rGO and PANI have almost no photocatalytic activity in H2 generation under visible light irradiation, and the rGO/CuI hybrids show enhanced photocatalytic activity. As for rGO/CuI/PANI composites, the H2 evolution rate increases to 295 μmol h−1 g−1 with 0.80% apparent quantum efficiency (over 5 h), which is much higher (3.7 times) than that of rGO/CuI composites (80 μmol h−1 g−1). These results indicate that the rGO/CuI/PANI heterostructures have the highest photocatalytic activity among these materials. Additionally, the stability of photocatalysts is tested by cycle photocatalytic H2 production experiments (Fig. 7b). After the five cycles, no significant decay in the photocatalytic activity is observed in the investigation, suggesting that rGO/CuI/PANI composites have good stability in photocatalytic H2 production.
Since photoluminescence (PL) spectrum is generally utilized to investigate the recombination rate of the photo-generated charger carriers, the PL spectra of pure CuI and rGO/CuI/PANI have also been investigated (Fig. S3†). The intensity of the PL peak on rGO/CuI/PANI nanocomposites decreases as compared to that of pure CuI, indicating the incorporation of rGO and PANI leads to a decrease of the recombination rate in the nanocomposites. Therefore, the highly reductive rGO and PANI in the nanocomposites can serve as a good mediator as well as the co-catalyst, which contributes to their highly enhanced photocatalytic performance. Accordingly, the excellent photocatalytic activity of rGO/CuI/PANI composites under visible light irradiation can be rationalized as illustrated in Scheme 2. The band gap of CuI is 3.1 eV, only UV light can excitate the CuI nanoparticles to generate electron–hole pairs. PANI has a band gap of 2.8 eV, which is narrower than the 3.1 eV band gap of CuI, showing strong absorption in the region of visible light.35 Under visible light irradiation, PANI is photoexcited, and then charge separation is accomplished, where the electrons transfer from PANI to CuI conduction band leading to the generation of holes remained in PANI. The excited electrons are captured by oxygen molecular which adsorbed on the rGO surface, and then produces superoxide anion radicals (˙O2−). Such radicals (˙O2−) are powerful oxidizing species for the degradation of dye molecules. Moreover, the electrons on the conduction band of CuI further transfer to the rGO nanosheets, because the redox potential of graphene/graphene is slightly lower than the conduction band level of the CuI. The highly electron mobility on rGO is due to its excellent electric conductivity. Therefore, both the rGO surface and the conduction band of CuI can functional used as the active sites for H2 production. Consequently, the rGO/CuI/PANI composites show the best photocatalytic activity in H2 production.
Conclusions
In summary, rGO/CuI/PANI heterostructure nanocomposites have been successfully fabricated through a simple self-assembly approach. Results from catalytic investigations of rGO/CuI/PANI nanocomposites towards the degradation of organic pollution and H2 production indicate that the heterostructures not only possess very high photocatalytic activity under visible light irradiations, but also have a good recyclability, which is attributed to synergistic effects originating from the rGO/CuI/PANI heterostructures. The superior photocatalytic performances of rGO/CuI/PANI composites clearly indicate their potential as efficient visible light photocatalysts. It is believed that the proposed strategy gives a promising route for construction GO-based other heterostructure composites for broader applications.Acknowledgements
This work was supported by the Natural Science Foundation of China (21301004), and the Natural Science Foundation of Anhui Province (1408085MB27, 1408085MB33).Notes and references
- J. Tian, Z. Zhao, A. Kumar, R. I. Boughton and H. Liu, Chem. Soc. Rev., 2014, 43, 6920–6937 RSC.
- N. Zhang, R. Ciriminna, M. Pagliaro and Y. J. Xu, Chem. Soc. Rev., 2014, 43, 5276–5287 RSC.
- J. Tian, Y. Sang, G. Yu, H. Jiang, X. Mu and H. Liu, Adv. Mater., 2013, 25, 5075–5080 CrossRef CAS PubMed.
- X. Q. Xie, K. Kretschmer and G. X. Wang, Nanoscale, 2015, 7, 13278–13292 RSC.
- J. Liu, Y. Liu, N. Liu, Y. Han, X. Zhang, H. Huang, Y. Lifshitz, S. T. Lee, J. Zhong and Z. Kang, Science, 2015, 347, 970–974 CrossRef CAS PubMed.
- C. Lee, X. D. Wei, J. W. Kysar and J. Hone, Science, 2008, 321, 385–388 CrossRef CAS PubMed.
- R. R. Nair, P. Blake, A. N. Grigorenko, K. S. Novoselov, T. J. Booth, T. Peres, N. M. R. Stauber and A. K. Geim, Science, 2008, 320, 1308 CrossRef CAS PubMed.
- H. Xia, C. Y. Hong, B. Li, B. Zhao, Z. X. Lin, M. B. Zheng, S. V. Savilov and S. M. Aldoshin, Adv. Mater., 2015, 25, 627–635 CAS.
- A. A. Balandin, S. Ghosh, W. Bao, I. Calizo, D. Teweldebrhan, F. Miao and C. N. Lau, Nano Lett., 2008, 8, 902–907 CrossRef CAS PubMed.
- S. Stankovich, D. A. Dikin, G. H. B. Dommett, K. M. Kohlhaas, E. J. Zimney, E. A. Stach, R. D. Piner, S. T. Nguyen and R. S. Ruoff, Nature, 2006, 442, 282–286 CrossRef CAS PubMed.
- J. Liu, Y. Liu, N. Liu, Y. Han, X. Zhang, H. Huang, Y. Lifshitz, S. T. Lee, J. Zhong and Z. Kang, Science, 2015, 347, 970–974 CrossRef CAS PubMed.
- M. Q. Yang, N. Zhang, M. Pagliaro and Y. J. Xu, Chem. Soc. Rev., 2014, 43, 8240–8254 RSC.
- M. Q. Yang and Y. J. Xu, Phys. Chem. Chem. Phys., 2013, 15, 19102–19118 RSC.
- N. Zhang, Y. Zhang and Y. J. Xu, Nanoscale, 2012, 4, 5792–5813 RSC.
- N. Zhang, Y. Zhang, M. Q. Yang and Y. J. Xu, Curr. Org. Chem., 2013, 17, 2503–2515 CrossRef CAS.
- Q. Xiang, J. Yu and M. Jaroniec, Chem. Soc. Rev., 2012, 41, 782–796 RSC.
- G. Xie, K. Zhang, B. Guo, Q. Liu, L. Fang and J. R. Gong, Adv. Mater., 2013, 25, 3820–3839 CrossRef CAS PubMed.
- E. P. Gao, W. Z. Wang, M. Shang and J. H. Xu, Phys. Chem. Chem. Phys., 2011, 13, 2887–2893 RSC.
- F. Meng, J. Li, S. K. Cushing, J. Bright, M. Zhi, J. D. Rowley, Z. Hong, A. Manivannan, A. D. Bristow and N. Wu, ACS Catal., 2013, 3, 746–751 CrossRef CAS.
- X. Yang, H. Cui, Y. Li, J. Qin, R. Zhang and H. Tang, ACS Catal., 2013, 3, 363–369 CrossRef CAS.
- Z. Wang, B. Huang, Y. Dai, Y. Liu, X. Zhang, X. Qin, J. Wang, Z. Zheng and H. Cheng, CrystEngComm, 2012, 14, 1687–1692 RSC.
- M. G. Wang, J. Han, H. X. Xiong and R. Guo, Langmuir, 2015, 31, 6220–6228 CrossRef CAS PubMed.
- J. Wang, C. An, J. Liu, G. Xi, W. Jiang, S. Wang and Q. H. Zhang, J. Mater. Chem. A, 2013, 1, 4718–4727 Search PubMed.
- Z. H. Zhang, S. Y. Zhai, M. H. Wang, H. F. Ji, L. H. He, C. M. Ye, C. B. Wang, S. M. Fang and H. Z. Zhang, J. Alloys Compd., 2016, 659, 101–111 CrossRef CAS.
- R. Vinoth, P. Karthik, C. Muthamizhchelvan, B. Neppolian and M. Ashokkumar, Phys. Chem. Chem. Phys., 2016, 18, 5179–5191 RSC.
- L. Ye, J. L. Fu, Z. Xu, R. S. Yuan and Z. H. Li, ACS Appl. Mater. Interfaces, 2014, 6, 3483–3490 CAS.
- L. Ye and Z. H. Li, Appl. Catal., B, 2014, 160–161, 552–557 CrossRef CAS.
- X. Li and M. Wan, Cryst. Growth Des., 2006, 6, 2661–2666 CAS.
- C. H. B. Ng and W. Y. Fan, J. Phys. Chem. C, 2007, 111, 9166–9171 CAS.
- Y. Xu, D. Chen, X. Jiao and L. Ba, J. Phys. Chem. C, 2007, 111, 6–10 CAS.
- X. F. Wang, Y. H. Shen, A. J. Xie, S. K. Li and Y. Wang, J. Mater. Chem., 2011, 21, 9641–9646 RSC.
- W. S. Hummers and R. E. Offeman, J. Am. Chem. Soc., 1958, 80, 1339 CrossRef CAS.
- T. Ni, L. Xu, Y. P. Sun, W. Yao, T. Y. Dai and Y. Lu, ACS Sustainable Chem. Eng., 2015, 3, 862–870 CrossRef CAS.
- X. F. Wang, Y. H. Shen, A. J. Xie and S. H. Chen, Mater. Chem. Phys., 2013, 140, 487–492 CrossRef CAS.
- W. Shao, H. Liu, X. Liu, S. Wang and R. Zhang, RSC Adv., 2015, 5, 4795–4803 RSC.
Footnote |
| † Electronic supplementary information (ESI) available. See DOI: 10.1039/c6ra08358g |
| This journal is © The Royal Society of Chemistry 2016 |


