Methoxycarbonylation of 1,6-hexanediamine with dimethyl carbonate to dimethylhexane-1,6-dicarbamate over Zn/SiO2 catalyst†
Lina Zhangab,
Hongguang Liab,
Feng Lia,
Yanfeng Pua,
Ning Zhao*ac and
Fukui Xiao*ac
aState Key Laboratory of Coal Conversion, Institute of Coal Chemistry, Chinese Academy of Sciences, Taiyuan 030001, PR China. E-mail: zhaoning@sxicc.ac.cn; xiaofk@sxicc.ac.cn; Fax: +86-0351-4041153
bUniversity of Chinese Academy of Sciences, Beijing 100049, PR China
cNational Engineering Research Center for Coal-based Synthesis, Taiyuan 030001, PR China
First published on 20th May 2016
Abstract
The heterogeneous Zn/SiO2 catalysts for the synthesis of dimethylhexane-1,6-dicarbamate (HDC) from 1,6-hexanediamine (HDA) and dimethyl carbonate (DMC) were prepared by incipient impregnation. The catalysts were characterized by BET, TG, FT-IR, TEM and XPS, and the results revealed that the activated Zn(OAc)2 in catalysts was responsible for the main active sites for the reaction. The Zn/SiO2(300) catalyst exhibited the best catalytic performance with HDA conversion of 96.0% and HDC yield of 68.5% owing to the most amount of activated Zn(OAc)2 and the highest binding energy of Zn 2p3/2. No obvious deactivation on the catalyst was found after 5 recycles due to the appropriate interaction between Zn(OAc)2 and SiO2. In addition, the results of in situ FT-IR experiments revealed that DMC was activated by the catalyst to form a stable intermediate that was then attacked by HDA with a typical nucleophilic addition–elimination reaction to produce HDC.
Introduction
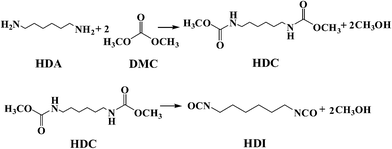
Hexamethylene-1,6-diisocyanate (HDI), as the most important aliphatic diisocyanate, has been widely applied in the manufacture of polyurethane coatings, synthetic fibers and elastomers.1,2 Conventionally, HDI is industrially synthesized by the phosgenation of 1,6-hexanediamine (HDA), which involves the use of extremely toxic phosgene and serious corrosion from the by-product HCl.3,4 Therefore, the exploration of an environmentally friendly synthetic route is highly desired. Several studies have been reported for non-phosgene syntheses of isocyanate5–11 among which the thermal decomposition of dimethylhexane-1,6-dicarbamate (HDC) has been considered as an attractive process for the synthesis of HDI,12,13 due to the fact that HDC can be synthesized from the green reagent dimethyl carbonate (DMC), which can replace phosgene for the methoxycarbonylation of HDA under mild reaction conditions14–16 (Scheme 1). Moreover, the only by-product in the process is methanol that can be recycled for synthesis of DMC.17–19 Thus, the two processes can be coupled to reduce the production cost and form a green economic synthesis route.In this route, the synthesis of HDC by methoxycarbonylation of HDA with DMC is a crucial step. Several homogeneous catalysts have been explored for the reaction, such as Bi(NO3)2,16 NaOAc,20 Sc(OTf)3,21 CH3ONa,22 TBD23 and ionic liquids MIm(CH2)4SO3HTfO,24 which exhibit excellent catalytic performance. However, the homogeneous catalysts are associated with the problems of product separation and catalyst recovery. As a result, various heterogeneous catalysts have been explored. Li et al. found that the yield of HDC could reach to 84.2% for AlSBA-15 catalyst after 35 h.25 Sun et al. prepared zinc-incorporated berlinite (ZnAlPO4) catalyst and a yield of HDC up to 92.5% with almost 100% conversion of HDA was obtained.26 However, the preparation of catalysts was complex and time-consuming. Li et al. reported MgO/ZrO2 solid base catalyst over which the HDC yield was 53.1%.27 However, the yield decreased to 35.3% after 3 recycles. They also prepared ZrO2/SiO2 metallic oxide catalyst and the yield of HDC was only 39.5% under the optimum reaction conditions.28 Therefore, it is necessary to explore a novel heterogeneous catalyst which is highly efficient, easy to prepare and steady for the synthesis of HDC.
Zn(OAc)2, one of the most efficient homogeneous catalysts for alkoxycarbonylation of amines with organic carbonates, showed the best catalytic activity for the synthesis of aromatic carbamate, such as dimethyltoluene-2,4-dicarbamate (TDC),29–31 dimethyl-4,4′-methylenediphenyldicarbamate (MDC)29,31,32 and 1,5-naphthalene dicarbamate (NDC).33 In the catalytic methoxycarbonylation of alkyl amines with DMC, the transformation of Zn(OAc)2 coordination mode can activate DMC that favors the following reaction with amines.30,33 In addition, SiO2 has been widely used as catalyst support due to the large specific surface area and the rich surface Si–OH, which can facilitate the dispersion of active component and improve the catalyst stability.
To the best of our knowledge, the load of Zn(OAc)2 on SiO2 support as heterogeneous catalyst for the synthesis of HDC from DMC and HDA has not been reported before. So, in this work, the Zn/SiO2 catalysts are prepared by incipient impregnation and firstly tested for the synthesis of HDC. The influence of calcination temperature on catalytic performance is studied in detail. In addition, the reaction mechanism is proposed based on in situ FT-IR experiments.
Experimental section
Catalyst preparation
A typical incipient impregnation procedure for the preparation of Zn/SiO2 catalysts is described as follows: 0.33 g of Zn(OAc)2 were dissolved in 7 g of distilled water. The solution was impregnated into 3 g of SiO2 and maintained overnight at room temperature. The obtained sample was dried under vacuum at 60 °C for 12 h and then calcined at different temperature for 2 h at a heating rate of 1 °C min−1. The calcined catalysts are denoted as Zn/SiO2(T), where T represents the calcination temperature (200 °C, 300 °C, 400 °C, 500 °C, 600 °C), and the uncalcined catalyst is denoted as Zn/SiO2(60).Catalytic activity evaluation and product analysis
The synthesis of HDC was carried out in a 50 mL stainless steel autoclave equipped with a magnetic stirrer. Typically, 1.17 g HDA, 1.82 g DMC and 0.37 g catalyst were charged into a Teflon vessel and then the mixture was stirred constantly, heated to 80 °C for 6 h. After reaction, the autoclave was cooled to room temperature and the reaction mixture was dissolved into 50 mL CH3OH. The catalyst was separated by filtration and the filtrate was quantificationally analyzed by gas chromatography equipped with a flame ionization detector on a capillary column Agilent DB-1 (60 mm × 0.25 mm 20.25 μm). The qualitative analysis of the filtrate was conducted by GC-MS (Fig. S1†). The gasification temperature was 280 °C and the detection temperature was 240 °C. The column temperature was program-controlled as following: the initial column temperature was 160 °C, increased to 240 °C at a rate of 5 °C min−1, and then maintained for 10 min. NH2(CH2)6NHCOOCH3 (HMC) and (CH3)2N(CH2)6NHCOOCH3 (N,N′-HMC) were detected as the main by-products. The conversion of HDA and the yield of HDC were determined using biphenyl as the internal standard,34 and the yield of by-products was calculated by the area normalization method.26 The qualitative identity of HDC was also conducted by FT-IR (Fig. S2†).Catalyst characterization
The Zn content of catalysts was determined by Thermo iCAP 6300 inductively coupled plasma spectrometer (ICP).Brunauer Emmett Teller (BET) measurement was performed on a Micromeritics Tristar II (3020) instrument to analyze the specific surface area, the pore volume and the average pore diameter of catalysts.
Thermogravimetric analysis (TGA) was performed on a Setaram Setsys Evolution TGA 16/18 analyzer with 60 mL min−1 of air flow from 25 to 800 °C at a heating rate of 10 °C min−1.
Fourier transform infrared spectroscopy (FT-IR) was carried on a Nicolet Nexus 470 FT-IR Spectrometer over a range of 4000–400 cm−1 with 64 scans and a resolution of 2 cm−1.
The in situ FT-IR experiments were conducted as follows: 10 mg sample was pressed to a Φ13 mm self-supporting pellet and placed in the in situ FT-IR apparatus equipped with CaF2 windows. The sample was pretreated by heating at 80 °C in vacuum for 1 h to purify the surface of catalyst, and then cooled to room temperature. The reactants were introduced into the apparatus as vapor-phase by vacuum evaporation at room temperature for 20 min and the non-activated gaseous reactants were removed with evacuation at room temperature for 5 min.35–37 After that, the sample was heated to the desired temperature for FT-IR spectra measurement on a Nicolet Nexus 470 FT-IR Spectrometer over the region of 4000–1250 cm−1.
X-ray photoelectron spectroscopy (XPS) measurement was performed over a Kratos Axis Ultra Dld spectrometer equipped with Al Kα radiation (hν = 1486.6 eV) under ultrahigh vacuum. The binding energies were calibrated internally by adventitious carbon deposition C 1s with Eb = 284.8 eV.
Transmission electron microscopy (TEM) was performed on a JEOL JEM2010 electron microscope operated at an acceleration voltage of 200 kV.
Scanning electron microscopy (SEM) was carried out on a JEOL JSM-7001F electron microscope with an acceleration voltage of 15 kV. XEDS analysis was used to record elemental mapping to observe the distribution of element.
Results and discussion
Characterization of catalysts
The texture parameters of Zn/SiO2 catalysts are summarized in Table 1. With the increase of calcination temperature, the specific surface area increases from 293.1 m2 g−1 to 317.0 m2 g−1, and the pore volume increases from 0.82 cm3 g−1 to 0.89 cm3 g−1, suggesting that high calcination temperature is beneficial to release more active space and thus increases the specific surface area and pore volume.| Catalyst | SBET (m2 g−1) | Pore volume (cm3 g−1) | Average pore diameter (nm) |
|---|---|---|---|
| Zn/SiO2(60) | 293.1 | 0.82 | 11.2 |
| Zn/SiO2(200) | 297.1 | 0.83 | 11.2 |
| Zn/SiO2(300) | 301.9 | 0.86 | 11.3 |
| Zn/SiO2(400) | 307.2 | 0.87 | 11.3 |
| Zn/SiO2(500) | 316.5 | 0.89 | 11.3 |
| Zn/SiO2(600) | 317.0 | 0.89 | 11.3 |
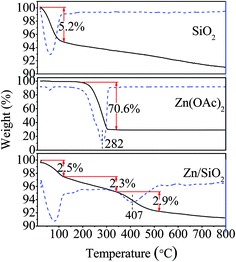
The thermogravimetric analysis of SiO2, Zn(OAc)2 and Zn/SiO2 catalyst are shown in Fig. 1. For SiO2, the major weight loss of 5.2% is observed in the temperature range of 25–120 °C, which can be ascribed to the elimination of physically adsorbed water. With the temperature increased to 800 °C, the weight of SiO2 gradually decreases due to the dehydroxylation of surface Si–OH. For Zn(OAc)2, an obvious weight loss of 70.6% between 220 °C and 340 °C is assigned to the thermal decomposition of Zn(OAc)2 to ZnO. While for Zn/SiO2 catalyst, the weight loss consists of three distinct steps. The first weight loss of 2.5% in the temperature range of 25–120 °C corresponds to the release of physically adsorbed water on the surface of catalyst. The second weight loss of 2.3% between 120 °C and 340 °C is higher than that of pure SiO2, indicating that some of Zn(OAc)2 begin to decompose and the decomposition temperature is almost the same as that of pure Zn(OAc)2. According to previous report, the decomposed Zn(OAc)2 independently exists on catalyst as microcrystal with weak interaction with support.32 The third weight loss of 2.9% in the temperature range of 340–520 °C can be attributed to the thermal decomposition of Zn(OAc)2 to ZnO. Compared with the pure Zn(OAc)2, the position of the weight loss peak shifts to higher temperature in the DTG curve (from 282 °C to 407 °C), indicating better thermal stability of Zn(OAc)2 as a result of the interaction between Zn(OAc)2 and SiO2. Upon increasing the temperature from 520 °C to 800 °C, the weight loss of Zn/SiO2 catalyst is the same as that of pure SiO2, suggesting the dehydroxylation of surface Si–OH and the complete decomposition of Zn(OAc)2 to ZnO. On the basis of above discussion, it can be concluded that Zn(OAc)2 exists in different forms at different calcination temperature. When calcination temperature is below 340 °C, Zn(OAc)2 stands independently on catalyst with weak interaction with SiO2. When calcination temperature is in the range of 340–520 °C, the interaction between Zn(OAc)2 and SiO2 becomes stronger, while at calcination temperature higher than 520 °C, Zn(OAc)2 completely decomposes to ZnO.
The morphologies of Zn/SiO2 catalysts calcined at 60 °C, 300 °C, 600 °C are shown in Fig. 2. Typical structure of support is observed for Zn/SiO2(60). It is found that the structure is well maintained and the Zn species is uniformly distributed on the surface of SiO2 after calcination, in accordance with the results of XRD (Fig. S3†). In order to further illustrate the distribution of Zn species, the EDS elemental mapping is measured and the images are presented in the insets of Fig. 2. It can be seen that the Zn species is highly dispersed on the surface of SiO2, suggesting that SiO2 can effectively restrain the aggregation of active component. The lattice fringes with interplanar spacing of 0.24 nm in Zn/SiO2(600) catalyst can be associated with the (101) facet of ZnO that corresponds to the strongest diffraction peak of ZnO in the standard XRD spectra (JCPDS no. 36-1451), which is a direct evidence for the existence of ZnO resulting from the thermal decomposition of Zn(OAc)2 at high temperature, in agreement with the results of TG.
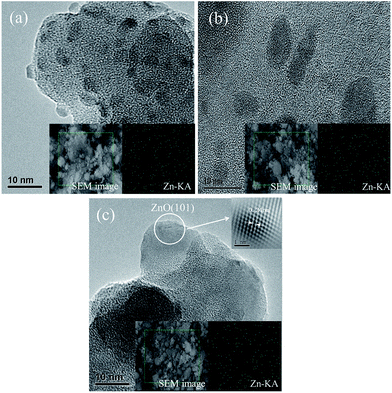 | ||
| Fig. 2 HRTEM images of (a) Zn/SiO2(60), (b) Zn/SiO2(300), and (c) Zn/SiO2(600). The insets are the corresponding SEM images and EDS elemental mapping of Zn. | ||
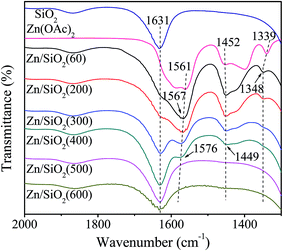
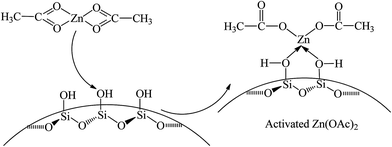
The infrared spectra of SiO2, Zn(OAc)2 and Zn/SiO2 catalysts prepared under different calcination temperature are presented in Fig. 3. For SiO2, the band at 1631 cm−1 is assigned to the bending vibration of O–H in the surface Si–OH. For Zn(OAc)2, the two bands at 1561 and 1452 cm−1 are attributed to the asymmetric and symmetric stretching vibration of COO−, respectively.32,38 The band located at 1339 cm−1 is assigned to the bending vibration of C–H in –CH3. For Zn/SiO2 catalysts, COO− vibration bands shift from 1561 and 1452 cm−1 for pure Zn(OAc)2 to higher wavenumber and low wavenumber, respectively, suggesting that the structure of anhydrous zinc acetate changes from bidentate complex to unidentate complex,32,33,38 which indicates the existence of the interaction between Zn(OAc)2 and SiO2. When Zn(OAc)2 is loaded on SiO2, the potential chelating O-donor of surface Si–OH can coordinate with the central Zn atom, which facilitates the transformation of the Zn(OAc)2 coordination mode from bidentate coordination to monodentate coordination, resulting in the activation of Zn(OAc)2 and the formation of Si–O–Zn bond (Scheme 2). In addition, when the calcination temperature increases to 400 °C, the intensity of COO− vibration bands at 1576 and 1449 cm−1 decreases and the C–H vibration band at 1348 cm−1 disappears completely due to the decomposition of Zn(OAc)2. When the calcination temperature is beyond 500 °C, the COO− vibration bands disappear, indicating the complete decomposition of Zn(OAc)2 to ZnO, which is consistent with the results of TG. It is worth noting that the COO− vibration band at 1567 cm−1 in Zn/SiO2(60) catalyst shifts to higher wavenumber with the increase of calcination temperature, which may be assigned to the different interaction between Zn(OAc)2 and SiO2. According to the results of TG, Zn(OAc)2 exists independently on catalyst with weak interaction with SiO2 under low calcination temperature. While the interaction becomes stronger owing to the formation of Si–O–Zn bond at higher calcination temperature, which leads to weak adjacent Zn–O bond and strong C![[double bond, length as m-dash]](https://www.rsc.org/images/entities/char_e001.gif) O bond. Therefore, the blue shift of COO− vibration band can be attributed to the stronger interaction between Zn(OAc)2 and SiO2.
O bond. Therefore, the blue shift of COO− vibration band can be attributed to the stronger interaction between Zn(OAc)2 and SiO2.
The SiO2, Zn(OAc)2 and Zn/SiO2 catalysts calcined at different temperature are characterized by XPS and the results are presented in Table 2. It can be seen that the binding energy of Zn 2p3/2 and Si 2p in the calcined catalysts are different from the pure SiO2 and Zn(OAc)2, which may be attributed to the formation of Si–O–Zn bond. When the surface Si–OH coordinates with the central Zn atom, the electrons transfer from Zn(OAc)2 to SiO2 due to the higher electronegativity of Si than that of Zn, which leads to higher binding energy of Zn 2p3/2 and lower binding energy of Si 2p. Moreover, Zn/SiO2(500) and Zn/SiO2(600) possess the similar Zn 2p3/2 binding energy as pure ZnO (1021.8 eV) owing to the complete decomposition of Zn(OAc)2 to ZnO at high temperature. It is worth noting that Zn/SiO2(300) possesses the highest binding energy of Zn 2p3/2 (1022.5 eV), indicating the highest tendency to draw electrons and the strongest capacity to coordinate with O-donor.26
| Catalyst | Zn 2p3/2 (eV) | Si 2p (eV) |
|---|---|---|
| SiO2 | — | 103.3 |
| Zn(OAc)2 | 1022.1 | — |
| Zn/SiO2(60) | 1022.1 | 103.3 |
| Zn/SiO2(200) | 1022.2 | 103.2 |
| Zn/SiO2(300) | 1022.5 | 103.2 |
| Zn/SiO2(400) | 1022.3 | 103.3 |
| Zn/SiO2(500) | 1022.0 | 103.4 |
| Zn/SiO2(600) | 1022.0 | 103.4 |
| ZnO | 1021.8 | — |
Catalytic activity testing
The Zn(OAc)2, ZnO, SiO2 and Zn/SiO2 catalysts calcined at different temperature were tested for the synthesis of HDC by methoxycarbonylation of HDA with DMC and the results are summarized in Table 3. The Zn(OAc)2 catalyst shows the best catalytic activity with 98.1% HDA conversion and 74.5% HDC yield, which is superior to the supported Zn(OAc)2 heterogeneous catalysts under the same reaction conditions, exhibiting the excellent catalytic activity of homogeneous catalyst. The activity of Zn/SiO2(T) catalysts decreases continuously with the increase of calcination temperature, reaching the minimum in Zn/SiO2(600) catalyst with 94.5% HDA conversion and 56.5% HDC yield. However, the yield of N,N′-HMC increases with the increase of calcination temperature, reaching the maximum of 24.4% at the same catalyst. Meanwhile, the conversion of HDA is similar for all Zn/SiO2(T) catalysts while the yield of HDC decreases significantly with the increase of calcination temperature. All above phenomenon can be ascribed to the formation of by-product N,N′-HMC, leading to the decrease of HDC yield. In addition, ZnO and SiO2 show poorly catalytic activity for the synthesis of HDC. It is worth noting that ZnO can greatly promote the methylation reaction, leading to the highest yield of N,N′-HMC. Moreover, the results of TON further validate the catalytic activity through the same change trend. The homogeneous Zn(OAc)2 catalyst shows the maximum of TON, in accordance with the best catalytic activity. The TON of heterogeneous Zn/SiO2(T) catalysts decreases continuously with the increase of calcination temperature, indicating the decrease of catalytic activity.| Catalyst | Zn content (wt%) | HDA conversion (%) | Yield (%) | TONb | ||
|---|---|---|---|---|---|---|
| HMC | HDC | N,N′-HMC | ||||
| a Reaction conditions: HDA 1.17 g, DMC 1.82 g, catalyst 0.37 g (Zn(OAc)2 and ZnO 0.2 mmol ), 80 °C, 6 h.b TON = mol HDC/mol Zn.32 | ||||||
| Zn(OAc)2 | — | 98.1 | 18.4 | 74.5 | 7.1 | 37.8 |
| Zn/SiO2(60) | 3.74 | 96.5 | 19.8 | 71.4 | 8.8 | 35.7 |
| Zn/SiO2(200) | 3.73 | 96.2 | 19.9 | 70.9 | 9.2 | 35.4 |
| Zn/SiO2(300) | 3.74 | 96.0 | 20.7 | 68.5 | 10.8 | 34.3 |
| Zn/SiO2(400) | 3.74 | 95.7 | 21.3 | 64.6 | 14.1 | 32.3 |
| Zn/SiO2(500) | 3.75 | 95.1 | 19.9 | 59.8 | 20.3 | 29.9 |
| Zn/SiO2(600) | 3.74 | 94.5 | 19.1 | 56.5 | 24.4 | 28.2 |
| ZnO | — | 83.4 | 13.5 | 49.6 | 36.9 | 24.8 |
| SiO2 | — | 91.6 | 34.4 | 43.2 | 22.4 | — |
In general, a large specific surface area is in favor of the exposure of active sites and thus leads to a higher catalytic activity. However, the catalytic activity of Zn/SiO2(T) decreases with the improvement of specific surface area, suggesting that the specific surface area is not the only factor affecting the catalytic activity. Moreover, for Zn/SiO2(T) catalysts, different calcination temperature may lead to different forms of the Zn species, which may be responsible for the decrease of catalytic activity.
According to the results of TG, FT-IR and HRTEM, it can be deduced that the decrease of catalytic activity can be ascribed to the decomposition of active component from Zn(OAc)2 to ZnO at high calcination temperature. Moreover, the results of catalytic activity testing indicate that ZnO shows less catalytic activity for the synthesis of HDC, in accordance with the previous researches.25,32 Therefore, the lower catalytic activity in Zn/SiO2(500) and Zn/SiO2(600) can be attributed to the complete thermal decomposition of Zn(OAc)2 to ZnO at high temperature.
In addition, the stability of Zn(OAc)2, ZnO, SiO2 and Zn/SiO2(T) catalysts were explored by recycle experiment and the results are shown in Table 4. Obvious deactivation can be found for homogeneous Zn(OAc)2 catalyst with decreased HDC yield from 74.5% to 51.6% in the recycle experiment due to the dissolution of active components and the formation of ZnO.32 Meanwhile, Zn/SiO2(60) catalyst also shows decreased HDC yield in the recycle experiment and the Zn content decreases from 3.74 wt% to 2.94 wt% after the first reaction, indicating that the leaching of active component leads to the decrease of catalytic activity in the recycle experiment. The same phenomenon is observed for Zn/SiO2(200) catalyst with lower Zn content of 3.02 wt% and HDC yield of 59.6% in the recycle experiment, deducing that the highly catalytic activity of the fresh Zn/SiO2(60) and Zn/SiO2(200) catalysts may attribute to the homogeneous Zn(OAc)2. Moreover, the sharp decrease of TON in the recycle experiment also indicates the deactivation of catalysts. The above conclusion can be further confirmed by the results of TG. When the calcination temperature is below 300 °C, Zn(OAc)2 with weak interaction with support is easily leached, resulting in poor stability and deactivation for Zn/SiO2(60) and Zn/SiO2(200) catalysts. However, Zn/SiO2(500) and Zn/SiO2(600) catalysts show better stability with slightly decreased Zn content and catalytic activity due to the stronger interaction between ZnO and SiO2.
| Catalyst | Zn content (wt%) | HDA conversion (%) | Yield (%) | TONb | ||
|---|---|---|---|---|---|---|
| HMC | HDC | N,N′-HMC | ||||
| a The used catalysts were washed with CH3OH and dried before recycle.b TON = mol HDC/mol Zn.32 | ||||||
| Zn(OAc)2 | — | 87.6 | 19.2 | 51.6 | 29.2 | 26.3 |
| Zn/SiO2(60) | 2.94 | 94.8 | 21.5 | 57.8 | 20.7 | 28.9 |
| Zn/SiO2(200) | 3.02 | 95.0 | 21.2 | 59.6 | 19.2 | 29.8 |
| Zn/SiO2(300) | 3.42 | 95.7 | 22.0 | 66.5 | 11.5 | 33.3 |
| Zn/SiO2(400) | 3.48 | 95.4 | 22.4 | 63.3 | 14.3 | 31.6 |
| Zn/SiO2(500) | 3.59 | 95.2 | 19.9 | 58.7 | 21.4 | 29.3 |
| Zn/SiO2(600) | 3.58 | 95.2 | 19.6 | 55.9 | 24.5 | 27.9 |
| ZnO | — | 82.7 | 13.1 | 47.7 | 39.2 | 23.8 |
| SiO2 | — | 91.2 | 33.8 | 44.3 | 21.9 | — |
It is worth noting that Zn/SiO2(300) catalyst exhibits the slightly decreased Zn content (approximately 0.32 wt%) and the best recyclability with 66.5% HDC yield under DMC to HDA molar ratio of 2![[thin space (1/6-em)]](https://www.rsc.org/images/entities/char_2009.gif) :
:![[thin space (1/6-em)]](https://www.rsc.org/images/entities/char_2009.gif) 1, which is much superior to other reported heterogeneous catalysts under the same reaction conditions.27,28 Meanwhile, the used Zn/SiO2(300) catalyst shows the maximum of TON, indicating that Zn/SiO2(300) is a high performance catalyst for the synthesis of HDC. The results of TG and FT-IR also indicate that Zn(OAc)2 in catalysts calcined beyond 300 °C has better stability owing to the interaction between Zn(OAc)2 and SiO2. However, the interacted Zn(OAc)2 begins to decompose at 340 °C, resulting in the decreased amount of Zn(OAc)2 and the lower HDC yield for Zn/SiO2(400) catalyst. In addition, the highest binding energy of Zn 2p3/2 in Zn/SiO2(300) catalyst suggests the highest tendency to draw electrons, which is benefit for the activation of DMC and thus promotes the further reaction between DMC and HDA.26 Therefore, Zn/SiO2(300) catalyst possesses the most amount of activated Zn(OAc)2 and the highest binding energy of Zn 2p3/2 that are responsible for the greatly catalytic activity. In addition, the excellent stability of Zn/SiO2(300) catalyst can be ascribed to the appropriate interaction between Zn(OAc)2 and SiO2.
1, which is much superior to other reported heterogeneous catalysts under the same reaction conditions.27,28 Meanwhile, the used Zn/SiO2(300) catalyst shows the maximum of TON, indicating that Zn/SiO2(300) is a high performance catalyst for the synthesis of HDC. The results of TG and FT-IR also indicate that Zn(OAc)2 in catalysts calcined beyond 300 °C has better stability owing to the interaction between Zn(OAc)2 and SiO2. However, the interacted Zn(OAc)2 begins to decompose at 340 °C, resulting in the decreased amount of Zn(OAc)2 and the lower HDC yield for Zn/SiO2(400) catalyst. In addition, the highest binding energy of Zn 2p3/2 in Zn/SiO2(300) catalyst suggests the highest tendency to draw electrons, which is benefit for the activation of DMC and thus promotes the further reaction between DMC and HDA.26 Therefore, Zn/SiO2(300) catalyst possesses the most amount of activated Zn(OAc)2 and the highest binding energy of Zn 2p3/2 that are responsible for the greatly catalytic activity. In addition, the excellent stability of Zn/SiO2(300) catalyst can be ascribed to the appropriate interaction between Zn(OAc)2 and SiO2.
Catalyst stability
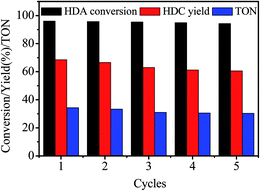
The stability of Zn/SiO2(300) catalyst was studied by conducting 5 runs for the synthesis of HDC by methoxycarbonylation of HDA with DMC. The used catalyst was washed thoroughly with CH3OH and dried under vacuum at 60 °C for 12 h before recycle. The results are shown in Fig. 4. It can be found that HDA conversion and HDC yield decrease slightly to 94.3% and 60.6% after 5 cycles, and the TON is almost the same at the last 3 runs, indicating the excellent stability of Zn/SiO2(300) catalyst.The fresh and used Zn/SiO2(300) catalyst were characterized by FT-IR (Fig. 5). Compared with the fresh catalyst (Fig. 5(a)), many new bands appear in the spectra of the used catalyst (Fig. 5(b)). The bands observed at 1698, 1569 and 1483 cm−1 are attributed to the main product HDC adsorbed on the surface of catalyst. Other bands, such as 1523 cm−1, may be assigned to the by-products (Fig. S2†). The intensity of HDC characteristic bands decrease after the used catalyst is washed by CH3OH (Fig. 5(c)), indicating the removal of HDC from the surface of catalyst. Furthermore, the difference between the spectra of the fresh catalyst (Fig. 5(a)) and the used catalyst washed by CH3OH (Fig. 5(c)) is the appearance of the band at 1523 cm−1, which can be explained by the coverage of insoluble by-products on the surface of the used catalyst. It is worth mentioning that the characteristic bands of activated Zn(OAc)2 at 1574 and 1449 cm−1 remain in the spectra of the used catalyst washed by CH3OH (Fig. 5(c)), indicating that activated Zn(OAc)2 are stable during the reaction owing to the strong interaction between Zn(OAc)2 and SiO2.
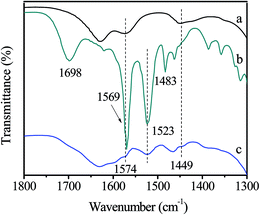 | ||
| Fig. 5 FT-IR spectra of (a) the fresh Zn/SiO2(300) catalyst, (b) the used Zn/SiO2(300) catalyst, (c) the used Zn/SiO2(300) catalyst washed by CH3OH. | ||
The fresh Zn/SiO2(300) catalyst and the used catalyst washed by CH3OH were characterized by ICP, BET and XPS, and the results are shown in Table 5. It can be seen that the Zn content of Zn/SiO2(300) catalyst decreases after 5 runs due to the dissolution of independent Zn(OAc)2 into the reaction system, leading to the loss of active component and the decrease of catalytic activity. This deduction can be further demonstrated by the UV-Vis absorption spectra of the product solution (Fig. S4†), confirming that the loss of Zn species is in the form of Zn(OAc)2. Compared with the fresh catalyst, considerable decreases in the specific surface area, pore volume and average pore diameter are observed for the used catalyst, indicating that the organic products may block the pores of catalyst, which results in the decreased amount of exposed active sites and a poor catalytic activity. Moreover, an obvious decrease of Zn 2p3/2 binding energy can be found after 5 cycles, decreasing from 1022.5 eV to 1021.7 eV with lower tendency to draw electrons, which indicates less ability for activation of DMC and decreased catalytic activity. The change may relate to the reaction between Zn(OAc)2 and by-product CH3OH to form ZnO with poor catalytic activity for the synthesis of HDC.39 However, no ZnO diffraction peaks appear in the XRD pattern of the used catalyst (Fig. S5†), indicating the unclear mechanism for the change.
| Catalyst | Zn content (wt%) | SBET (m2 g−1) | Pore volume (cm3 g−1) | Average pore diameter (nm) | Zn 2p3/2 (eV) |
|---|---|---|---|---|---|
| Fresh catalyst | 3.74 | 301.9 | 0.86 | 11.3 | 1022.5 |
| Used catalyst | 3.22 | 259.5 | 0.72 | 11.0 | 1021.7 |
Reaction mechanism
Based on the best performance of Zn/SiO2(300) catalyst for the synthesis of HDC by methoxycarbonylation of HDA with DMC, it is necessary to explore the interaction between catalyst and substrates by in situ FT-IR.Activation of DMC
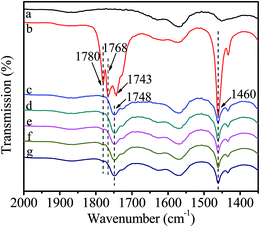
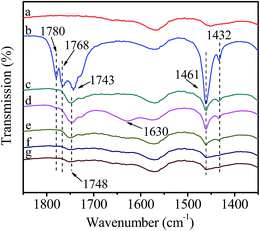
Fig. 6 shows the FT-IR spectra of catalyst interacting with DMC. After introduction of DMC, the bands ascribing to C![[double bond, length as m-dash]](https://www.rsc.org/images/entities/char_e001.gif) O stretching vibration in gaseous DMC are observed at 1780 and 1768 cm−1 owing to the conjugated structure between oxygen atom of ester group and carbonyl group.38 The band at 1743 cm−1 is attributed to C
O stretching vibration in gaseous DMC are observed at 1780 and 1768 cm−1 owing to the conjugated structure between oxygen atom of ester group and carbonyl group.38 The band at 1743 cm−1 is attributed to C![[double bond, length as m-dash]](https://www.rsc.org/images/entities/char_e001.gif) O stretching vibration of the adsorbed DMC.35 The band at 1460 cm−1 is assigned to C–H bending vibration of –CH3 in DMC.35 However, the gaseous DMC bands disappear after evacuation due to the removal of non-activated gaseous DMC. The new band at 1748 cm−1 is ascribed to C
O stretching vibration of the adsorbed DMC.35 The band at 1460 cm−1 is assigned to C–H bending vibration of –CH3 in DMC.35 However, the gaseous DMC bands disappear after evacuation due to the removal of non-activated gaseous DMC. The new band at 1748 cm−1 is ascribed to C![[double bond, length as m-dash]](https://www.rsc.org/images/entities/char_e001.gif) O stretching vibration of DMC coordinated to Zn atom (Scheme 3, active intermediate I), which experiences a red shift and the bands merging compared with the C
O stretching vibration of DMC coordinated to Zn atom (Scheme 3, active intermediate I), which experiences a red shift and the bands merging compared with the C![[double bond, length as m-dash]](https://www.rsc.org/images/entities/char_e001.gif) O stretching vibration of gaseous DMC. This can be explained by an inductive effect, originating from the coordination of electron-rich carbonyl oxygen in DMC with Zn atom, which makes the shared electron pair of C
O stretching vibration of gaseous DMC. This can be explained by an inductive effect, originating from the coordination of electron-rich carbonyl oxygen in DMC with Zn atom, which makes the shared electron pair of C![[double bond, length as m-dash]](https://www.rsc.org/images/entities/char_e001.gif) O moves to oxygen atom, resulting in the decrease of force constant and a red shift.30,38 Meanwhile, the conjugated structure is broken as a result of the coordination of carbonyl oxygen with Zn atom. The above changes are evidences for the activation of DMC by catalyst, which results in the formation of active intermediate I. No obvious changes are observed in the FT-IR spectra with further increasing temperature and time, indicating the stability of the active intermediate I. In conclusion, the activated Zn(OAc)2 on catalyst can facilitate the activation of DMC.
O moves to oxygen atom, resulting in the decrease of force constant and a red shift.30,38 Meanwhile, the conjugated structure is broken as a result of the coordination of carbonyl oxygen with Zn atom. The above changes are evidences for the activation of DMC by catalyst, which results in the formation of active intermediate I. No obvious changes are observed in the FT-IR spectra with further increasing temperature and time, indicating the stability of the active intermediate I. In conclusion, the activated Zn(OAc)2 on catalyst can facilitate the activation of DMC.
Activation of HDA
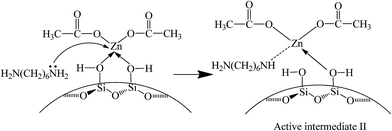
In this experiment, catalyst and HDA were grinded together and pressed to a Φ13 mm self-supporting pellet that was purified by evacuation at room temperature. The FT-IR spectra are shown in Fig. 7. The bands observed at 1574 cm−1 and 1475 cm−1 are assigned to the bending vibration of N–H and C–H in HDA. The band at 1314 cm−1 is attributed to the stretching vibration of C–N. With the increase of temperature to 80 °C, the bands at 1574 cm−1 and 1475 cm−1 shift to 1596 cm−1 and 1466 cm−1, respectively. Moreover, the intensity of all bands decreases gradually and the band at 1314 cm−1 disappears eventually. All above changes indicate the existence of interaction between catalyst and HDA, resulting in the formation of active intermediate II (Scheme 4). According to previous report, when nitrogen atom in HDA coordinates with Zn atom, the electron-withdrawing effect of Zn seems to restrict the hydrogen abstraction of amino group in the other end of HDA,40 leading to the blue shift of N–H bending vibration band. In addition, the inductive effect also results in the weak interaction of adjacent C–H bond, leading to the red shift of C–H bending vibration band. Although the activated Zn(OAc)2 in catalyst can interact with HDA, it may be unfavorable for further substitution reaction owing to the restriction of hydrogen abstraction in another amino group.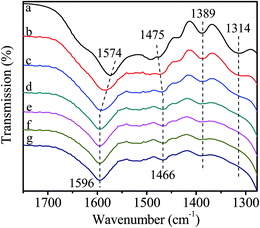 | ||
| Fig. 7 FT-IR spectra of catalyst interacting with HDA. (a) purified catalyst; (b) heat to 40 °C; (c) 60 °C; (d) 80 °C; (e) stay at 80 °C for 30 min; (f) 60 min; (g) 90 min. | ||
Reactivity of HDA followed by DMC
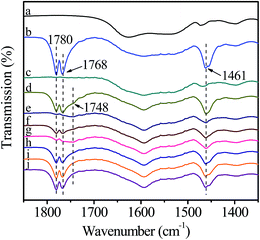
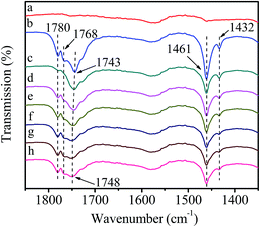
In this test, catalyst was grinded with HDA to prepare a self-supporting pellet that was purified by evacuation at room temperature (Fig. 8(a)). After introduction of DMC, the bands corresponding to C–H bending vibration at 1461 cm−1, C![[double bond, length as m-dash]](https://www.rsc.org/images/entities/char_e001.gif) O stretching vibration at 1780 and 1768 cm−1 are clearly visible (Fig. 8(b)). However, these bands disappear after removing the non-activated gaseous DMC (Fig. 8(c)). Compared with the activation of DMC on pure catalyst (Fig. 6(c)), it can be deduced that DMC can not interact with the mixed catalyst due to the occupation of active sites by HDA. In order to further explore the reaction mechanism, the mixed catalyst was evacuated at 80 °C for 1 h, which both purified the surface of catalyst and promoted the reaction between HDA and catalyst to form active intermediate II, followed by the introduction of DMC at room temperature (Fig. 8(d)). Compared with Fig. 8(b), a new weak shoulder at 1748 cm−1 ascribed to activated DMC is remained after removal of non-activated gaseous DMC (Fig. 8(e)), indicating the existence of interaction between DMC and catalyst. However, after heating to 40 °C (Fig. 8(f)), the bands attributed to gaseous DMC at 1780 and 1768 cm−1 appear and the intensity of band ascribed to activated DMC at 1748 cm−1 decreases, indicating the desorption of activated DMC. Thus, DMC can not stably react with the active intermediate II. The further experiment was conducted by introducing DMC at 80 °C and then removing non-activated gaseous DMC at room temperature (Fig. 8(g)). It can be seen that the band assigned to activated DMC at 1748 cm−1 appears and the intensity is obviously stronger than the counterpart in Fig. 8(e), indicating that the activation of DMC can be greatly facilitated under high temperature. Nevertheless, the desorption of activated DMC is observed, followed by the increased intensity of gaseous DMC bands as well as the diminishment of activated DMC band with the increase of temperature (Fig. 8(h–j)). All above changes suggest that DMC can not react with the catalyst pre-interacted with HDA. This phenomenon can be explained as follows: the methoxycarbonylation of HDA by DMC is carried out only when the basicity of attacking amine is significantly higher than that of leaving methoxy group.25,26 Although HDA, as a potential chelating N-donor species, can coordinate with Zn atom to form active intermediate II, the basicity of activated HDA is lower than that of pure HDA, resulting in more difficulty for the further reaction.
O stretching vibration at 1780 and 1768 cm−1 are clearly visible (Fig. 8(b)). However, these bands disappear after removing the non-activated gaseous DMC (Fig. 8(c)). Compared with the activation of DMC on pure catalyst (Fig. 6(c)), it can be deduced that DMC can not interact with the mixed catalyst due to the occupation of active sites by HDA. In order to further explore the reaction mechanism, the mixed catalyst was evacuated at 80 °C for 1 h, which both purified the surface of catalyst and promoted the reaction between HDA and catalyst to form active intermediate II, followed by the introduction of DMC at room temperature (Fig. 8(d)). Compared with Fig. 8(b), a new weak shoulder at 1748 cm−1 ascribed to activated DMC is remained after removal of non-activated gaseous DMC (Fig. 8(e)), indicating the existence of interaction between DMC and catalyst. However, after heating to 40 °C (Fig. 8(f)), the bands attributed to gaseous DMC at 1780 and 1768 cm−1 appear and the intensity of band ascribed to activated DMC at 1748 cm−1 decreases, indicating the desorption of activated DMC. Thus, DMC can not stably react with the active intermediate II. The further experiment was conducted by introducing DMC at 80 °C and then removing non-activated gaseous DMC at room temperature (Fig. 8(g)). It can be seen that the band assigned to activated DMC at 1748 cm−1 appears and the intensity is obviously stronger than the counterpart in Fig. 8(e), indicating that the activation of DMC can be greatly facilitated under high temperature. Nevertheless, the desorption of activated DMC is observed, followed by the increased intensity of gaseous DMC bands as well as the diminishment of activated DMC band with the increase of temperature (Fig. 8(h–j)). All above changes suggest that DMC can not react with the catalyst pre-interacted with HDA. This phenomenon can be explained as follows: the methoxycarbonylation of HDA by DMC is carried out only when the basicity of attacking amine is significantly higher than that of leaving methoxy group.25,26 Although HDA, as a potential chelating N-donor species, can coordinate with Zn atom to form active intermediate II, the basicity of activated HDA is lower than that of pure HDA, resulting in more difficulty for the further reaction.
Reactivity of DMC followed by HDA
Fig. 9 shows the FT-IR spectra of catalyst reacting with DMC followed by interaction with HDA. It can be seen that the evolution of spectra in introduction and removal of gaseous DMC (Fig. 9(a–c)) are the same as Fig. 6(a–c), indicating the activation of DMC. The band at 1630 cm−1 assigned to HDA appears in Fig. 9(d), indicating the introduction of HDA. It is worth noting that the intensity of HDA band at 1630 cm−1 and activated DMC bands at 1748, 1461 and 1432 cm−1 decreases sharply after introduction of HDA (Fig. 9(e)). Moreover, further increasing temperature to 80 °C (Fig. 9(f)) and maintaining for 30 min (Fig. 9(g)), the intensity of all above bands decreases continuously and the bands at 1461 and 1432 cm−1 merge into a broad band, indicating that HDA participates in the reaction with activated DMC. This deduction is based on following considerations: for one hand, Zn/SiO2(300) as a heterogeneous catalyst possesses great steric hindrance for dispersion and activation of macromolecular HDA, while not for DMC;32 for another hand, transition metal ions possess higher oxophilicity in presence of both N-donor and O-donor species,25 suggesting that the coordination of electron-rich carbonyl oxygen in DMC with Zn atom is easy and stable than that of HDA. In summary, the methoxycarbonylation of HDA by DMC is conducted through the formation of stable active intermediate I between DMC and catalyst followed by the activation of HDA to produce HDC.Reactivity of HDA and DMC
In order to better approach the practical reaction, further experiment was performed by introducing HDA and DMC simultaneously (Fig. 10). The bands ascribed to DMC at 1780, 1768, 1461 and 1432 cm−1 appear in the FT-IR spectra owing to the higher saturated vapor pressure of DMC than that of HDA (Fig. 10(b)). It is worth noting that the band at 1748 cm−1 attributed to activated DMC is observed after removing non-activated HDA and DMC (Fig. 10(c)), confirming the formation of active intermediate I between DMC and catalyst. With the increase of temperature and time, the intensity of activated DMC bands decreases constantly, in accordance with Fig. 9, revealing that the reaction is through active intermediate I to produce HDC.Possible reaction mechanism for the methoxycarbonylation of HDA by DMC over Zn/SiO2(300) catalyst
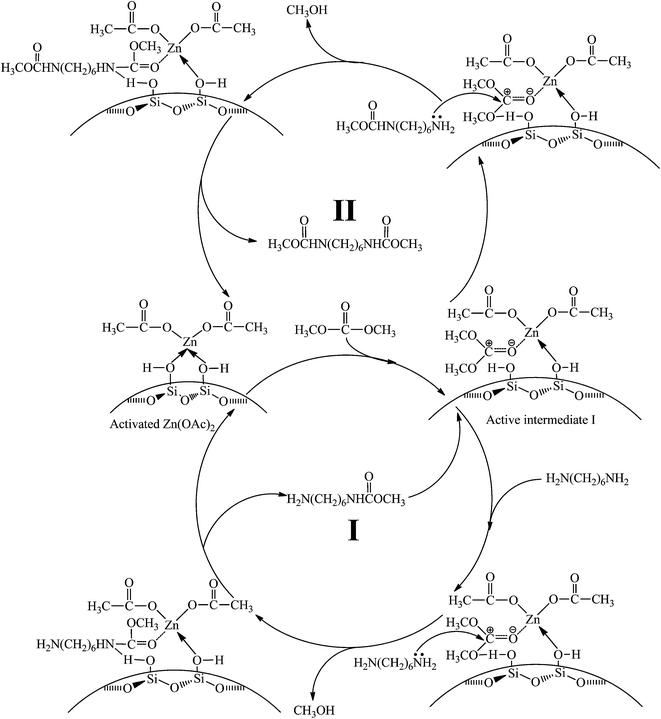
In summary, all above experiments confirm that the reaction mechanism for the synthesis of HDC is a typical nucleophilic addition–elimination reaction and specific reaction process can be depicted as follows: a stable active intermediate I is formed by coordination of electron-rich carbonyl oxygen in DMC with Zn atom, followed by nucleophilic attack of amino nitrogen in HDA on activated carbonyl carbon to produce HDC. The whole catalytic cycle is illustrated in Scheme 5.Conclusion
In this work, the heterogeneous Zn/SiO2(300) catalyst exhibits excellent catalytic performance for the non-phosgene synthesis of HDC from DMC and HDA with 96.0% HDA conversion and 68.5% HDC yield under stoichiometric DMC to HDA molar ratio of 2![[thin space (1/6-em)]](https://www.rsc.org/images/entities/char_2009.gif) :
:![[thin space (1/6-em)]](https://www.rsc.org/images/entities/char_2009.gif) 1. Furthermore, Zn/SiO2(300) catalyst has excellent stability with slightly decreased HDC yield after 5 recycles.
1. Furthermore, Zn/SiO2(300) catalyst has excellent stability with slightly decreased HDC yield after 5 recycles.
The Zn(OAc)2 can stably exist in Zn/SiO2(300) catalyst mainly because the coordination mode of Zn(OAc)2 transforms from bidentate coordination to monodentate coordination facilitated by Si–OH, leading to the formation of Si–O–Zn bond and the activation of Zn(OAc)2. The activated Zn(OAc)2 can effectively interact with DMC and promote the following reaction. The formation of less active ZnO on the catalysts calcined at higher temperatures (500, 600 °C) might be responsible for the lower catalytic activity. In addition, the leakage of Zn(OAc)2 limits the reusability of the catalysts calcined at lower temperatures (60, 200 °C).
The formation of HDC may involve the coordination of electron-rich carbonyl oxygen in DMC with Zn atom to form the stable active intermediate, followed by nucleophilic attack of HDA to synthesize HDC through a typical nucleophilic addition–elimination reaction.
Acknowledgements
This work is financially supported by the Natural Science Foundation of China (21343012) and the Key Science and Technology Program of Shanxi Province, China (MD2014-10).References
- O. Kreye, H. Mutlu and M. A. R. Meier, Green Chem., 2013, 15, 1431–1455 RSC.
- E. Delebecq, J. P. Pascault, B. Boutevin and F. Ganachaud, Chem. Rev., 2013, 113, 80–118 CrossRef CAS PubMed.
- Y. Toyokazu, I. Teruo, O. Kenji, T. Yasutaka and K. Hidetaka, EP 0323514, July 13 1994.
- T. Baba, M. Fujiwara, A. Oosaku, A. Kobayashi, R. G. Deleon and Y. Ono, Appl. Catal., A, 2002, 227, 1–6 CrossRef CAS.
- V. L. K. Valli and H. Alper, J. Org. Chem., 1995, 60, 257–258 CrossRef CAS.
- A. M. Tafesh and J. Weiguny, Chem. Rev., 1996, 96, 2035–2052 CrossRef CAS PubMed.
- P. Y. Chong, S. Z. Janicki and P. A. Petillo, J. Org. Chem., 1998, 63, 8515–8521 CrossRef CAS.
- M. Aresta, A. Dibenedetto and E. Quaranta, Green Chem., 1999, 1, 237–242 RSC.
- S. Braverman, M. Cherkinsky, L. Kedrova and A. Reiselman, Tetrahedron Lett., 1999, 40, 3235–3238 CrossRef CAS.
- S. Gastaldi, S. M. Weinreb and D. Stien, J. Org. Chem., 2000, 65, 3239–3240 CrossRef CAS PubMed.
- M. Selva, P. Tundo and A. Perosa, Tetrahedron Lett., 2002, 43, 1217–1219 CrossRef CAS.
- D. L. Sun, J. Y. Luo, R. Y. Wen, J. R. Deng and Z. S. Chao, J. Hazard. Mater., 2014, 266, 167–173 CrossRef CAS PubMed.
- X. T. Li, H. Q. Li, H. T. Liu and G. Y. Zhu, J. Hazard. Mater., 2011, 198, 376–380 CrossRef CAS PubMed.
- P. Tundo and M. Selva, Acc. Chem. Res., 2002, 35, 706–716 CrossRef CAS PubMed.
- D. Chaturvedi, Tetrahedron, 2012, 68, 15–45 CrossRef CAS.
- R. G. Deleon, A. Kobayashi, T. Yamauchi, J. Ooishi, T. Baba, M. Sasaki and F. Hiarata, Appl. Catal., A, 2002, 225, 43–49 CrossRef.
- A. A. G. Shaikh and S. Sivaram, Chem. Rev., 1996, 96, 951–976 CrossRef CAS PubMed.
- Y. Ono, Appl. Catal., A, 1997, 155, 133–166 CrossRef CAS.
- T. Wei, M. Wang, W. Wei, Y. Sun and B. Zhong, Green Chem., 2003, 5, 343–346 RSC.
- D. L. Sun, S. J. Xie, J. R. Deng, C. J. Huang, E. Ruckenstein and Z. S. Chao, Green Chem., 2010, 12, 483–490 RSC.
- M. Distaso and E. Quaranta, Appl. Catal., B, 2006, 66, 72–80 CrossRef CAS.
- P. Tundo, L. Rossi and A. Loris, J. Org. Chem., 2005, 70, 2219–2224 CrossRef CAS PubMed.
- C. Duval, N. Kébir, A. Charvet, A. Martin and F. Burel, J. Polym. Sci., Part A: Polym. Chem., 2015, 53, 1351–1359 CrossRef CAS.
- H. C. Zhou, F. Shi, X. Tian, Q. H. Zhang and Y. Q. Deng, J. Mol. Catal. A: Chem., 2007, 271, 89–92 CrossRef CAS.
- H. Q. Li, Y. Cao, X. T. Li, L. G. Wang, F. J. Li and G. Y. Zhu, Ind. Eng. Chem. Res., 2014, 53, 626–634 CrossRef CAS.
- D. L. Sun, J. R. Deng and Z. S. Chao, Chem. Cent. J., 2007, 1 DOI:10.1186/1752-153x-1-27.
- F. Li, Y. J. Wang, W. Xue and X. Q. Zhao, J. Chem. Technol. Biotechnol., 2007, 82, 209–213 CrossRef CAS.
- F. Li, Y. J. Wang and X. Q. Zhao, Petrochem. Technol., 2004, 33, 1695–1697 Search PubMed.
- T. Baba, A. Kobayashi, T. Yamauchi, H. Tanaka, S. Aso, M. Inomata and Y. Kawanami, Catal. Lett., 2002, 82, 193–197 CrossRef CAS.
- T. Baba, A. Kobayashi, Y. Kawanami, K. Inazu, A. Ishikawa, T. Echizenn, K. Murai, S. Aso and M. Inomata, Green Chem., 2005, 7, 159–165 RSC.
- E. Reixach, N. Bonet, F. X. Rius-Ruiz, S. Wershofen and A. Vidal-Ferran, Ind. Eng. Chem. Res., 2010, 49, 6362–6366 CrossRef CAS.
- F. Li, W. Li, J. Li, W. Xue, Y. Wang and X. Zhao, Appl. Catal., A, 2014, 475, 355–362 CrossRef CAS.
- F. Xiao, D. S. Zhang, Q. N. Dong, W. Wei and Y. H. Sun, React. Kinet. Catal. Lett., 2006, 89, 131–138 CrossRef CAS.
- J. P. Shang, X. G. Guo, F. Shi, Y. B. Ma, F. Zhou and Y. Q. Deng, J. Catal., 2011, 279, 328–336 CrossRef CAS.
- T. Beutel, J. Chem. Soc., Faraday Trans., 1998, 94, 985–993 RSC.
- X. Wu, M. Kang, Y. Yin, F. Wang, N. Zhao, F. Xiao, W. Wei and Y. Sun, Appl. Catal., A, 2014, 473, 13–20 CrossRef CAS.
- X. Wu, M. Kang, N. Zhao, W. Wei and Y. Sun, Catal. Commun., 2014, 46, 46–50 CrossRef CAS.
- D. Ma, G. R. Wang, Y. J. Wang and X. Q. Zhao, Spectrosc. Spectral Anal., 2009, 29, 331–335 CAS.
- P. Tonto, O. Mekasuwandumrong, S. Phatanasri, V. Pavarajarn and P. Praserthdam, Ceram. Int., 2008, 34, 57–62 CrossRef CAS.
- D. W. Kim, E. S. Huh, S. D. Park, L. V. Nguyen, M. D. Nguyen, H. S. Kim, M. Cheong and D. Q. Nguyen, Adv. Synth. Catal., 2010, 352, 440–446 CrossRef CAS.
Footnote |
| † Electronic supplementary information (ESI) available. See DOI: 10.1039/c6ra08492c |
| This journal is © The Royal Society of Chemistry 2016 |

