Facile synthesis of Mn-doped hollow Fe2O3 nanospheres coated with polypyrrole as anodes for high-performance lithium-ion batteries
Guangda Li*,
Rumeng Han,
Xiaoyun Xu and
Manman Ren
Key Laboratory of Processing and Testing Technology of Glass & Functional Ceramics of Shandong Province, School of Material Science and Engineering, Qilu University of Technology, Jinan, 250353, China. E-mail: ligd@qlu.edu.cn
First published on 12th May 2016
Abstract
Mn-doped Fe2O3/PPy hollow composite nanospheres were fabricated by a facile solvothermal method. The Mn–Fe2O3/PPy electrode showed an improved electrochemical performance in terms of high rate capability and long cycling performance compared with Fe2O3 without Mn doping and PPy coating. At current densities of 500 mA g−1 and 1000 mA g−1, the Mn–Fe2O3/PPy exhibited an initial capacity of 1214.7 and 924.9 mA h g−1, and the capacity was maintained at 795.7 and 643.6 mA h g−1 after 200 cycles.
1. Introduction
With increasing demand for next generation portable electronic devices and electric vehicles, the development of lithium-ion batteries (LIBs) with high capacity, excellent cycling performance, and superior rate capability is gradually becoming a crucial question.1–3 Among various promising materials, transition metal oxides, such as SnO2, Fe2O3, TiO2 and Co3O4, have been widely studied as anode materials for LIBs.4–9 Among them, Fe2O3 has been attracting more and more attention owing to its high theoretical capacity (1074 mA h g−1), low cost, high safety and environmental friendliness.10–12 However, Fe2O3 used as an electrode for LIBs usually suffers from poor cycling performance and bad rate capability caused by its low electrical conductivity and large volume change (>200%) during the insertion/extraction and pulverization process.13,14 To overcome these drawbacks, extensive research has been focused on alleviating various nanostructures and/or improving the electronic conductivity by using graphite coating.One effective way is to fabricate hollow nanostructure Fe2O3.15–19 Hollow nanostructures with high surface area and high specific capacity have attracted much attention because hollow anode materials can supply more Li+ ion sites, alleviate the volume expansion and shorten the diffusion length for Li+ ion intercalation. Lou et al. have demonstrated that hollow structure can improve contact between electrolyte and active materials, superior electrochemical kinetics and remarkable structural stability in their previous works. Although some nanostructure anodes showed relative high capacities, the electronic conductivity of the Fe2O3 materials are not improved obviously, which could result in poor cycling performance and rate capability during long discharge/charge cycles.
Furthermore, the surface coating of inorganic nanoparticles by conducting polymers have been extensively studied and applications.20,21 Polypyrrole (PPy) is a conductivity polymer with ion-penetrating ability, excellent mechanical properties and high electrochemical performance. Coating of PPy has also been successfully applied in the property enhancement of LIBs, such as MnO2/PPy, SnO2/PPy and Fe2O3/PPy.22–24
Recently, a number of studies have shown that the electronic conductivity and cycling performance of metal oxide materials (NiO, SnO2, TiO2, ZnO, Fe2O3 and ZnFe2O4) can be significantly enhanced by doping other elements (Co, Cu, Ni, Fe, Mn, and Zn).12,25–32 Doping other metal ions in crystal structure can cause a change in the unite cell volume, thus leading to Li+ diffusion easier. Furthermore, doping other metal ions may act as a buffer to alleviate the stress which caused by the volume change during discharge/charge process. For example, Liu et al. reported Mn-doped Fe2O3 hollow porous prisms exhibit an improved electrochemical performance compared with pristine Fe2O3.17 Thi et al. also introduced Co-doped NiO by a facile solvothermal method. It was found that the conductivity of NiO is largely improve through Co2+ doping and the Co-doped NiO anode revealed greatly enhanced rate capability and excellent cycling performance.12
In this work, we proposed that hollow Mn-doped Fe2O3 (Mn–Fe2O3) nanospheres to improving the performance of LIBs. First, the similar ion radii of Mn2+ (0.067 nm) and Fe3+ (0.055 nm) would make it possible to doped Fe2O3 by Mn without causing much lattice strain. Second, the radius of Mn2+ is larger than Fe3+, so the replacement of Fe3+ by Mn2+ in crystal structure can cause an increase in the unite cell volume, thus making Li+ ion diffusion easier. This also means the intrinsic conductivity of Mn–Fe2O3 can be improved.31 Furthermore, in order to further improve the conductivity and stability of Mn–Fe2O3, conductive and soft polymers of polypyrrole (PPy) are constructed uniform hybrid structure of Mn–Fe2O3/PPy. In this way, the hybrid structure of Mn–Fe2O3/PPy, in which Mn–Fe2O3 nanospheres are evenly embedded in the PPy matrix, is believed as a significantly innovation for developing novel electrode materials with improved electrochemical performance.
2. Experimental section
2.1 Preparation of Mn-doped Fe2O3
In a typical experimental procedure, 2 mmol FeCl3·6H2O and 4 mmol Mn(CH3COO)2·4H2O were dissolved in 30 ml ethylene glycol under vigorous stirring. Then, 0.5 g NH4AC was added into the above solution. The mixture solution was stirred for 30 min to obtain a homogeneous solution and transferred into a 40 ml Teflon-lined stainless-steel autoclave. The autoclave was sealed and heated at 180 °C for 30 h in an electronic oven. After cooling naturally, the precipitates were collected and washed with absolute ethanol and deionized water for several times, and dried at 80 °C for 5 h in vacuum oven. This precursor was heated in a furnace at 500 °C for 3 h in atmosphere. At last, the hollow Mn-doped Fe2O3 nanospheres could be obtained. For the synthesis of hollow Fe2O3 without Mn doped, the process was carried out in a similar way to prepared Mn-doped Fe2O3 except no Mn(CH3COO)2·4H2O added in system.2.2 Preparation of Mn–Fe2O3/PPy
The as-prepared Mn–Fe2O3 nanospheres (20 mg) were dispersed in deionized water (100 ml) by ultrasonication for 30 min. Then the pyrrole (50 μl) was added in the solution. After the solution was stirred for 1 h, (NH4)2S2O8 (0.1 M, 10 ml) solution was added in droplets and the stirring continued for 4 h. The resulting Mn–Fe2O3/PPy was collected by filtration and washed with deionized water and ethanol.2.3 Material characterization
The X-ray power diffraction (XRD) analysis was performed on a Bruker D8 advanced X-ray diffractometer equipped with graphite-monochromatized CuKα radiation (λ = 1.5418 Å). The morphologies of the products were observed through scanning electron microscopy (SEM) and transmission electron microscope (TEM) measurements, which were carried out on a JEOL JSM-7600F field emission instrument and a JEM 1011 TEM, respectively. High-resolution transmission electron microscope (HRTEM) images were carried out on a JEOL 2100 transmission electron microscope with an accelerating voltage of 200 KV. The chemical composition of the samples was analyzed by X-ray photoelectron instruments (XPS, VGESCALABMK X-ray spectrometer). The ICP was carried out on Optima 2000DV. Brunauer–Emmett–Teller (BET) test was performed on surface area and porosity analyzer (Micromeritics, ASAP 2020).2.4 Electrochemical measurements
The working electrodes were prepared by pasting mixed slurry that consisted of 70 wt% active materials (Mn–Fe2O3/PPy), 10 wt% sodium carboxy methyl cellulose (CMC), and 20 wt% carbon black onto a copper foil. The fabricated working electrodes dried in vacuum oven at 100 °C for 24 h. Celgard 2400 microporous polypropylene membrane was used as separator. The electrolyte consisted of a solution of 1 M LiPF6 in an ethylene carbonate/dimethyl carbonate/diethyl carbonate (EC/DMC/DEC, 1![[thin space (1/6-em)]](https://www.rsc.org/images/entities/char_2009.gif) :
:![[thin space (1/6-em)]](https://www.rsc.org/images/entities/char_2009.gif) 1
1![[thin space (1/6-em)]](https://www.rsc.org/images/entities/char_2009.gif) :
:![[thin space (1/6-em)]](https://www.rsc.org/images/entities/char_2009.gif) 1 w/w). Lithium foils were used as counter electrodes. The batteries were assembled in an argon-filled glove box and cycled at different current density between voltage limits of 0.01 and 3.0 V. Cyclic voltammetry (CV) profiles (0.01–3.0 V, 0.1 mV S−1) were carried out on an electrochemical workstation (CHI 760E, China). The discharge/charge tests of the samples were carried out on a Land battery test system (CT2001A).
1 w/w). Lithium foils were used as counter electrodes. The batteries were assembled in an argon-filled glove box and cycled at different current density between voltage limits of 0.01 and 3.0 V. Cyclic voltammetry (CV) profiles (0.01–3.0 V, 0.1 mV S−1) were carried out on an electrochemical workstation (CHI 760E, China). The discharge/charge tests of the samples were carried out on a Land battery test system (CT2001A).
3. Results and discussion
Fig. 1 shows the XRD patterns of Fe2O3, Mn–Fe2O3 and Mn–Fe2O3/PPy, respectively. XRD pattern of both the undoped and Mn-doped samples could be indexed by the standard reflection data of α-Fe2O3 (JCPDS no. 33-0664). Therein, the magnified (104) and (110) face reflection peaks of the Mn-doped Fe2O3 indicate that there is a slight shift to the left. This suggests that element Mn is highly dispersed in the matrix of crystalline α-Fe2O3, and this phenomenon also coincides with Bragg equation. The Fe/Mn element ratio is determined by the ICP method, giving a chemical formula of Fe1.8Mn0.2O3 for the obtained Mn-doped Fe2O3 samples.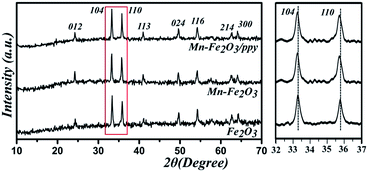 | ||
| Fig. 1 XRD pattern of Fe2O3, Mn–Fe2O3 and Mn–Fe2O3/PPy samples, and the diffraction peak range from 32 to 37° for each pattern was magnified and indexed to (104) and (110) reflection. | ||
XPS spectra are presented in Fig. 2. The survey spectrum (Fig. 2a) shows that the presence of Fe, Mn, O and C from the reference. The spectrum of Fe2p (Fig. 2b) shows two obviously peaks of Fe2p3/2 at 710.1 eV and Fe2p1/2 at 724.4 eV, and the separation of the 2p doublet is ∼14.0 eV.33 Furthermore, there are two shake-up satellites at binding energies of 717.6 and 732.6 eV, which are also clearly observed.20 All of these features can be ascribed to Fe2O3. By using a Gaussian fitting method, the Fe2p spectrum is best fitted to two spin–orbit doublets characteristic of Fe3+ and Fe2+, which suggests that the presence of slight Fe2+.34,35 This phenomenon may be caused by defects of the Fe2O3 crystal surface. The peaks at 641.8 and 652.7 eV can be attributed to Mn2p3/2 and Mn2p1/2, respectively (Fig. 2c).36 The high-resolution spectrum of O1s (Fig. 2d) can be fitted into three oxygen contributions. The peak at 532.2 eV corresponds to O2− in Fe2O3. The peak at 529.6 eV is attributed to defects and contaminates a number of surface species including hydroxyls, chemisorbed oxygen and water on the surface of Fe2O3.12 The peak at 531.1 eV can be assigned to the coordination of oxygen in Mn–O. Based on the results of XPS, it could be inferred that Mn ions were successfully incorporated into Fe2O3.
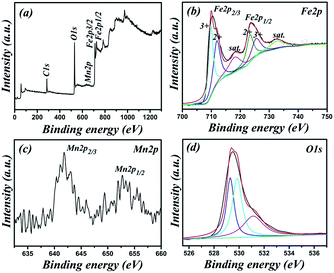 | ||
| Fig. 2 XPS spectra of the hollow Mn–Fe2O3 nanospheres: (a) survey spectrum; (b) Fe2p; (c) Mn2p; (d) O1s. | ||
Fig. 3 shows the SEM and TEM images of the hollow Mn–Fe2O3 nanospheres in order to observing the morphologies and nanostructures. From Fig. 3a–d, it is indicated that the synthesized Mn–Fe2O3 display a smooth surface with a highly uniform morphology with an average size of about 300–600 nm. The high resolution SEM image as shown in Fig. 3c and d clearly presents the open tip, implying a hollow structure. Fig. 3e shows a typical TEM image of Mn–Fe2O3, and the obvious contrast between the centers and shells of the spherical particles demonstrates a hollow structure obtained. The thickness of the shell is about 50 nm. HRTEM image (Fig. 3f) clearly shows distinct lattice fringes with d spacing of 0.25 nm, corresponding to the (110) lattice planes of Fe2O3. The EDS (Fig. 3f) reveals the co-existence of Fe, O and Mn in the structure, further indicating the successful synthesis of Mn–Fe2O3. The mapping images display the uniform distribution of all elements (Fe, O and Mn), indicating Mn are highly dispersed in the Fe2O3 structure.
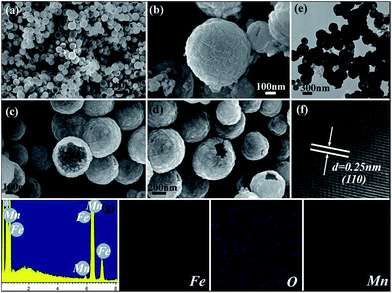 | ||
| Fig. 3 (a–d) Typical SEM images of the Mn–Fe2O3 hollow nanospheres; (e and f) TEM and HRTEM images of the Mn–Fe2O3; (g) EDS and element mapping of the Mn–Fe2O3. | ||
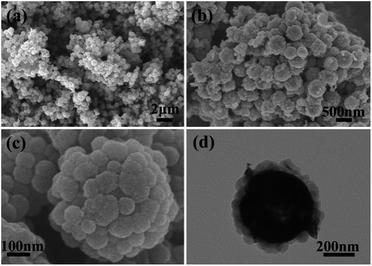
Fig. 4a and b shows typical SEM and TEM image of Mn–Fe2O3/PPy. These composite nanospheres exhibited rough outer surface comparing with Mn–Fe2O3, which is believed to be the PPy layers coated on the surface of Fe2O3. The clearly PPy layers on the surface of Fe2O3 can be clearly observed from Fig. 4c and d. As shown in Fig. 4c, the PPy nanoparticles compactly growth on the surface of Fe2O3 formed PPy layers. The size of PPy particles is about 30–50 nm. From Fig. 4d, it can be seen that the thickness of PPy layers is about 50 nm. The conductivity polymer of PPy growth on the surface of Mn–Fe2O3 can significantly improve the electronic conductivity and alleviate the volume change during the discharge/charge cycles. These favorable factors can result in superior cycling performance and rate capability.
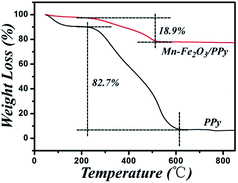
Typical TGA curves of the Mn–Fe2O3/PPy and PPy under N2 atmosphere are shown in Fig. 5. As shown in the TGA curve of Mn–Fe2O3/PPy, the first weight loss, occurring below 220 °C, is attributed to a little loss of water absorbed on the surface of samples.37 This weigh loss temperature is also clearly observed from PPy curve. From the 220 to 500 °C, the observed weight loss is due to the combustion of PPy.38 According to this TGA curve, the weight percentage of PPy in composites is about 18.7%.
Fig. 6 shows the specific surface areas for Mn–Fe2O3 and Mn–Fe2O3/PPy, which are 12.22 and 14.52 m2 g−1, respectively. The insets in Fig. 6 are the corresponding pore size distributions estimated using the BJH method, giving pore diameters with values of 9.87 and 7.09 nm for Mn–Fe2O3 and Mn–Fe2O3/PPy. PPy coating on the surface of Mn–Fe2O3 resulted in the specific surface area increasing, indicating more Li+ insertion/extraction sites during cycles.
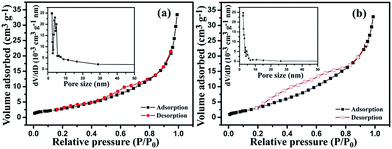 | ||
| Fig. 6 N2 adsorption/desorption isotherms and the corresponding pore size distribution (inset) of (a) Mn–Fe2O3 and (b) Mn–Fe2O3/PPy. | ||
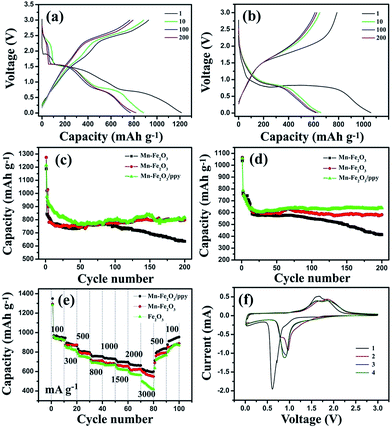
The discharge/charge curves of the Mn–Fe2O3/PPy nanospheres for the different cycles at current densities of 500 and 1000 mA g−1 are shown in Fig. 7a and b. The initial discharge and charge capacities of Mn–Fe2O3/PPy are 1214.7 and 924.9 mA h g−1, corresponding to 76.1% of the first coulombic efficiency at current density of 500 mA g−1. The irreversible capacity loss in the first discharge/charge process can be attributed to the decomposition of electrolyte and the formation of SEI on the surface of electrode, which is commonly observed in metal oxide anode materials. At a current density of 1000 mA g−1, the Mn–Fe2O3/PPy exhibits an initial discharge capacity of 1061.8 mA h g−1 and a charge capacity of 787.0 mA h g−1 leading to a coulombic efficiency of 74.1%.
The cycling performance of Fe2O3, Mn–Fe2O3 and Mn–Fe2O3/PPy are presented in Fig. 7c and d. A high capacity as high as 801.6 mA h g−1 is sill maintained even after 200 cycles at 500 mA h g−1 of Mn–Fe2O3/PPy, which suggest an excellent cycling stability. For the purpose of comparison, the electrochemical properties of pristine Fe2O3 and Mn–Fe2O3 nanospheres are also examined. The Mn–Fe2O3 shows an initial discharge of 1272.1 mA h g−1, fading to 795.7 mA h g−1 after 200 cycles at 500 mA h g−1. Pristine Fe2O3 nanospheres exhibit a relatively low reversible capacity of approximately 559.4 mA h g−1 with a poor cycling stability. These results demonstrate that Mn–Fe2O3 and Mn–Fe2O3/PPy have no large difference at relatively low current density, such as 500 mA h g−1. When the current density increased to 1000 mA g−1, Mn–Fe2O3/PPy still exhibited an excellent capacity of 643.6 mA h g−1 after 200 cycles. However, the Mn–Fe2O3 displayed 579.3 mA h g−1 at 1000 mA g−1 after 200 cycles, which is ∼10% lower than that of Mn–Fe2O3/PPy.
Excellent performance of Mn–Fe2O3/PPy is obvious shown at relatively high current density comparing with Mn–Fe2O3 and pristine Fe2O3. The rate capabilities of Fe2O3, Mn–Fe2O3 and Mn–Fe2O3/PPy are further investigated at various current densities ranging from 100 to 3000 mA h g−1. For the Mn–Fe2O3/PPy, a high average capacity of 953.3 mA h g−1 is achieved at 100 mA g−1. The capacity decreases slightly with the stepwise increase of current density. Even at high density of 3000 mA g−1, a capacity of 595.4 mA h g−1 can be still retained. Remarkably, a stable capacity of 937.4 mA h g−1 can be resumed when the current density is went back to 100 mA g−1, which remains 98% of the initial capacity before the high rate discharge/charge test. Such an excellent electrochemical performance in terms of cycling performance and rate capability is superior to pristine Fe2O3 and Mn–Fe2O3 as anode for LIBs.
As shown in Fig. 7e, pristine Fe2O3 shows a rapidly capacity fading, especially at high current density. The Mn–Fe2O3 and Mn–Fe2O3/PPy electrode shows a similar trend during the rate capacity test but the capacity lower than that of Mn–Fe2O3/PPy at high rate. Furthermore, the capacity of Mn–Fe2O3 decayed obviously at high current density. This demonstrated that the conducting polymer, PPy, which coated on the surface of Mn–Fe2O3, is beneficial to the stability of the metal oxide structure during discharge/charge cycles.
Fig. 7f shows the first four CV curves of the Mn–Fe2O3/PPy electrode in the voltage range of 0.01–3.0 V at a scan rate of 0.1 mV s−1. In the first cycles, a sharp reduction peak located at 0.62 V can be ascribed to Li insertion into Fe2O3 and formation of Li2O.16 In next cycles, the reduction peak at 0.62 V moved to 0.87 V. It has been proposed that the Li ions insertion in Fe2O3 mainly based on a multiple steps, the phase transformation from LixFe2O3 to Li2Fe2O3, the complete reduction of Li2Fe2O3 to Fe0 and Li2O.16 In the anodic scan, two broad oxidation peaks are observed at 1.61 V and 1.87 V, which correspond to the oxidation of Fe0 to Fe2+ and Fe2+ to Fe3+, respectively.15 From the second cycle, CV curves exhibit little change, including a good reversibility of the electrochemical reaction (Fe2O3 + 6Li ⇌ 2Fe + 3Li2O).39
The high reversible capacity, excellent cycling performance and outstanding rate capability can be attributed to the unique structure of Mn–Fe2O3/PPy. First, hollow nanosphere of Mn–Fe2O3 are beneficial for the electrolyte penetration, Li+ ion diffusion and alleviate the volume change. Second, doping other element in metal oxide may be cause an increase in the unite cell volume, thus making Li+ ion diffusion easier and crystal more stable. Third, the PPy coating sever three main purposes: (1) the PPy layers serve as the structural stabilizer, which buffer the large volume expansion, inhibit the aggregation and prevent the pulverization of Mn–Fe2O3 during the cycles. (2) PPy acts as a conducting polymer coating on the surface of Mn–Fe2O3, leading to enhance the conducting of Mn–Fe2O3. (3) The PPy layers serve as the interfacial stabilizer, preventing the exposure of Mn–Fe2O3 nanospheres to the electrolyte, and thus forming a stable electrode–electrolyte interphase.
4. Conclusions
In summary, Mn–Fe2O3/PPy hollow nanospheres have been synthesized by a facile template-free method. When used as anode materials for LIBs, the Mn–Fe2O3/PPy exhibit excellent electrochemical performance. The great improvement performance can be attributed to the Mn doped, PPy coating and hollow structure. Mn–Fe2O3/PPy electrode shows high reversible capacity of 795.7 mA h g−1 after 200 cycles at a current density of 500 mA g−1. Even at high rate of 1000 mA g−1, this anode also exhibit 643.6 mA h g−1 after 200 cycles. The excellent performances of Mn–Fe2O3/PPy enable them to be a new candidate for next generation of energy storage and conversion devices.Acknowledgements
This work was supported by National Natural Science Foundation of China (NSFC grant number 21301102), Scientific Research Foundation of Shandong Province Outstanding Young Scientist Award (BS2013CL023).References
- J. M. Tarascon and M. Armand, Nature, 2001, 414, 359 CrossRef CAS PubMed.
- L. Yu, H. B. Wu, G. Q. Zhang and X. W. Lou, Energy Environ. Sci., 2013, 6, 2664 CAS.
- P. G. Bruce, B. Scrosati and J. M. Trascon, Angew. Chem., Int. Ed., 2008, 47, 293 CrossRef PubMed.
- D. F. Sun, J. T. Chen, J. Yang and X. B. Yan, CrystEngComm, 2014, 16, 10476 RSC.
- B. C. Sekhar and N. Kalaiselvi, CrystEngComm, 2015, 17, 5038 RSC.
- P. Wang, M. X. Gao, H. G. Pan, J. L. Zhang, C. Liang, J. H. Wang, P. Zhou and Y. F. Liu, J. Power Sources, 2013, 239, 466 CrossRef CAS.
- X. Q. Han, X. Han, L. Q. Sun, Q. Q. Liu, W. Xu, L. Li, P. Wang and C. Wang, CrystEngComm, 2015, 17, 1754 RSC.
- N. Yan, L. Hu, Y. Li, Y. Wang, H. Zhong, X. Y. Hu, X. K. Kong and Q. W. Chen, J. Phys. Chem. C, 2012, 116, 7227 CAS.
- J. M. Jeong, B. G. Choi, S. C. Lee, K. G. Lee, S. J. Chang, Y. K. Han, Y. B. Lee, H. U. Lee, S. Kwon, G. Lee, C. S. Lee and Y. S. Huh, Adv. Mater., 2013, 25, 6250 CrossRef CAS PubMed.
- Z. G. Wu, Y. J. Zhong, J. Liu, J. H. Wu, X. D. Guo, B. H. Zhong and Z. Y. Zhang, J. Mater. Chem. A, 2015, 3, 10092 CAS.
- T. V. Thi, A. K. Rai, J. Gim and J. Kim, J. Power Sources, 2015, 292, 23 CrossRef CAS.
- H. W. Zhang, X. R. Sun, X. D. Huang and L. Zhou, Nanoscale, 2015, 7, 3270 RSC.
- R. C. Jin, L. Yang, G. H. Li and G. Chen, New J. Chem., 2014, 38, 5840 RSC.
- M. Y. Son, Y. J. Hong, J. K. Lee and Y. C. Kang, Nanoscale, 2013, 5, 11592 RSC.
- H. Xiao, Y. Xia, W. K. Zhang, H. Huang, Y. P. Gan and X. Y. Tao, J. Mater. Chem. A, 2013, 1, 2307 CAS.
- Y. H. Xu, G. Q. Jian, Y. H. Liu, Y. J. Zhu, M. R. Zachariah and C. S. Wang, Nano Energy, 2014, 3, 26 CrossRef CAS.
- H. Liu and G. X. Wang, J. Mater. Chem. A, 2014, 2, 9955 CAS.
- J. S. Cho, Y. J. Hong, J. H. Lee and Y. C. Kang, Nanoscale, 2015, 7, 8361 RSC.
- Y. F. Liu, J. M. Xu and X. Y. Qin, J. Mater. Chem. A, 2015, 3, 9682 CAS.
- C. Gao and G. M. Chen, Compos. Sci. Technol., 2016, 124, 52 CrossRef CAS.
- K. L. Xu, G. M. Chen and D. Qiu, J. Mater. Chem. A, 2013, 1, 12395 CAS.
- M. Wang, Q. X. Yang, T. D. Zhang, B. K. Zhu and G. D. Li, RSC Adv., 2016, 6, 19952 RSC.
- R. Q. Liu, Y. J. Liu, Q. Kang, A. Casimir, H. G. Zhang, N. Li, Z. D. Huang, Y. Li, X. J. Lin, X. M. Feng, Y. W. Ma and G. Wu, RSC Adv., 2016, 6, 9402 RSC.
- J. L. Liu, W. Zhou, L. F. Lai, H. P. Yang, S. H. Lim, Y. D. Zhen, T. Yu, Z. X. Shen and J. Y. Lin, Nano Energy, 2013, 2, 726 CrossRef CAS.
- G. D. Li, X. Y. Xu, R. M. Han and J. Y. Ma, CrystEngComm, 2016, 18, 2949 RSC.
- J. Y. Ma, L. W. Yin and T. R. Ge, CrystEngComm, 2015, 17, 9336 RSC.
- N. Wan, T. T. Zhao, S. W. Sun, Q. Wu and Y. Bai, Electrochim. Acta, 2014, 143, 257 CrossRef CAS.
- Y. Ma, C. L. Fang, B. Ding, G. Ji and J. Y. Lee, Adv. Mater., 2013, 25, 4646 CrossRef CAS PubMed.
- W. Zhang, W. D. Zhou, J. H. Wright, Y. N. Kim, D. W. Liu and X. C. Xiao, ACS Appl. Mater. Interfaces, 2014, 6, 7292 CAS.
- Z. Ali, S. N. Cha, J. I. Sohn, I. Shakir, C. Yan, J. M. Kim and D. J. Kang, J. Mater. Chem., 2012, 22, 17625 RSC.
- G. X. Lu, S. Qiu, J. R. Liu, X. Z. Wang, C. Z. He and Y. J. Bai, Electrochim. Acta, 2014, 117, 230 CrossRef CAS.
- Y. X. Yang, W. W. Xu, R. S. Guo, L. Liu, S. S. Wang, D. Xie and Y. Z. Wan, J. Power Sources, 2014, 269, 15 CrossRef CAS.
- I. Uhlig, R. Szargan, H. W. Nesbitt and K. Laajalehto, Appl. Surf. Sci., 2001, 179, 222 CrossRef CAS.
- L. R. Hou, L. Lian, L. H. Zhang, G. Pang, C. Z. Yuang and X. G. Zhang, Adv. Funct. Mater., 2015, 25, 238 CrossRef CAS.
- Y. C. Dong, Y. Xia, Y. S. Chui, C. W. Cao and J. A. Zapien, J. Power Sources, 2015, 275, 769 CrossRef CAS.
- G. D. Li, L. Q. Xu, Y. J. Zhai and Y. P. Hou, J. Mater. Chem. A, 2015, 3, 14298 CAS.
- J. Ge, J. J. Shi and L. J. Chen, Carbon, 2009, 47, 1192 CrossRef CAS.
- M. Wang, Q. X. Yang, T. D. Zhang, B. K. Zhu and G. D. Li, RSC Adv., 2016, 6, 19952 RSC.
- Z. G. Wu, Y. J. Zhong, J. Liu, J. H. Wu, X. D. Guo, B. H. Zhong and Z. Y. Zhang, J. Mater. Chem. A, 2015, 3, 10092 CAS.
| This journal is © The Royal Society of Chemistry 2016 |

