Functionalized MWCNTs in improving the performance and biocompatibility of potential hemodialysis membranes†
Noel Jacob Kaleekkala,
Dipak Ranab and
D. Mohan*a
aMembrane Laboratory, Department of Chemical Engineering, Anna University, Chennai-600025, India. E-mail: mohantarun@gmail.com
bDepartment of Chemical and Biological Engineering, University of Ottawa, 161 Louis Pasteur Private, Ottawa, Ontario K1N 6N5, Canada
First published on 27th June 2016
Abstract
The need to develop innovative types of hemodialysis membranes stems from the increasing incidence of renal failure and the abysmally low availability of healthy kidneys for transplantation. We aim to improve the efficiency and biocompatibility of hemodialysis membranes by the incorporation of functionalized multi-walled carbon nanotubes/polyvinyl pyrrolidone (f-MWCNTs/PVP) composites into the polyetherimide membrane matrix. The mixed matrix membranes (MMMs) were characterized by Fourier transform infrared spectroscopy, porosity, thermo-gravimetric analysis, etc. The change in cross-sectional and top surface morphology of the flat sheet mixed matrix membranes could be observed using scanning electron microscopy and atomic force microscopy. The improvement in the hydrophilicity was confirmed by the smaller water contact angle values observed. Membranes with higher concentration of the f-MWCNTs exhibited significant creatinine adsorption from model solutions in static conditions. These membranes when challenged with model protein solutions (albumin, globulin, and fibrinogen), displayed a significant depression in the quantity of proteins adsorbed, which is an indication of enhanced biocompatibility. Moreover, the membranes also prolonged blood coagulation time, suppressed attachment/activation of platelets and prevented hemolysis of the contacted red blood cells. The improvement of Chang Liver cell viability evidenced by formazan adsorption and the double cell staining technique is an indication of the cytocompatibility of these MMMs. Hollow fiber membranes of the same composition were prepared and potted into a module so as to create an effective surface area of 0.7 m2. The ultrafiltration coefficient, human serum albumin retention, was evaluated and found to be superior for these prepared membrane modules. These mixed matrix hollow fiber membranes demonstrated a greater removal of uremic toxins due to adsorption as well as diffusion. These membranes should be further investigated as potential blood purification systems.
1 Introduction
End-stage renal disease (ESRD) is an irreversible loss of kidney function affecting more than 2 million people worldwide. The incidence of this non-communicable disease is on the rise globally and requires any form of life-sustaining renal replacement therapy (RRT), for patients to lead a normal life.1 Hemodialysis using polymeric membranes has been the most widely accepted RRT for treatment of this life-threatening disease.The concept of a membrane as a semi-permeable barrier was introduced by the investigations of Abbé Nollet (1748) on the transport phenomena of naturally occurring membranes. The work was furthered by Fick (1855) who developed the fundamental laws describing the transport mechanism in a semi-permeable membrane which are still widely used.2 However the first extracorporeal hemodialysis was carried out only in 1945 by Kolff wherein sausage skins were used as the semi-permeable membrane to clear the uremic toxins from blood.3 A tremendous breakthrough in the field of membrane technology was the development of asymmetric cellulose acetate membranes by Loeb.4
Among different blood-contact applications, the hemodialysis membranes have the largest market share and are expected to grow exponentially.5 Hemodialysis replaces some of the kidney functions by removing uremic toxins and excess water from the blood extracorporeally without the loss of essential proteins. Uremic toxins, which are to be eliminated during hemodialysis, are grouped into 3 classes: (1) low molecular weight and water soluble compounds (<500 Da); (2) protein-bound and lipid soluble compounds; (3) middle molecular weight compounds (>500 Da).
Advanced functional materials and modern techniques are being employed for the removal of uremic toxins. Convective hemodiafiltration is used for the clearance of middle molecular weight toxins6,7 and sorbent assisted hemoperfusion for the removal of bound toxins.8,9
However, higher costs, varying transmembrane pressures, increased chances of clotting due to hemoconcentration, complexity of blood transport through adsorption columns and loss of essential proteins like albumin10–12 points to the need to develop a high flux hemodialysis membrane which combines sieving as well as an adsorption mechanism.
The membrane module is the heart of the RRT-hemodialysis. The key focus is on development of new materials with improved hemocompatibility and enhanced uremic toxin removal. Water soluble heparin coatings,13 blending an amphiphilic block copolymer, PLA-b-poly(2-hydroxyethyl methacrylate14) (PLA-b-PHEMA), grafting zwitterionic poly(sulfobetaine methacrylate) brushes using the ATRP technique15 and introducing anti-oxidant genistein16 were some of the recent modifications done to improve the selectivity and hemocompatibility of membranes for some blood contact applications.
Low dimensional carbon materials, carbon nano-tubes (CNTs), have generated an unprecedented interest in scientists across all disciplines since initially reported by Iijima in 1991. They are chemically inert, they have higher ratio of mesopores, possess incredible tensile strength17 and are, of late, being explored for various biomedical applications such as drug and antigen delivery,18 cellular imaging19 and microbe-resistant surfaces20
Polyetherimide (PEI) is chosen as the membrane forming polymer into which the f-MWCNT/PVP is introduced to form a mixed matrix membrane. PEI has been employed for osteoblast growth and differentiation21 and also as a coating to improve the biocompatibility for orthopedic implants,22 however to the best of our knowledge, only few studies have been carried out to investigate the hemodialysis efficiency of PEI MMMs. These nanocomposites when incorporated into the PEI matrix (i) tailors pore size of the membranes, (ii) improves the biocompatibility and cytocompatibility of the MMMs and (iii) also acts as a sorbent thereby enhancing the efficiency of these hemodialysis membranes.
In our current work, MWCNTs were functionalized and characterized before introduction into the membrane matrix. The physico-chemical and biocompatibility parameters were evaluated for the flat-sheet membranes. The hollow fibers of the same composition prepared were packed into an acrylic module and potted with polyurethane resin. The ultrafiltration coefficient, uremic toxin removal efficiency and albumin retention of these modules were then investigated.
2 Materials and methodology
2.1 Materials
Polyetherimide (PEI) from Sigma Aldrich Inc., St. Louis, MO is in the form of light yellow-amber pellets (density 1.27 g ml−1 at 25 °C) and was used as obtained. The solvent N-methyl-2-pyrrolidone (NMP) from SRL Chemicals Ltd., Mumbai, India was pre-dried before use. Multi-walled carbon nanotubes (OD-10–20 nm and length 10–30 μm) were procured from Loba Chemie Pvt. Ltd., Mumbai, India and all acids used were emplura grade from Merck Millipore, Germany. Molecular grade creatinine (Mw 112 Da), cytochrome-c (Mw 11.8 kDa), human serum albumin (HSA; Mw 66.5 kDa), ϒ-globulin (Mw 150 kDa) and bovine fibrinogen (FN; Mw 340 kDa) were procured from Himedia Laboratories Pvt. Ltd., Mumbai, India. The biocompatibility and MTT assay kits used were from BioVision, CA. These materials and reagents were used as such without further purification. De-ionized (DI) water was used for all solution preparations and studies.2.2 Preparation of functionalized MWCNTs
1 g of the pristine MWCNTs was soaked in an 80 ml concentrated acid mixture of 3![[thin space (1/6-em)]](https://www.rsc.org/images/entities/char_2009.gif) :
:![[thin space (1/6-em)]](https://www.rsc.org/images/entities/char_2009.gif) 1 H2SO4/HNO3 for 1 h. The mixture was then introduced into an ultrasonic bath (containing a PZT transducer having a nominal frequency 30 kHz) for 0.5 h at room temperature, followed by continuous refluxing at 60 °C for 2 h. The solution was then centrifuged and the products were washed repeatedly with DI water until the pH of the solution turned neutral. The resulting functionalized MWCNTs were separated by filtering through a 0.45 μm filter and dried overnight in a vacuum oven for further use. The functionalization of the MWCNTs were confirmed through wide angle powder XRD (Bruker, Germany), HR-SEM (Quanta 200 FEG, USA), Confocal Raman spectroscopy (Renishaw, Gloucestershire, England), HR-TEM (JEOL 3010, Japan), FT-IR spectroscopy (Nicolet Avatar 370, USA) and optical images of the dispersions.
1 H2SO4/HNO3 for 1 h. The mixture was then introduced into an ultrasonic bath (containing a PZT transducer having a nominal frequency 30 kHz) for 0.5 h at room temperature, followed by continuous refluxing at 60 °C for 2 h. The solution was then centrifuged and the products were washed repeatedly with DI water until the pH of the solution turned neutral. The resulting functionalized MWCNTs were separated by filtering through a 0.45 μm filter and dried overnight in a vacuum oven for further use. The functionalization of the MWCNTs were confirmed through wide angle powder XRD (Bruker, Germany), HR-SEM (Quanta 200 FEG, USA), Confocal Raman spectroscopy (Renishaw, Gloucestershire, England), HR-TEM (JEOL 3010, Japan), FT-IR spectroscopy (Nicolet Avatar 370, USA) and optical images of the dispersions.
2.3 Membrane preparation
| Flat sheet membrane sample | f-MWCNTs in nanocomposite (% of total composition) | Average surface roughness (nm) |
|---|---|---|
| M0 | 0.00 | 240 ± 25 |
| M1 | 0.05 | 170 ± 14 |
| M2 | 0.10 | 94 ± 08 |
| M3 | 0.20 | 85 ± 10 |
![[thin space (1/6-em)]](https://www.rsc.org/images/entities/char_2009.gif) :
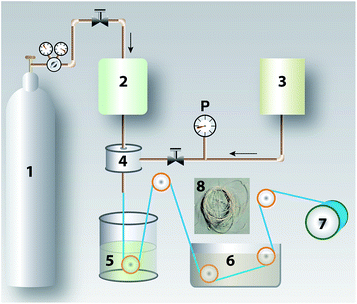
:![[thin space (1/6-em)]](https://www.rsc.org/images/entities/char_2009.gif) 30 ratio. The precipitated fibers were washed in two successive baths to remove any remnant solvent and then rolled onto the collecting drum. Desired lengths of the fibers were cut and washed before potting using polyurethane. The module was filled with 2.5 wt% glycerol and stored for further studies.
30 ratio. The precipitated fibers were washed in two successive baths to remove any remnant solvent and then rolled onto the collecting drum. Desired lengths of the fibers were cut and washed before potting using polyurethane. The module was filled with 2.5 wt% glycerol and stored for further studies.
2.4 Membrane characterizations
The physico-chemical characterizations of the prepared mixed matrix membranes were carried out as explained in Section S1 (ESI†).2.5 Blood compatibility of flat-sheet membranes
Fresh blood was collected for all the blood compatibility experiments and studies were carried out as described in Section S2 (ESI†). All of the blood related experiments were performed in accordance with the relevant laws and institutional ethical guidelines, and also the Anna University (Chennai, India) ethics committee has approved these experiments. An informed consent was obtained from the donor for collecting fresh blood for performing the blood compatibility experiments.2.6 Cytocompatibility studies
Cell proliferation and cell viability of the cultured Chang liver cells on the MMMs were evaluated as described in Section S3 (ESI†).2.7 Hollow fiber membranes
 | (1) |
| Relative concentration = cT/ci | (2) |
The level of creatinine was quantified by the Jaffe reagent (Creatinine Kit, Erba Mannheim) using a micro plate reader (PerkinElmer ENFIRE) at 570 nm. Here n = 3.
The solutes chosen were creatinine, a uremic toxin which is unable to be excreted by patients suffering from renal failure and cytochrome-c, a surrogate molecule for any middle molecular weight toxin beta 2M. Freshly prepared PBS is used as the dialysate. The blood side flow rate (Qb,i) was maintained at 100 ml min−1 and the dialysate side (Qd,in) at 200 or 350 ml min−1 in a countercurrent flow. This entire in vitro dialysis was performed for 3 h at 37 °C. Solute reduction ratio (S.R.R) during the run for 2 h is calculated as follows:
 | (3) |
The ultrafiltration coefficient, BSA retention and solute clearance were all run with 5 different modules of the same composition and the results are expressed as the mean ± SD.
3 Results and discussion
3.1 Characterization of functionalized MWCNTs
The pristine MWCNTs obtained were highly hydrophobic and did not disperse in water and other polar aprotic solvents like NMP. In order to overcome these shortcomings and to endow the membranes with hydrophilic character, these MWCNTs were functionalized using concentrated sulphuric acid and nitric acid. This treatment introduces hydroxyl and carboxylic acid functional groups onto the backbone of the nanotubes, which improves its dispersion in our solvent, NMP (Fig. 2a).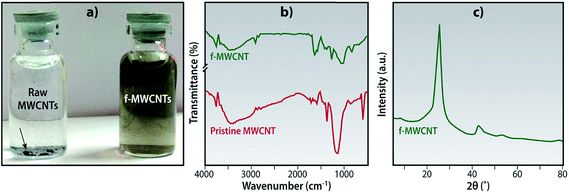 | ||
| Fig. 2 Functionalized MWCNTs (a) optical images of dispersions in NMP (sonicated for 0.5 h and image taken after 1 h), (b) FT-IR spectra and (c) wide angle X-ray scattering scan. | ||
The FTIR spectra was analyzed to confirm that these functional groups have been introduced onto the MWCNTs. The pristine MWCNTs did not show any significant peaks as they had no functional groups bound to its skeleton. Fig. 2b shows the spectra of the f-MWCNTs; the broad peak from 3200–3500 cm−1 corresponds to the –OH stretching vibrations of the alcohol and peak at 2920 cm−1 indicates the –OH stretching of the carboxylic acid groups. The 1641 cm−1 and 1053 cm−1 peaks confirms the presence of acid carbonyl (C![[double bond, length as m-dash]](https://www.rsc.org/images/entities/char_e001.gif) O) and primary alcohol (R–O–H) respectively.23 All these peaks are an indication that the functionalization has been successfully carried out.
O) and primary alcohol (R–O–H) respectively.23 All these peaks are an indication that the functionalization has been successfully carried out.
The Fig. 2c shows the XRD patterns of the f-MWCNTs by an instrument using a Cu Kα source (λ = 0.1541 nm), the most prominent sharp peak at 2θ = 25.5° corresponds to the (002) reflection of the graphite skeleton. The peak intensity and sharpness indicates that the skeleton was oxidized without any significant damage. This result is similar to certain other studies.24 Other peaks observed at 2θ = 43° and 54° are related to the reflections of the (100) and (004) planes.
Oxidation of MWCNTs under harsh acidic conditions is known to cause appreciable etching of carbon material leading to a graphitic structure with high defect density.25 The HR-SEM and HR-TEM of f-MWCNTs show typical tubular structures without any visible damages to the structural integrity as seen in Fig. 3 and S1.†
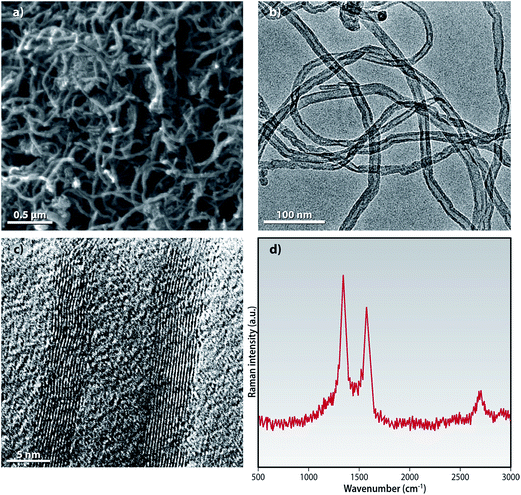 | ||
| Fig. 3 (a) HR-SEM (b) low magnification HR-TEM (c) high magnification HR-TEM images and (d) Raman spectroscopy of the f-MWCNTs. | ||
Raman spectroscopy is an important technique for the characterization of low dimensional carbon materials. The Raman spectra for the f-MWCNTs, excited with the 514.5 nm laser line as shown in the Fig. 3d exhibits the typical characteristic bands: D-band at ∼1339 cm−1, G-band at ∼1574 cm−1 and the 2D band at ∼2620 cm−1 (not shown). The D-band is considered as a measure of disorder in the graphitic skeleton of the MWCNTs and it arises due to the double resonance Raman scattering process from a non-zero-center phonon mode. This structural disorder could be of many of types e.g., rings along with defects on the nanotube walls, vacancies, heptagon–pentagon pairs, kinks and heteroatoms.25,26 The G band arises due to the tangential vibrations of the carbon atom. It is explained by the C–C stretching in the graphitic skeleton.
These characterizations prove that the MWCNTs have been functionalized and they still retain their structural integrity.
3.2 Physico-chemical characteristics of the flat sheet MMMs
The viscosity of the dope solutions were measured at a constant shear rate. There is an apparent increase in viscosity with the increase in concentration on f-MWCNTs added. Even a small quantity of the nano-particles significantly increases the viscosity of the dope solution as shown in Fig. 4. This could be due to the high aspect ratio of the f-MWCNTs and these nanoparticles interconnect polymer chains leading to the formation of a dense network.27 This network like structure could hinder the movement of the individual polymer chains thereby increasing the viscosity of the solution. This increase in viscosity rheologically suppresses the rate of diffusion between the solvent and non-solvent during phase-inversion which, in turn, alters membrane morphology and performance.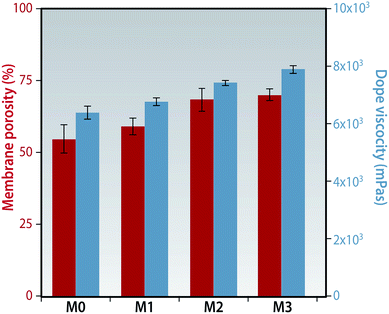 | ||
| Fig. 4 Porosity of the membranes evaluated by gravimetric method. Dope solution viscosity determined by the rheometer at a shear rate of 0.1 s−1. | ||
A considerable increase in porosity is seen on introduction of these f-MWCNTs in the membrane matrix. The porosity increased from 54.8% in membrane M0 to 70.2% in M3 (Fig. 4). Other researchers have observed a decrease in porosity of the membranes when the nanoparticle concentration was about 1%, although an increase was observed at lower concentrations similar to our results.28 The increase in porosity could be due to the formation of a highly interconnected porous sub-layer as explained in a later section.
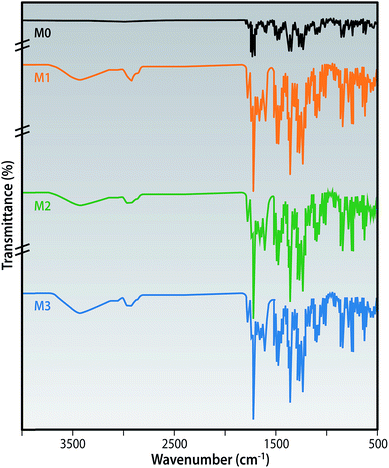
The chemical structure of the MMMs are shown by the ATR-FTIR spectra in Fig. 5. All of the membranes exhibited the characteristic peaks of the PEI polymer as follows:
1778 and 1718 cm−1 (symmetric and asymmetric stretching of C![[double bond, length as m-dash]](https://www.rsc.org/images/entities/char_e001.gif) O of the imide groups), 1350 cm−1 (C–N stretching in phthalimide rings), 1270, 1232 and 1018 cm−1 (aryl bond vibrations).29
O of the imide groups), 1350 cm−1 (C–N stretching in phthalimide rings), 1270, 1232 and 1018 cm−1 (aryl bond vibrations).29
The introduction of the broad peak at ∼3450 cm−1 and 2930 cm−1 is due to the –O–H stretching vibrations of the alcohol and carboxylic acid groups present in the f-MWCNTs. The C![[double bond, length as m-dash]](https://www.rsc.org/images/entities/char_e001.gif) O stretching of the carboxylic acid groups at 1665 cm−1 was recorded in the MMM spectra and was not displayed in the pristine membrane. These confirm that the f-MWCNTs have been incorporated into the surface of the prepared membranes as reported by earlier studies in PES matrix.30
O stretching of the carboxylic acid groups at 1665 cm−1 was recorded in the MMM spectra and was not displayed in the pristine membrane. These confirm that the f-MWCNTs have been incorporated into the surface of the prepared membranes as reported by earlier studies in PES matrix.30
The Fig. 6 shows the cross sectional images of the prepared membranes as observed using a SEM. The membranes displayed a typical asymmetric structure having a thin skin layer supported by a porous substructure. The addition of the f-MWCNTs leads to the formation of well-defined finger like pores altering the morphology of the pristine membrane. The addition of these nanoparticles beyond 0.1 wt% leads to an increase in skin layer thickness which can be explained as a result of increase in viscosity which lowers the rate of de-mixing during membrane formation.31 It can be hypothesized that the two effects in play during the membrane formation are the dope solution viscosity and the presence of hydrophilic moieties both which impacts the cross sectional morphology. These hydrophilic f-MWCNTs improve the porosity of the MMMs as they induce micro-phase separations throughout the membranes as seen in the figure.32,33
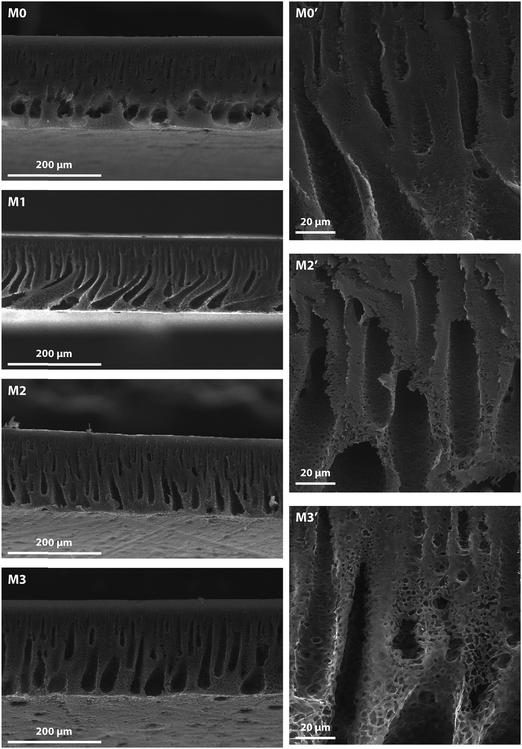 | ||
| Fig. 6 SEM image showing the cross-sectional morphologies of the MMMs. Images are oriented with the skin layer on top. | ||
The f-MWCNTs are found to have suppressed the macro-void formation by lowering the rate of de-mixing, and the PVP used forms a composite with the nano-particles that helps to uniformly disperse them. This leads to a smoother defect-free surface which is in concordance with the findings of Chan et al. where they introduced f-MWCNTs into (PVDF) membranes.34
Surface roughness is another factor influencing the performance of the MMMs. Smoother surfaces have been seen to show lower protein adsorption and this in turn is dependent on the shape and nature of the protein in consideration.35 This was determined by non-contact AFM and translated to a z-axis variation with the help of the software. Mean roughness (Ra) is defined as the mean value of the surface area relative to an arbitrary center plane when the volume enclosed by the image on either sides of this plane (in z direction) is equal.
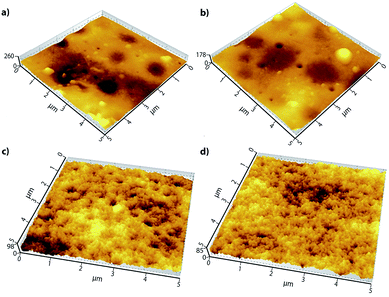
The Fig. 7 shows the 3-D AFM scan of all the prepared membranes for a 5 μm × 5 μm area. The brighter spots correspond to the highest regions of the membranes and the darker ones are indicative of the valleys or membrane pores. There is an observable change in surface morphology with the addition of the f-MWCNTs into the PEI matrix. There is only a small decrease in surface roughness for membrane M1, and the membranes with a higher concentration of the nanoparticles show a lower mean roughness. It could be assumed that the biopolymer PVP has a proclivity to enfold the f-MWCNTs which leads to a greater miscibility in the dope solution thereby lowering the surface roughness. Many studies show an increase in membrane surface roughness when MWCNTs are incorporated;36,37 however our results are in accordance with researchers who modified the MWCNTs using PVP38 or by grafting methyl ether methacrylate onto it.33
The hydrophilicity of the membrane surface is a key factor that determines the flux, wettability and the fouling resistance of the membranes. The incorporation of low dimensional functionalized carbon materials have provided an effective and facile route for enhancing the hydrophilicity of the membranes.34,39,40 Sessile drop contact angle measurement is the most versatile technique to evaluate the hydrophilicity of the membranes. The addition of the f-MWCNTs into the matrix of the PEI membranes significantly improves the hydrophilicity as can be observed by the lower contact angle values as seen in the Fig. 8. During the phase inversion process the f-MWCNTs migrate towards the interface (darker top surface observed in the prepared membranes) and its alcohol and carboxylic acid functional groups orient themselves towards water so as to minimize the interfacial free energy.
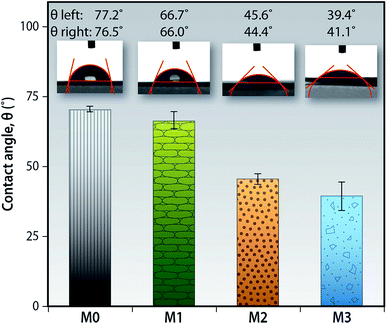 | ||
| Fig. 8 Wettability of the membrane surfaces by measuring the contact angle of DI water on the membrane surface (here n = 8). | ||
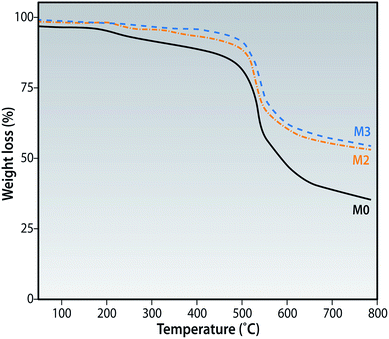
The membranes have a similar TGA profile trace as shown in Fig. 9. All membranes show a small and gradual weight loss up to 190 °C which could be related to the evaporation of some residual moisture/solvent. The subsequent weight losses at 200 °C seen for M0 could be explained by the cross linking and chain scissioning while the losses at 425 °C could be attributed to the decomposition of the aromatic rings of the polymer backbone.41 As the concentration of f-MWCNTs in the membrane matrix is increased, the motion of the polymer chains are believed to be restricted thereby preventing its degradation at lower temperatures as seen for membrane M3. This is another confirmation that the f-MWCNTs added are present in the membrane matrix.
3.3 Bio-compatibility of the flat-sheet membranes
The first trigger event is the non-specific adsorption of protein and clotting enzymes which leads to unfavorable responses like activation of the complement system, coagulation cascade, fibrinolytic systems and cell mechanisms.42
Hence, protein adsorption becomes the paramount criterion for estimating blood–membrane compatibility.
The protein–membrane interactions are influenced by both membrane character (surface free energy, surface topography and membrane surface charge) as well as the nature of the protein solution (pH, concentration, nature of the protein, etc.) that the membrane comes in contact with.43
The smaller proteins present in the blood plasma diffuse faster and reach the surface of the membrane and they dictate the initial rate of adsorption. Proteins which are larger understandably take a longer time to reach the surface, however they have a much higher affinity to the membrane and are more strongly bound because of the larger contact area. These larger proteins then tend to displace the smaller ones as it spreads onto the surface. Hence it is seen that the total quantity of proteins adsorbed passes through a maximum during adsorption and this effect is termed as Vroman effect.44,45
Considerable research into the phenomenon of protein adsorption has led to the conclusion that proteins have a higher propensity to be adsorbed onto non-polar, high surface tension or charged substrates. Many kinetic models have been put forward to explain the mechanism of protein adsorption onto blood contacting devices-basic Langmuir model, two states model, three states model, roll over model, tracking model, etc.46,47
We considered three types of blood serum protein. HSA is a heart shaped protein from the albumin group of proteins and is most widely present in serum plasma. It, typically, is adsorbed the most onto membranes during hemodialysis. Fibrinogen (FN) is a glycoprotein having a cylindrical shape with rounded ends and is present in the blood serum which during the wake of the coagulation cascade gets converted to strands of fibrin by zymogen prothrombin.48 ϒ-Globulins is a Y-shaped globulin protein, widely present in the blood serum. They play a pivotal role in the adsorption of erythrocytes on the surface of the membrane and positively promote platelet adhesion.49 All these proteins have an isoelectric point lower than the physiological pH of 7.4 and hence bear a net negative charge at this pH.
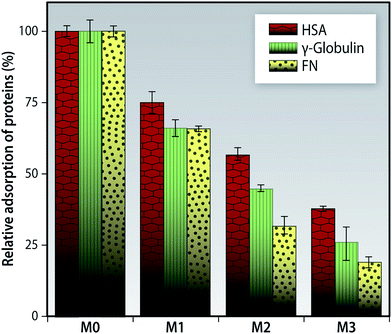
In our present study, we found that the protein adsorption onto the MMMs is suppressed in comparison to the pristine membrane M0 for all three proteins as seen in Fig. 10. It could be due to the synergistic effect of the following factors-firstly, the surface tension of the MMMs is lowered as a result of the f-MWCNTs migrating to the top surface during the membrane preparation; hence protein adsorption onto these membranes becomes non-spontaneous. The system maintains a higher state of entropy when bound to water than when compared to proteins.50 Secondly, the increase in hydrophilicity of the MMMs as evidenced from the lower contact angle value is due to the formation of a hydration layer due to the interaction of water with the –OH and –COOH groups present on the f-MWCNTs. This hydration layer prevents the non-specific binding of all proteins. Thirdly, due to the dissociation of the hydroxyl groups of the f-MWCNTs the membranes tend to exhibit a negative charge. Thus, the negatively charged protein molecules will face an electrostatic repulsion at the membrane surface.51
Though there are reports of albumin being able to improve the biocompatibility of surfaces through a surface-passivation effect,52,53 we find that our membranes had great resistance to binding of non-specific proteins, thus preventing them from forming a protein cake-layer that could reduce the efficiency of the membranes.
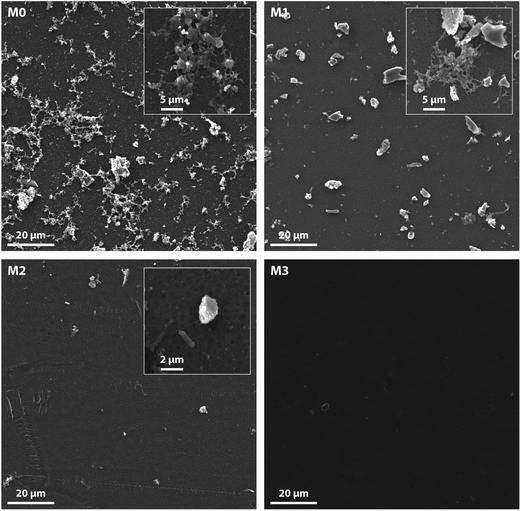
In order to determine the blood compatibility of our MMMs, the in vitro platelet adhesion test was carried out. The number of platelets attached and activated exhibited a significant decline as observed from the SEM images, as seen in the Fig. 11. The morphology of the platelets is also of great concern. The change in shape of these adsorbed platelets and their varied morphologies depend on the stage of the activation sequence-discoid or dendritic (early pseudopodial), spread/dendritic (intermediate pseudopodial), spreading (late pseudopodial and hyaloplasm spreading) and full spreading (hyaloplasm well spreading and no distinct pseudopodia).55
As observed, the aggregation and spreading of the platelets is most prominent for the pristine membrane M0. However, on increasing the content of the f-MWCNTs, a significant decline in the number of platelets adhered was noticed. The adhered platelets retained their original morphology. These results are in concordance with other researchers33 and also with our protein adsorption studies. The surface hydrophilicity and charge of the membranes could explain these results.
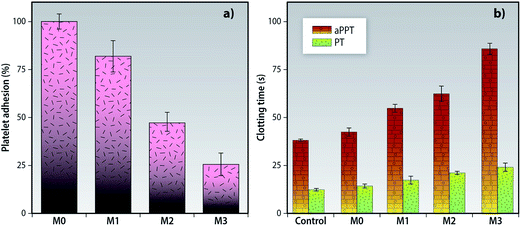
This qualitative assessment of the platelet adhesion onto the MMMs was further quantified by the LDH assay. The adhered platelets release lactic dehydrogenase which was used to measure the degree of membrane-specific adhesion. A drop of about 74% in the number of platelets adsorbed by M3 when compared to M0 was observed as shown in the Fig. 12a.
As seen in the Fig. 12b, the MMMs showed prolonged clotting times when compared to the pristine membrane M0. The aPTT was prolonged from 42.5 s in membrane M0 to 84 s in membrane M3. Similarly, PT values also increased from 12.5 s for M0 to 24.2 s for M3. This behavior is attributed to increase in hydrophilicity, formation of a hydration layer, suppressed protein adsorption and reduced platelet adsorption/activation. These results are in consonance with earlier reports.38,59 The presence of the f-MWCNTs/PVP nanocomposite at the top surface is responsible for the improvement biocompatibility of the PEI membranes.
We find that all of our prepared membranes exhibited a hemolysis ratio less than 5% and this is well within the safety limit imposed for biomaterials as set by the ASTM F-756-08 standard. Moreover, M3 showed the least amount of hemolysis (table). These results are comparable to the commercially available F6 (Fresenius) membrane60 which was run in the same contact assay mode.
3.4 Cell culture studies
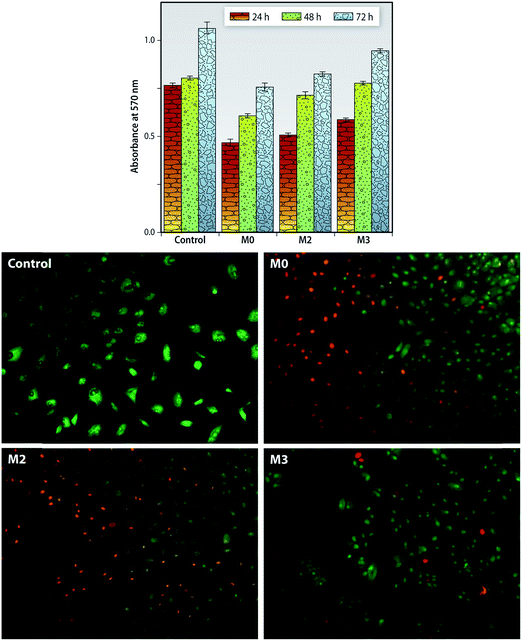
Cytocompatibility of the prepared membranes is a critical parameter as these membranes are to be used for hemodialysis application. In this study the viability of the seeded Chang Liver cells was evaluated for 24, 48 and 72 h as shown in the Fig. 13 (top). There is an increase of formazan absorbance on all the control (polystyrene cell-culture plate) as well as the membranes indicating cell proliferation. Membrane M3 showed comparatively higher proliferation rates-0.78 ± 0.01 at 48 h and 0.95 ± 0.01 at 72 h. Membranes with the f-MWCNTs exhibited higher growth and proliferation rates of these cells. The hydrophilicity improves on addition of these nano-particles which imparts high surface energy to these MMMs, and could bind and stabilize cell proteins to achieve higher growth.61 These MMMs have an improved cytocompatibility which could be further utilized for any cell contact application like bio-artificial liver, etc.Further we also performed the live cell/dead cell staining technique using acridine orange (AO) and ethidium bromide staining method (Fig. 13). In principle, AO can cleave the intact cell membrane and interact with components of the nucleus, and hence only the viable cells will be stained green. The ethidium bromide is a specific cell stain, which imparts the color red to the apoptotic cells due to the impermeable nature of its cell membrane. Cell layer was observed on surface of the MMMs with distinct rounded nuclei, indicating normal cell growth. Pristine PEI membranes visualized greater apoptotic cells; whereas the number of viable cells increased with the increase in the f-MWCNTs incorporated. These results suggest that nanoparticle incorporated membranes had significant cell adhesion and cell growth when compared to native PEI membranes. These findings are concordant with the MTT assay and hence it can be concluded that f-MWCNTs plays a major role in enhancing the cytocompatibility and biocompatibility of our MMMs.
3.5 Hollow fiber membranes
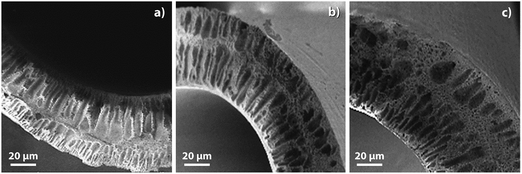
The cross-sectional morphology of the fibers is shown in Fig. 14. All the fibers were spun using the dry-wet phase inversion technique as described earlier. The prepared fibers had uniform skin layers on both the sides (inner and outer) in contact with the inner and outer coagulants. The membrane wall also displayed finger like pores extending inwards from the skin layers. The modified membranes (HF-1, HF-2) showed an increase in the thickness of the sponge like layer at the center of the wall. This can be explained by the delay in demixing brought about by an increase in viscosity of the dope solution. The lumen/wall thickness of all the spun fibers were observed to be in the range of 220 μm/45–55 μm. The increase in wall thickness for HF-1 and HF-2 is due to the curtailed elongation of the dope solution in the air-gap due to the higher viscosity of the dope.
The fibers prepared in our study were much smaller in diameter and had lower wall thickness as compared to earlier studies.60 However, these dimensions were still larger than the commercially available hollow fiber membranes, which is a ‘constraint’ of the spinneret we developed. It should be possible to achieve dimensions similar to these commercial fibers by replacing the spinneret.
Each hollow fiber can be considered as a thin walled cylinder, and it is imperative that these fibers withstand the operating pressure without any breakage. The walls of these fibers are porous, and have to withstand a certain degree of elongation before they collapse or burst. The degradation of polymeric membranes can be generally explained by three factors - mechanical, thermal and chemical. Mechanical degradations are believed to cause early life failures due to perforations, cracks, tears, or pinholes.63 The mechanical strength of the MMMs, therefore, remains the most important aspect of the membrane for practical applications.
The tensile strength and % elongation at break are as tabulated in Table 2. Both parameters are observed to rise in proportion to an increase in the content of f-MWCNTs of the polymer matrix. This phenomenon could be explained as follows: these low dimensional f-MWCNTs have a unique architecture and form a network within the membrane by bridging various chains of the polymer, thereby resulting in a high interaction between the nanoparticle and the PEI.64,65 The increase in % of elongation at break further confirms that the f-MWCNTs with a high specific area and aspect ratio act as effective fillers that significantly improve the mechanical stability of the MMMs.
| Hollow fiber membrane sample/module | f-MWCNTs in nanocomposite (%) | Mechanical properties | U.F.R. (ml m−2 h−1 mmHg−1) | BSA retention (%) | |
|---|---|---|---|---|---|
| Tensile strength (MPa) | % elongation at break | ||||
| HF-0 | 0.00 | 3.2 ± 0.2 | 12.4 ± 1.6 | 14.0 ± 3.0 | 95.5 ± 1.0 |
| HF-1 | 0.10 | 4.1 ± 0.3 | 38.8 ± 2.1 | 34.0 ± 5.0 | 97.0 ± 0.5 |
| HF-2 | 0.20 | 4.6 ± 0.3 | 36.9 ± 2.6 | 48.0 ± 4.5 | 98.0 ± 1.0 |
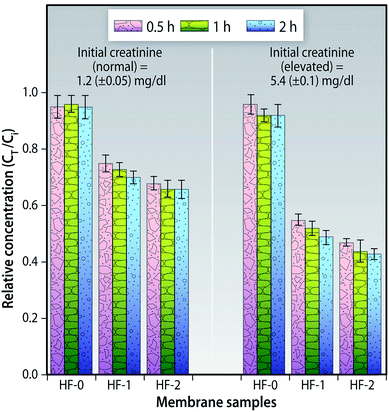 | ||
| Fig. 15 Relative concentration of creatinine for the hollow fiber membranes at various time intervals (n = 3). | ||
This static adsorption study indicates that the creatinine could access the f-MWCNTs in the MMM which in turn implies that a major portion of the f-MWCNTs are present on the membrane surface or on the pore walls. These findings could not be directly compared to that of creatinine adsorption either on CNTs66 or activated carbons67 because of the differences in approach, but are indicative that these f-CNTs can be employed for creatinine adsorption.
These results show that even under such low loading ratios of f-MWCNTs/blood plasma, significant adsorption of creatinine occurs. They cannot, however, be compared to hemoperfusion where the sorbent (charcoal)/plasma loading ratio is nearly 100 mg ml−1.
These membranes also exhibit certain expedient properties:
(a) No significant pressure drop or channeling occurs during the use of these high efficiency membranes.
(b) The nanoparticles are embedded in the membrane matrix which prevent fragments from entering the blood stream.67
Furthermore, creatinine clearance by diffusion and the higher adsorption rate would reduce the duration of the dialysis procedure alleviating the discomfort of the patient.
HF-1 and HF-2 have a higher KUF as compared to the pristine hollow fiber dialyzer, indicating a greater number of well distributed pores arise due to the incorporation of the f-MWCNTs. HF-2 has KUF of 48.5 ± 4.5 ml h−1 m−2 mmHg−1 which is similar to that of the commercial available Fresenius medical care, FX-60 high-flux dialyzers.69
The creatinine removal ratio is found to be higher for HF-1 and HF-2 when compared to the pristine HF-0 (Fig. 16). This suggests that the reduction is not only due to diffusion but also adsorption. On increasing the dialysate flow rate from 200 to 350 ml min−1, a significant improvement in the creatinine removal was not observed further ratifying the fact that adsorption plays an important role.
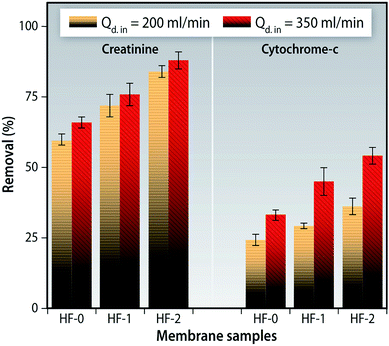 | ||
| Fig. 16 Creatinine and cytochrome-c removal ratio of hollow fiber membrane modules at varying flow rates of dialysate solution (200 ml min−1 and 350 ml min−1). | ||
β2-Microglobulin (β2M) is a middle molecular weight (11.8 kDa) toxin which could lead to amyloidosis in patients suffering from ESRD. It has been shown that, through accumulation, it invades synovial membranes and osteoarticular sites. As a result, it causes destructive osteoarthropathies, such as carpal tunnel syndrome, etc.70 We used cytochrome-c as a surrogate molecule to evaluate the removal efficiency of the middle molecular weight toxins as it can be determined easily. A significant increase in cytochrome-c was observed when the flow rate of the dialysate (for all membranes) was increased (Fig. 16). This implies that flow rates could be a determining factor for middle molecular weight toxins as reported in a clinical study using commercial dialyzers.71
4 Conclusion
In this study we have proposed an efficient and viable method to modify polyetherimide membranes for blood-contact applications. We introduced f-MWCNTs along with an anchoring agent PVP in order to tailor the pore size of the membranes, improve the efficiency of uremic toxin removal and impart biocompatibility. The MMMs exhibited prolonged clotting times, reduced adsorption of proteins, lowered complement adhesion/activation and elicited minimal hemolysis. These membranes also promoted proliferation and growth of the Chang Liver cells for up to 72 h. Furthermore, membranes with higher contents of nanoparticles exhibited greater cytocompatibility. Hollow fiber membranes with f-MWCNTs (HF-2) displayed superior toxin removal properties and enhanced biocompatibility. These results conclusively prove that this facile modification improves efficiency as well as biocompatibility of PEI membranes and holds considerable promise for the future of hemodialysis research.Acknowledgements
The authors thank Ms Lidia Thai Thomas for Atomic force microscopy studies. We also thank Mr Ramesh Girish and Dr Soundararajan Periasamy, Department of Nephrology, Sri Ramachandra University, Porur, Chennai for the help with the cell culture studies. We would also like to thank Mrs Jessy Rachel Jacob and Mr Philip George T at the Electron Microscopy unit, Faculty of Medicine, Health Science Center, Kuwait for assistance with the characterizations and for valuable inputs in the writing of the manuscript respectively. This work was in part sponsored by the Department of Science and Technology, Government of India.References
- P. Komenda, N. Yu, S. Leung, K. Bernstein, J. Blanchard, M. Sood, C. Rigatto and N. Tangri, CMAJ Open, 2015, 3, E8–E14 CrossRef PubMed.
- R. Singh, Membrane Technology and Engineering for Water Purification: Application, Systems Design and Operation, Elsevier Science, 2014 Search PubMed.
- Replacement of Renal Function by Dialysis: A Textbook of Dialysis, ed. J. F. Maher, Springer Science & Business Media, 2012 Search PubMed.
- S. Loeb, Synthetic Membranes: Desalination, ed. A. F. Turback, Washington, D. C., 1981, vol. 153, pp. 1–9, Am. Chem. Soc Search PubMed.
- Medical Membranes Market by Chemistry, Technology, Application, & by Geography - 2020; MarketsandMarkets, January 2016, Report Code: CH 1058 Search PubMed.
- G. M. Frascà, S. Sagripanti, M. D'Arezzo, S. Oliva, A. Francioso, G. Mosconi, L. Zambianchi, F. Sopranzi, R. Boggi, L. Fattori, A. Rigotti, L. Maldini, A. Gattiani, G. Del Rosso, A. Federico, L. Da Lio and L. Ferrante, Ther. Apheresis Dial., 2015, 19, 154–161 CrossRef PubMed.
- L. A. Pedrini, C. Krisp, A. Gmerek and D. A. Wolters, Blood Purif., 2014, 38, 115–126 CrossRef CAS PubMed.
- B. Guo, Q. Gong, J. Wang, Y. Huang, D. Zhuang and J. Liang, RSC Adv., 2015, 5, 46997–47003 RSC.
- J. Li, D. Li, Y. Xu, A. Wang, C. Xu and C. Yu, Renal Failure, 2015, 37, 103–107 CrossRef CAS PubMed.
- A. Vega, B. Quiroga, S. Abad, I. Aragoncillo, D. Arroyo, N. Panizo and J. M. López-Gómez, Ther. Apheresis Dial., 2015, 19, 267–271 CrossRef CAS PubMed.
- M. S. L. Tijink, M. Wester, J. Sun, A. Saris, L. a. M. Bolhuis-Versteeg, S. Saiful, J. a. Joles, Z. Borneman, M. Wessling and D. F. Stamatialis, Acta Biomater., 2012, 8, 2279–2287 CrossRef CAS PubMed.
- H. Schmid and H. Schiffl, Int. Urol. Nephrol., 2012, 44, 1435–1440 CrossRef PubMed.
- L. Wang, B. Su, C. Cheng, L. Ma, S. Li, S. Nie and C. Zhao, J. Mater. Chem. B, 2015, 3, 1391–1404 RSC.
- L. Zhu, F. Liu, X. Yu and L. Xue, ACS Appl. Mater. Interfaces, 2015, 7, 17748–17755 CAS.
- J. Jiang, P. Zhang, L. Zhu, B. Zhu and Y. Xu, J. Mater. Chem. B, 2015, 3, 7698–7706 RSC.
- T. Chang, C. Neelakandan, L. DeFine, T. Alexander and T. Kyu, J. Phys. Chem. B, 2014, 118, 11993–12001 CrossRef CAS PubMed.
- C. Ye, Q. Gong, F. Lu and J. Liang, Sep. Purif. Technol., 2008, 61, 9–14 CrossRef CAS.
- A. Bianco, K. Kostarelos, C. D. Partidos and M. Prato, Chem. Commun., 2005, 571–577 RSC.
- A. Bonetti, S. Pellegrino, P. Das, S. Yuran, R. Bucci, N. Ferri, F. Meneghetti, C. Castellano, M. Reches and M. L. Gelmi, Org. Lett., 2015, 17, 4468–4471 CrossRef CAS PubMed.
- L. M. Gilbertson, D. G. Goodwin, A. D. Taylor, L. Pfefferle and J. B. Zimmerman, Environ. Sci. Technol., 2014, 48, 5938–5945 CrossRef CAS PubMed.
- A. Zomorodian, M. P. Garcia, T. Moura E Silva, J. C. S. Fernandes, M. H. Fernandes and M. F. Montemor, Mater. Sci. Eng., C, 2015, 48, 434–443 CrossRef CAS PubMed.
- S.-B. Kim, J.-H. Jo, S.-M. Lee, H.-E. Kim, K.-H. Shin and Y.-H. Koh, J. Biomed. Mater. Res., Part A, 2013, 101, 1708–1715 CrossRef PubMed.
- T. A. Saleh, Appl. Surf. Sci., 2011, 257, 7746–7751 CrossRef CAS.
- Y.-C. Chiang, W.-H. Lin and Y.-C. Chang, Appl. Surf. Sci., 2011, 257, 2401–2410 CrossRef CAS.
- V. Datsyuk, M. Kalyva, K. Papagelis, J. Parthenios, D. Tasis, A. Siokou, I. Kallitsis and C. Galiotis, Carbon, 2008, 46, 833–840 CrossRef CAS.
- J. H. Lehman, M. Terrones, E. Mansfield, K. E. Hurst and V. Meunier, Carbon, 2011, 49, 2581–2602 CrossRef CAS.
- J. Yin, G. Zhu and B. Deng, J. Membr. Sci., 2013, 437, 237–248 CrossRef CAS.
- V. Vatanpour, S. S. Madaeni, R. Moradian, S. Zinadini and B. Astinchap, Sep. Purif. Technol., 2012, 90, 69–82 CrossRef CAS.
- R. S. Hebbar, A. M. Isloor, A. F. Ismail, S. J. Shilton, A. Obaid and H.-K. Fun, New J. Chem., 2015, 39, 6141–6150 RSC.
- P. Daraei, S. S. Madaeni, N. Ghaemi, M. A. Khadivi, B. Astinchap and R. Moradian, J. Membr. Sci., 2013, 444, 184–191 CrossRef CAS.
- S. Majeed, D. Fierro, K. Buhr, J. Wind, B. Du, A. Boschetti-de-Fierro and V. Abetz, J. Membr. Sci., 2012, 403–404, 101–109 CrossRef CAS.
- P. Daraei, S. S. Madaeni, N. Ghaemi, H. Ahmadi Monfared and M. A. Khadivi, Sep. Purif. Technol., 2013, 104, 32–44 CrossRef CAS.
- C. Nie, L. Ma, Y. Xia, C. He, J. Deng, L. Wang, C. Cheng, S. Sun and C. Zhao, J. Membr. Sci., 2015, 475, 455–468 CrossRef CAS.
- K. H. Chan, E. T. Wong, M. I. Khan, A. Idris and N. M. Yusof, J. Ind. Eng. Chem., 2014, 20, 3744–3753 CrossRef CAS.
- K. Rechendorff, M. B. Hovgaard, M. Foss, V. P. Zhdanov and F. Besenbacher, Langmuir, 2006, 22, 10885–10888 CrossRef CAS PubMed.
- J. Ma, Y. Zhao, Z. Xu, C. Min, B. Zhou, Y. Li, B. Li and J. Niu, Desalination, 2013, 320, 1–9 CrossRef CAS.
- A. Rahimpour, M. Jahanshahi, S. Khalili, A. Mollahosseini, A. Zirepour and B. Rajaeian, Desalination, 2012, 286, 99–107 CrossRef CAS.
- M. Irfan, A. Idris, N. M. Yusof, N. F. M. Khairuddin and H. Akhmal, J. Membr. Sci., 2014, 467, 73–84 CrossRef CAS.
- S. Xia and M. Ni, J. Membr. Sci., 2015, 473, 54–62 CrossRef CAS.
- J. Zhang, Z. Xu, M. Shan, B. Zhou, Y. Li, B. Li, J. Niu and X. Qian, J. Membr. Sci., 2013, 448, 81–92 CrossRef CAS.
- M. Namvar-Mahboub and M. Pakizeh, Sep. Purif. Technol., 2013, 119, 35–45 CrossRef CAS.
- A. Urbani, V. Sirolli, S. Lupisella, S. Levi-Mortera, B. Pavone, L. Pieroni, L. Amoroso, R. Di Vito, S. Bucci, S. Bernardini, P. Sacchetta and M. Bonomini, J. Blood Transfus., 2012, 10(2), s101–112 Search PubMed.
- L. Ma, B. Su, C. Cheng, Z. Yin, H. Qin, J. Zhao, S. Sun and C. Zhao, J. Membr. Sci., 2014, 470, 90–101 CrossRef CAS.
- S. L. Hirsh, D. R. McKenzie, N. J. Nosworthy, J. A. Denman, O. U. Sezerman and M. M. M. Bilek, Colloids Surf., B, 2013, 103, 395–404 CrossRef CAS PubMed.
- E. F. Leonard and L. Vroman, J. Biomater. Sci., Polym. Ed., 1992, 3, 95–107 CrossRef.
- M. Rabe, D. Verdes and S. Seeger, Adv. Colloid Interface Sci., 2011, 162, 87–106 CrossRef CAS PubMed.
- Z. Adamczyk, Curr. Opin. Colloid Interface Sci., 2012, 17, 173–186 CrossRef CAS.
- I. H. Jaffer, J. C. Fredenburgh, J. Hirsh and J. I. Weitz, J. Thromb. Haemostasis, 2015, 13, S72–S81 CrossRef PubMed.
- A. Venault, M. R. B. Ballad, Y.-H. Liu, P. Aimar and Y. Chang, J. Membr. Sci., 2015, 477, 101–114 CrossRef CAS.
- R. A. Latour, Encyclopedia of Biomaterials and Biomedical Engineering, Taylor & Francis, 2013, pp. 1–15 Search PubMed.
- V. Vatanpour, S. S. Madaeni, R. Moradian, S. Zinadini and B. Astinchap, J. Membr. Sci., 2011, 375, 284–294 CrossRef CAS.
- L.-P. Zhu, J.-H. Jiang, B.-K. Zhu and Y.-Y. Xu, Colloids Surf., B, 2011, 86, 111–118 CrossRef CAS PubMed.
- C. Cheng, S. Nie, S. Li, H. Peng, H. Yang, L. Ma, S. Sun and C. Zhao, J. Mater. Chem. B, 2013, 1, 265–275 RSC.
- L. E. Corum and V. Hlady, Biomaterials, 2012, 33, 1255–1260 CrossRef CAS PubMed.
- X.-J. Huang, D. Guduru, Z.-K. Xu, J. Vienken and T. Groth, Macromol. Biosci., 2011, 11, 131–140 CrossRef CAS PubMed.
- W.-W. Yue, H.-J. Li, T. Xiang, H. Qin, S.-D. Sun and C.-S. Zhao, J. Membr. Sci., 2013, 446, 79–91 CrossRef CAS.
- F. Ran, S. Nie, W. Zhao, J. Li, B. Su, S. Sun and C. Zhao, Acta Biomater., 2011, 7, 3370–3381 CrossRef CAS PubMed.
- K. François, K. M. Wissing, R. Jacobs, D. Boone, K. Jacobs and C. Tielemans, BMC Nephrol., 2014, 15, 104 CrossRef PubMed , (7 pp).
- H. Zare-Zardini, A. Amiri, M. Shanbedi, A. Taheri-Kafrani, S. N. Kazi, B. T. Chew and A. Razmjou, J. Biomed. Mater. Res., Part A, 2015, 103, 2959–2965 CrossRef CAS PubMed.
- G. J. Dahe, R. S. Teotia, S. S. Kadam and J. R. Bellare, Biomaterials, 2011, 32, 352–365 CrossRef CAS PubMed.
- Surface Coating and Modification of Metallic Biomaterials, ed. C. Wen, Elsevier Science, 2015 Search PubMed.
- M. T. Byrne and Y. K. Gun'ko, Adv. Mater., 2010, 22, 1672–1688 CrossRef CAS PubMed.
- S. Subianto, M. Pica, M. Casciola, P. Cojocaru, L. Merlo, G. Hards and D. J. Jones, J. Power Sources, 2013, 233, 216–230 CrossRef CAS.
- Y. Wang, R. Ou, Q. Ge, H. Wang and T. Xu, Desalination, 2013, 330, 70–78 CrossRef CAS.
- J. Zhang, Z. Xu, W. Mai, C. Min, B. Zhou, M. Shan, Y. Li, C. Yang, Z. Wang and X. Qian, J. Mater. Chem. A, 2013, 1, 3101–3111 CAS.
- C. Ye, Q. Gong, F. Lu and J. Liang, Sep. Purif. Technol., 2007, 58, 2–6 CrossRef CAS.
- M. S. L. Tijink, M. Wester, G. Glorieux, K. G. F. Gerritsen, J. Sun, P. C. Swart, Z. Borneman, M. Wessling, R. Vanholder, J. A. Joles and D. Stamatialis, Biomaterials, 2013, 34, 7819–7828 CrossRef CAS PubMed.
- S. C. Palmer, K. S. Rabindranath, J. C. Craig, P. J. Roderick, F. Locatelli and G. F. M. Strippoli, Cochrane database Syst. Rev., 2012, vol. 9, p. 118, CD005016 Search PubMed.
- F. M. C. D. GmbH, 2015, http://www.highvolumehdf.com/products-features.html.
- M. Bély, P. Kapp, T. S. Szabó, T. Lakatos and Á. Apáthy, Ultrastruct. Pathol., 2009, 29, 483–491 CrossRef PubMed.
- T. L. Sirich, F. J.-G. Luo, N. S. Plummer, T. H. Hostetter and T. W. Meyer, Nephrol., Dial., Transplant., 2012, 27, 1574–1579 CrossRef CAS PubMed.
Footnote |
| † Electronic supplementary information (ESI) available. See DOI: 10.1039/c6ra09354j |
| This journal is © The Royal Society of Chemistry 2016 |

