Facile fabrication and enhanced visible-light photocatalytic activity of In2O3/Ag2CrO4 composites
Jin Luo*,
Xiaosong Zhou,
Lin Ma,
Xuyao Xu,
Huiting Ruan and
Zhibin Zhang
School of Chemistry and Chemical Engineering, Institute of Physical Chemistry, Development Center for New Materials Engineering & Technology in Universities of Guangdong, Lingnan Normal University, Zhanjiang 524048, China. E-mail: lj328520504@126.com; Fax: +86-759-3183205; Tel: +86-759-3183205
First published on 25th May 2016
Abstract
A series of visible-light-driven In2O3/Ag2CrO4 composites were fabricated by a facile chemical precipitation method and characterized by scanning electron microscopy (SEM), high-resolution transmission electron microscopy (HRTEM), X-ray diffraction (XRD), X-ray photoelectron spectroscopy (XPS), UV-vis diffuse reflectance spectroscopy (UV-vis DRS) and photoluminescence (PL) spectroscopy. The In2O3/Ag2CrO4 composites showed much higher photocatalytic activity and stability than those of individual Ag2CrO4 and In2O3 for the photodegradation of methyl orange (MO) under visible light irradiation (λ > 420 nm). Excitingly, the optimum degradation rate constant of the In2O3/Ag2CrO4 composite at a weight content of 4.0% In2O3 for the degradation of MO was 8.8 and 3.3 times as high as that of individual In2O3 and Ag2CrO4, respectively. The enhancement in photocatalytic activity and stability was predominantly attributed to the effective separation and transfer of photogenerated charge carriers as a result of the formation of a Z-scheme system composed of In2O3, Ag and Ag2CrO4. Furthermore, radical trap experiments depicted that both the holes and superoxide radical anions are main oxidative species of the In2O3/Ag2CrO4 composite for MO degradation under visible light irradiation. Finally, based on the experimental results, a possible photocatalytic mechanism has been proposed.
Introduction
With the increasing aggravation of the energy dilemma and environmental issues, semiconductor photocatalysis has been regarded as one of the most promising strategies for dealing with current environmental pollutants and energy problems through photocatalytic water splitting to produce hydrogen and degradation of organic pollutants into CO2 and H2O with abundant solar light.1 Up to now, an increasingly large number of photocatalysts including TiO2, ZnO, WO3, CdS, Ag3VO4, Bi2WO6, Bi2MoO6, ZnWO4, SrTiO3, BiOX (X = Cl, Br, I) and more, have been intensively investigated.2 Among them, it is well known that TiO2 has excellent photocatalytic activity and stability under ultraviolet light irradiation. Unfortunately, it can only be activated under ultraviolet light irradiation due to its relatively large band gap (approximately 3.2 eV).3 It is noted that the ultraviolet region occupies only approximately 4% of the entire solar spectrum, while about 43% of the energy belongs to the visible light.4 Consequently, in order to utilize solar energy more efficiently in the photocatalytic processes, numerous attempts have been strived to the development of visible-light-driven photocatalysts, such as graphitic carbon nitride,5 Ag-based photocatalysts,6 Bi-based photocatalysts,7 etc. Among them, silver chromate (Ag2CrO4), as a novel high-efficiency visible-light-driven photocatalyst, has been recognized as one of the most promising photocatalysts for the degradation of organic pollutants under visible light irradiation due to its strong absorption in visible-light region, unique electronic structure and crystal structure.8 Specially, the valence band position of Ag2CrO4 is raised by the hybridization of Ag 4d and O 2p orbital, and the conduction band position is lowered by Cr element, leading to a narrow band gap of approximately 1.8 eV. Additionally, the crystal structure of Ag2CrO4 is beneficial to effectively facilitate the migration of photogenerated electrons and holes due to its long Ag–O bond length and big O–Ag–O bond angle of AgO6 octahedron.9 Nevertheless, similar to other silver-based photocatalysts, Ag2CrO4 greatly suffers from poor stability during the photocatalytic reactions, because it is photosensitive and slightly soluble in aqueous solution.10 As a consequence, it is highly desirable to explore effective strategies to inhibit the photocorrosion of Ag2CrO4 for better stability and activity.Fortunately, combining Ag2CrO4 with other semiconductors with matching band potential to design Ag2CrO4-based composites, such as AgBr/Ag2CrO4,10 ZnO/Ag2CrO4,11 ZnO/Ag3VO4/Ag2CrO4,12 C3N4/Fe3O4/Ag2CrO4,13 ZnO/AgBr/Ag2CrO4,14 GO/Ag2CrO4,9b has proven to be an effective strategy for improving the photocatalytic activity and stability of Ag2CrO4 under visible light irradiation, because matching band potentials of the two components is contributed to the separation of photogenerated electron–hole pairs, prolonging the lifetime of charge carriers, further resulting in the improvement of photocatalytic activity and stability to some degree. Furthermore, In2O3, as an important n-type semiconductor with a direct band gap of about 3.6 eV and indirect band gap of about 2.8 eV, has proved to be an efficient sensitizer to extend the absorption spectra of oxide semiconductor photocatalysts from the ultraviolet region into the visible region.15 Nonetheless, to the best of our knowledge, there is still no report on the study of In2O3/Ag2CrO4 composites as an effective visible-light-driven photocatalysts by far. Excitingly, by comparing the energy band positions of Ag2CrO4 with In2O3, it is fortunately to find that their well-matched energy band structures are suitable to separate and transfer of photogenerated charge carriers, and thus enhance photocatalytic activity.
In this work, a facile chemical precipitation method has been successfully developed to synthesize novel In2O3/Ag2CrO4 composites with different content of In2O3 at room temperature without using any surfactants. The photocatalytic activity and stability of the as-prepared samples were evaluated in the photocatalytic degradation of methyl orange (MO) organic dye in an aqueous solution under visible light irradiation (λ > 420 nm). The results demonstrated that the introduction of In2O3 can remarkably improve the photocatalytic activity of Ag2CrO4. The enhanced activity was mainly attributed to the intimate interfacial contact and the matched energy band structures between Ag2CrO4 and In2O3, which effectively improved the separation and transfer of photogenerated charge carriers as a result of the formation of a Z-scheme system composed of In2O3, Ag and Ag2CrO4. Furthermore, according to the results of trapping experiments, the hole (h+) and superoxide free radical (˙O2−) were the main active species in the process of photocatalytic degradation of MO. Finally, a tentative transferred and separated behaviors of photoinduced charge carriers and the photocatalytic mechanisms was proposed based on the band structures of Ag2CrO4 and In2O3 and obtained experimental results. The present work may provide a new insight for the smart design and synthesis of various highly efficient visible-light-driven photocatalysts for environmental and energy applications.
Experimental
Catalysts preparation
In2O3 nanoparticles were prepared by a facile one-pot method by directly heating In(NO3)3·4.5H2O at 500 °C in a muffle furnace for 4 h in a semiclosed system at a heating rate of 20 °C min−1 under air condition. The product was washed several times with distilled water and absolute ethanol and dried at 80 °C for 12 h.In2O3/Ag2CrO4 composites were fabricated by a facile in situ chemical precipitation method under the dark condition. Typically, first of all, a certain amount of the as-prepared In2O3 samples (13.5 mg, 27.6 mg and 57.7 mg) were sonicated thoroughly into 30 mL distilled water for 30 min. Then, 4 mmol AgNO3 was added into the dispersion of In2O3 under the vigorous stirring. After stirring for 30 min, 2 mmol K2CrO4 dissolved in 20 mL distilled water was added dropwise into the dispersion with constant stirring, and the mixture was further vigorously stirred at room temperature for 4 h. Finally, the precipitate was collected by centrifugation, washed several times with distilled water and absolute ethanol, and dried at 55 °C in a vacuum oven for 24 h. The obtained products were denoted as In2O3(x)/Ag2CrO4, where x% stands for the theoretical mass percent of In2O3 in the In2O3/Ag2CrO4 composites. That is to say, the as-prepared samples were also accordingly denoted as In2O3 (2.0 wt%)/Ag2CrO4, In2O3 (4.0 wt%)/Ag2CrO4 and In2O3 (8.0 wt%)/Ag2CrO4. Moreover, for comparison, pure Ag2CrO4 nanoparticles were prepared following the similar procedure mentioned above in the absence of In2O3.
Catalysts characterization
X-ray diffraction (XRD) patterns of the as-prepared samples were recorded on an X-ray diffractometer (D/max-IIIA, Japan) using Cu Kα radiation. The surface morphology of as-prepared samples was examined by a scanning electron microscopy (SEM) (LEO1530VP, LEO Company) and a high-resolution transmission electron microscope (HRTEM, JEOL, JEM2100). The UV-vis light absorption spectra of as-prepared samples were obtained from a Hitachi UV-3010 spectrophotometer equipped with an integrating sphere assembly and using the diffuse reflection method and BaSO4 as a reference to measure all the samples. The each of the chemical nature elements in the In2O3/Ag2CrO4 has been studied using X-ray photoelectron spectroscopy (XPS) in Krato Axis Ultra DLD spectrometer. The binding energy was referenced to C 1s line at 284.6 eV for calibration. Photoluminescence (PL) spectra were measured on an F-7000 Fluorescence spectrophotometer (Hitachi, Japan).Photocatalytic tests of catalysts
The photocatalytic performance of the as-prepared samples was evaluated through the photodegradation of MO under visible light. A 300 W Xe-arc lamp equipped with a 420 nm cutoff filter was used as a visible light source. In a typical photocatalytic measurement, suspension including the photocatalyst (50 mg) and MO solution (150 mL, 10 mg L−1) was laid in a 250 mL cylindrical quartz reactor equipped with a water circulation facility. Before irradiation, the reaction suspension was ultrasonicated for 5 min and stirred in the dark for 60 min to ensure the equilibrium of adsorption and desorption. During the photocatalytic tests, 5 mL of the suspension was obtained at a given time intervals, followed by centrifugation at 10![[thin space (1/6-em)]](https://www.rsc.org/images/entities/char_2009.gif) 000 rpm for 10 min to remove the photocatalyst. The concentration of the remaining MO was measured by its absorbance (A) at 465 nm with a Hitachi UV-3010 spectrophotometer. The degradation ratio of MO can be calculated by X = (A0 − At)/A0 × 100%, where A0 and At are the concentration of MO before illumination and after illumination time t.
000 rpm for 10 min to remove the photocatalyst. The concentration of the remaining MO was measured by its absorbance (A) at 465 nm with a Hitachi UV-3010 spectrophotometer. The degradation ratio of MO can be calculated by X = (A0 − At)/A0 × 100%, where A0 and At are the concentration of MO before illumination and after illumination time t.
Results and discussion
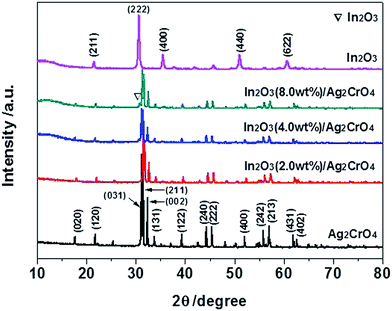
To identify the crystal structure and phase composition of the as-prepared samples, X-ray diffraction (XRD) analyses were carried out. Fig. 1 displays the XRD patterns of the In2O3/Ag2CrO4 composites with different weight ratios of In2O3, together with those of pure Ag2CrO4 and In2O3. It can be seen that all of the diffraction peaks are narrow and sharp, indicated that all the as-prepared samples are good crystallinity. Pure Ag2CrO4 shows fourteen distinct diffraction peaks at 2θ = 17.62°, 21.73°, 31.14°, 31.43°, 32.30°, 33.71°, 39.26°, 44.26°, 45.40°, 52.07°, 55.84°, 57.07°, 61.93° and 62.60°, which can be perfectly indexed to the (020), (120), (031), (211), (002), (131), (122), (240), (222), (400), (242), (213), (431) and (402) crystal planes of the orthorhombic Ag2CrO4 (JCPDS Card no. 26-0952).8a,16 On the other hand, pure In2O3 shows five distinct diffraction peaks at 2θ = 21.50°, 30.58°, 35.47°, 51.04° and 60.68°, which can be perfectly indexed to the (211), (222), (400), (440) and (622) crystal planes of the cubic In2O3 (JCPDS Card no. 06-0416).15c,17 Although the characteristic peaks of In2O3 is not observed from the In2O3 (2.0 wt%)/Ag2CrO4 and In2O3 (4.0 wt%)/Ag2CrO4 samples, which may be due to the relatively low amounts of In2O3, the position of the diffraction peak at 2θ = 30.58° of In2O3 is visible for the In2O3 (8.0 wt%)/Ag2CrO4 sample, as a result of the higher In2O3 content. It was worthwhile to note that no impurities peaks are detected in the XRD patterns, suggesting that the as-prepared samples are all pure phase. Hence, it is confirmed the In2O3/Ag2CrO4 composites are composed of In2O3 and Ag2CrO4.The morphologies of pure Ag2CrO4, In2O3 and In2O3 (4.0 wt%)/Ag2CrO4 composite were investigated by scanning electron microscopy (SEM) observation, and the results are showed in Fig. 2. It can be seen from Fig. 2a that the morphology of pure Ag2CrO4 is composed of stacked particle-like nanostructures with smooth surfaces. Fig. 2b is an image of single In2O3, which consists of small and irregular agglomerates of particles. The SEM image of In2O3 (4.0 wt%)/Ag2CrO4 composite was presented in Fig. 2c, and it can be clearly seen that In2O3 particles are tightly attached and well dispersed on the surface of Ag2CrO4, resulting in the intimate contact between In2O3 and Ag2CrO4, which was beneficial to facilitate the transfer of photogenerated charge carriers and thus improve the photocatalytic activity. It can be confirmed further by the elemental mapping images of In2O3 (4.0 wt%)/Ag2CrO4 composite. As shown in Fig. 2g and h, the In and O elements are homogeneously distributed in the whole host of In2O3 (4.0 wt%)/Ag2CrO4 composite, indicating that In2O3 was not only successfully combined with Ag2CrO4, but also well dispersed on the surface of Ag2CrO4. In order to further illuminate the formation of In2O3/Ag2CrO4 composite, which was characterized by high-resolution TEM (HRTEM). Obviously, the junction displayed two types of clear lattice fringes as depicted in Fig. 2d, one set of the clear fringes spacing was ca. 0.29 nm, corresponding to the (222) lattice spacing of the cubic phase of In2O3.18 Another set of the clear fringes spacing measures ca. 0.28 nm, which corresponded to the (211) lattice plane of orthorhombic phase Ag2CrO4.8a These results confirmed that the heterojunctions were well-formed between In2O3 and Ag2CrO4. Furthermore, in order to investigate elemental composition of as-synthesized samples, the energy dispersive X-ray spectrum (EDS) was further measured, which can be seen in Fig. 2i. It can be unambiguously seen that the coexistence of In, O, Ag and Cr elements and no other element or impurity found in the fabricated sample, demonstrating that the as-prepare In2O3/Ag2CrO4 composites was only composed of both In2O3 and Ag2CrO4.
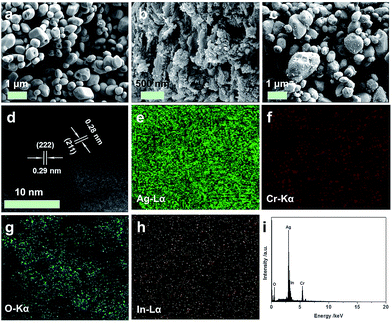 | ||
| Fig. 2 SEM (a–c) images of Ag2CrO4 (a), In2O3 (b) and In2O3 (4.0 wt%)/Ag2CrO4 (c), and HRTEM image (d), elemental mapping images (e–h) and EDS (i) of In2O3 (4.0 wt%)/Ag2CrO4 composite. | ||
The elemental compositions and chemical states of the In2O3 (4.0 wt%)/Ag2CrO4 composite were further analyzed by X-ray photoelectron spectroscopy (XPS), and the results are displayed in Fig. 3. The fully scanned XPS spectrum (Fig. 3a) showed that elements In, O, Ag, Cr and C existed in the In2O3 (4.0 wt%)/Ag2CrO4 composite, which is consistent with chemical composition of the In2O3 (4.0 wt%)/Ag2CrO4 photocatalyst. It is noted that the C element could be ascribed to the adventitious carbon-based contaminant, and the binding energy for C 1s peak at 284.6 eV was used as the reference for calibration. The high-resolution XPS spectra of C 1s, O 1s, In 3d, Ag 3d and Cr 2p peaks for In2O3 (4.0 wt%)/Ag2CrO4 composite are represented in Fig. 3b–f. For the C 1s, the main peak located at 284.6 eV is usually assigned to adventitious carbon, while another weak peak positioned at 285.6 eV is corresponded to the C–OH bonding.15b,19 For the O 1s, the peak at 529.7 eV is attributed to the oxygen species in the In–O–In of In2O3, while another peak of 531.4 eV is ascribed to the lattice oxygen, which is related to the Cr–O chemical bonding in the Ag2CrO4.8a,20 For the In 3d, the two peaks located at 444.3 eV and 451.9 eV are attributed to In 3d5/2 and In 3d3/2, respectively,8b,20a which is the characteristic of In3+ species for In2O3. For the Ag 3d, the two peaks located at 367.5 eV and 373.5 eV are attributed to Ag 3d5/2 and Ag 3d3/2, respectively,8a,21 suggesting the presence of Ag+ species for Ag2CrO4. No peak is observed at 368.4 or 374.4 eV, demonstrating that no Ag0 is formed during the preparation.9b,22 For the Cr 2p, the two peaks located at 578.4 eV and 587.6 eV are attributed to Cr 2p3/2 and Cr 2p1/2, respectively,23 demonstrating the presence of Cr6+ species for Ag2CrO4. Consequently, the above XRD, EDS and XPS results distinctly confirm the coexistence of In2O3 and Ag2CrO4 in the as-prepared In2O3/Ag2CrO4 composites.
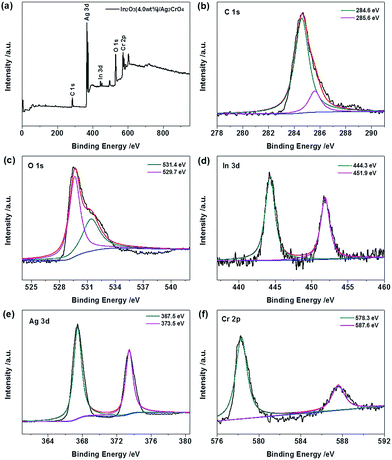 | ||
| Fig. 3 XPS spectra of In2O3 (4.0 wt%)/Ag2CrO4 composite: (a) survey scan, (b) C 1s, (c) O 1s, (d) In 3d, (e) Ag 3d and (f) Cr 2p. | ||
It is well known that the photocatalytic activity of the photocatalysts is closely related to their light absorption ability, thus UV-vis diffuse reflectance spectroscopy (UV-vis DRS) is employed to determine the optical absorption properties of the pure Ag2CrO4, In2O3 and In2O3/Ag2CrO4 composites, and the results are represented in Fig. 4. As can be seen from Fig. 4a, the pure In2O3 shows photoabsorption from ultraviolet light to visible light, with an absorption edge of around 470 nm. On the other hand, the pure Ag2CrO4 presents photoabsorption from ultraviolet light to visible light, with an absorption edge of around 720 nm, presented light-absorbing abilities nearly in the entire visible light region. Interestingly, it can be observed that there is a clear red-shift of the absorption of the In2O3/Ag2CrO4 composites in comparison with that of pure Ag2CrO4. All the In2O3/Ag2CrO4 composites show strong and broader absorption in the visible-light region, and the ability of light absorption and the absorption intensity of the In2O3/Ag2CrO4 composites increase with increasing In2O3 content. It can be attributed to the heterojunction formed between In2O3 and Ag2CrO4 had changed the optical properties of the photocatalysts due to the synergetic effect between In2O3 and Ag2CrO4, which decreased the contact barrier, enhanced the electronic coupling of two semiconductors, improved absorption of heterojunctions at long wavelengths and thus resulted in the generation of more photogenerated electron–hole pairs under visible light irradiation, which subsequently leads to a higher photocatalytic activity. It is similar to the previous reported AgCl/Ag2CO3, g-C3N4/Ag2CO3, ZrO2/g-C3N4 and BiPO4/g-C3N4 heterojunction photocatalysts.24 These results implied that the In2O3/Ag2CrO4 composite has the potential to be efficient visible light-driven photocatalyst. Additionally, based on the theory of optical absorption for direct band gap semiconductors, the band gap energy of the as-prepared samples can be calculated through the equation: αhν = A(hν − Eg)n/2, where A, α, ν, Eg and h are a constant, absorption coefficient, light frequency, band gap energy and Planck constant, respectively.25 For the value of n, it was determined by the type of optical transition of semiconductors (n = 1 for direct transition and n = 4 for indirect transition). As previous literatures reported, here the value of n is 1 and 4 for In2O3,20b and Ag2CrO4,8a respectively. Accordingly, as shown in Fig. 4b, the Eg of In2O3 is estimated to about 2.62 eV according to a plot of (αhν)2 versus energy (hν), while the Eg of Ag2CrO4 is estimated to about 1.72 eV according to a plot of (αhν)1/2 versus energy (hν).
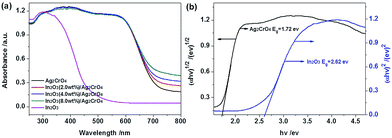 | ||
| Fig. 4 UV-vis DRS (a) of the as-prepared samples, and plots of (αhν)1/2 and (αhν)2 versus energy (b) for the band gap energy of Ag2CrO4 and In2O3, respectively. | ||
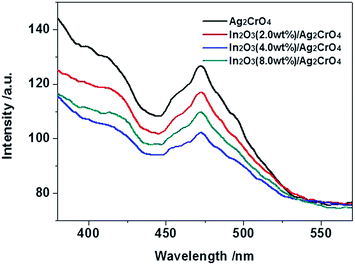
The photoluminescence (PL) emission spectrum is usually employed to investigate the separation and transfer efficiency of the photogenerated electron–hole pairs during photocatalytic process.24d,26 It is well acknowledged that the stronger PL intensity indicates the faster recombination speed of photogenerated charge carriers, implying that the fewer photoinduced electrons and holes took part in the photocatalytic oxidation and reduction reactions, resulting in the lower photocatalytic activity.27 Fig. 5 exhibits the PL spectra of the as-prepared samples under the excitation wavelength of 300 nm. Obviously, Ag2CrO4 shows higher PL intensity than other samples, indicates Ag2CrO4 has the highest electrons and holes recombination rate that deteriorated the photodegradation efficiency. However, in the PL spectra of In2O3/Ag2CrO4 composites, a considerable fluorescence quenching in the same position is detected, indicating that the addition of In2O3 significantly inhibited the recombination of photogenerated electrons and holes, leading to superior separation efficiency of photogenerated electrons and holes and better photocatalytic activity. Consequently, the synergetic interaction between In2O3 and Ag2CrO4 in the In2O3/Ag2CrO4 composite contributed to the efficient separation and extending lifetime of photogenerated charge carriers and further improving the photodegradation efficiency. However, over-loading In2O3 species increased the recombination rate of photogenerated charge carriers, leading to inferior photodegradation efficiency, arising from the excess In2O3 species may act as a recombination centre and thereby reducing the efficiency of charge separation.
To compare the photocatalytic activities of Ag2CrO4 before and after coupling with In2O3, a series of photocatalytic degradation experiments were performed using methyl orange (MO) as a model pollutant under the visible light irradiation (λ > 420 nm) without using any sacrificial reagent at room temperature, and the results are represented in Fig. 6. As shown in Fig. 6a, it can be clearly seen that the self-photolysis of MO without any photocatalyst can be neglected under the light irradiation for 120 min. It should be pointed out that pure Ag2CrO4 shows higher photocatalytic activity than that of pure In2O3, which is attributed to the stronger visible light absorption and the proper band edge potential of Ag2CrO4. Significantly, the In2O3/Ag2CrO4 composites exhibit much higher photocatalytic activities for photodegrading MO than that of pure Ag2CrO4 after 120 min of visible light irradiation, indicating that combining Ag2CrO4 and In2O3 is an efficient route to enhance the photocatalytic performance of Ag2CrO4. Concretely, the photocatalytic activity of In2O3/Ag2CrO4 composite initially increases with the increase of In2O3 loading on the surface of Ag2CrO4, and then it decreases with the further increase of In2O3 amount. Among all of the samples, it obviously can be seen that the In2O3 (4.0 wt%)/Ag2CrO4 composite exhibits the highest photocatalytic activity, whose photodegradation activity is 6.7 and 2.6 times as high as that of pure In2O3 and Ag2CrO4, respectively. Nevertheless, a further increase in the amount of In2O3 results in a decrease in the photodegradation activity under the same conditions, but it is still much superior compared to the photocatalytic activity of pure Ag2CrO4. These results clearly indicated that an appropriate content of In2O3 is crucial to achieve optimal photocatalytic performance, which is attributed to the following probable reasons: firstly, the introduction of In2O3 can effectively enhanced visible light absorption, widened optical absorption range and thus resulted in the generation of more photogenerated electron–hole pairs under visible light irradiation, and it can be confirmed from the above-mentioned UV-vis DRS results. Secondly, a suitable content of In2O3 can form a good dispersion on the surface of Ag2CrO4, which effectively favored the separation and transfer of the photogenerated charge carriers, and it can be confirmed from the above-mentioned PL results. Thirdly, excessive In2O3 may act as a recombination centre, and cover the active sites on the Ag2CrO4 surface, leading to reducing the efficiency of the photogenerated charge carriers, and it can be confirmed from the above-mentioned PL results.
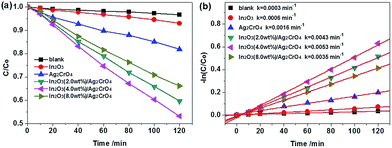 | ||
| Fig. 6 Photocatalytic activities (a) and first-order kinetic plots (b) for the photodegradation of MO in aqueous solution over the as-prepared samples under visible light irradiation. | ||
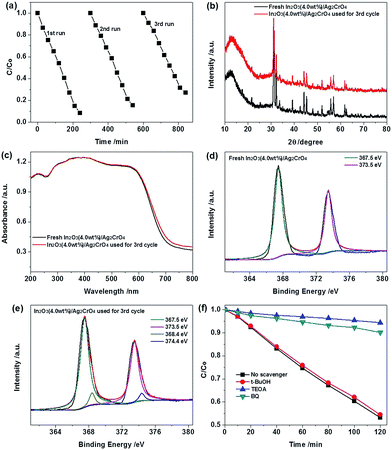
In order to comprehend the process of the photocatalytic reaction, the photocatalytic degradation kinetics of MO in the case of the as-prepared samples were investigated, and the experimental data were fitted by applying a first-order model as expressed by the formula: −ln(C/Co) = kt. Where Co is the equilibrium concentration of MO after 60 min dark adsorption, C is the MO concentration remaining in the solution at the irradiation time, t is the irradiation time and k is the apparent first-order rate constant.28 Fig. 6b shows a linear relationship between −ln(C/Co) and the irradiation time for the degradation of MO. As can be seen from Fig. 6b, the photocatalytic degradation curves for all samples fit well with pseudo-first-order kinetics, indicating that the photodegradation MO process followed a pseudo-first-order reaction. Furthermore, the degradation rate constant (k) for MO with In2O3, Ag2CrO4, In2O3 (2.0 wt%)/Ag2CrO4, In2O3 (4.0 wt%)/Ag2CrO4 and In2O3 (8.0 wt%)/Ag2CrO4 were estimated to be 0.0006 min−1, 0.0016 min−1, 0.0043 min−1, 0.0053 min−1 and 0.0035 min−1, respectively. It is worth mentioning that the MO degradation rate constants of the In2O3/Ag2CrO4 composites are larger than that of Ag2CrO4 and In2O3, and the largest degradation rate constant of the In2O3 (4.0 wt%)/Ag2CrO4 composite is 3.3 times higher than that of pure Ag2CrO4 and 8.8 times as high as that of pure In2O3 under the same experimental conditions, clearly demonstrating that the introduction of In2O3 could efficiently enhance the photocatalytic activity of Ag2CrO4 under the visible light irradiation. According to the above-mentioned DRS and PL results, it is attributed predominantly to widening optical absorption range, enhancing optical absorption intensity and improving photogenerated electrons and holes separation and migration efficiency because of the intimate interfacial contact and the matched energy band structures between Ag2CrO4 and In2O3. Consequently, the In2O3 (4.0 wt%)/Ag2CrO4 composite photocatalyst is the best performing sample and is selected for the following recycling experiments. It is noted that although the In2O3 (4.0 wt%)/Ag2CrO4 composite exhibited the highest photocatalytic activity, its degradation efficiency was still relatively weak. Thus we prolonged the visible light irradiation time to further improve the photodegradation efficiency of MO over In2O3 (4.0 wt%)/Ag2CrO4 photocatalyst. As shown in Fig. 7a, it could be observed that almost 92% of MO was degraded by the In2O3 (4.0 wt%)/Ag2CrO4 composite photocatalyst after 240 min of visible light irradiation, indicating that the as-prepared In2O3/Ag2CrO4 composite had good photocatalytic performance for MO degradation under the visible light irradiation.
Besides photocatalytic activity, the stability and reusability of the photocatalyst are of crucial significance for its further practical application. To evaluate the stability and reusability of the In2O3 (4.0 wt%)/Ag2CrO4 photocatalyst, we carried out recycling experiments under identical conditions. After each run, the recycled catalyst was separated from the aqueous suspension by centrifugation, repeatedly washed by deionized water and ethanol and dried in vacuum at 55 °C for 24 h. As can be seen from Fig. 7a, the photodegradation of MO in every cycling runs, and there was slight catalyst deactivation in the third run, but the photocatalytic activity of the In2O3 (4.0 wt%)/Ag2CrO4 photocatalyst was retained at over 79% of its original activity after three successive experimental runs, arising from the slight loss of photocatalyst during the recovery steps and a small amount of Ag2CrO4 in the composite were inevitably reduced into metallic Ag by the photogenerated electrons during the MO degradation process. It is known that Ag2CrO4 is easily photocorroded by the photogenerated electrons and decomposed to weakly active metallic Ag, leading to the inferior stability. As a consequence, in order to further elucidate the Ag state changes of In2O3 (4.0 wt%)/Ag2CrO4 after the third successive experimental runs, XRD, UV-vis DRS and XPS analysis were carried out. As shown in Fig. 7b, it can be seen that the XRD pattern of the In2O3 (4.0 wt%)/Ag2CrO4 composite has no appreciable change after three cycles. It is noteworthy that there was no a new weak peak located at 2θ = 38.1° corresponding to the (111) plane diffraction of Ag (JCPDS Card no. 89-3722),29 it may be attributed to the relatively low amount of Ag. It can be seen from Fig. 7c, the slightly enhanced absorption intensity of used In2O3 (4.0 wt%)/Ag2CrO4 after 3 recycling runs in the range of 600–800 nm in comparison with fresh In2O3 (4.0 wt%)/Ag2CrO4, suggesting that a small amount of Ag2CrO4 has decomposed to metallic Ag. On the other side, as illustrated in Fig. 7d and e, compared to fresh In2O3 (4.0 wt%)/Ag2CrO4, the Ag 3d peaks of used In2O3 (4.0 wt%)/Ag2CrO4 displayed two new and very weak peaks at about 368.4 eV and 374.4 eV corresponding to Ag 3d5/2 and Ag 3d3/2, respectively, which belong to the Ag0.9b,22 The XPS results further confirm the existence of tiny Ag0 in the used In2O3 (4.0 wt%)/Ag2CrO4 sample, it can be inferred that the tiny Ag0 nanoparticles have been formed on the surface of the In2O3 (4.0 wt%)/Ag2CrO4 composite during the MO degradation process and could serve as excellent acceptors to trap for photogenerated electrons, which effectively inhibited the further formation of more Ag0 nanoparticles during the photocatalysis and thereby preventing the photocorrosion of Ag2CrO4, it is similar to the previous reported Ag3PO4/TiO2/Fe3O4, AgBr/Ag2CO3, Co3O4/Ag3PO4 and Ag2CrO4–GO composite photocatalysts.9b,30 The results clearly demonstrated that the In2O3 nanoparticles loaded on the surface of Ag2CrO4 can effectively protect it from dissolution in the aqueous solution, which can significantly increase the structural stability of In2O3 (4.0 wt%)/Ag2CrO4 during the photocatalytic reaction. Consequently, the incorporation of In2O3 with Ag2CrO4 can not only enhance the visible light photocatalytic performance of Ag2CrO4, but also inhibit the photocorrosion of Ag2CrO4 in the photocatalytic process.
To disclose the role of reactive species responsible for photocatalytic degradation of MO over the In2O3 (4.0 wt%)/Ag2CrO4 composite, a serious of reactive species trapping experiments were performed under visible light irradiation and the results are shown in Fig. 7d. In this investigation, tert-butyl alcohol (t-BuOH), triethanolamine (TEOA) and 1,4-benzoquinone (BQ) are used as hydroxyl radical (˙OH), hole (h+) and superoxide radical (˙O2−) scavenger, respectively.9b,31 As illustrated in Fig. 7d, it can be clearly seen that the photocatalytic activity of the In2O3 (4.0 wt%)/Ag2CrO4 composite decreases significantly compared to that without scavengers after addition of TEOA or BQ, suggesting that h+ and ˙O2− are the predominant active species that participate in the photodegradation process. On the contrary, adding t-BuOH has little impact on the photocatalytic activity of the In2O3 (4.0 wt%)/Ag2CrO4 composite, meaning that ˙OH is not the main active species in In2O3 (4.0 wt%)/Ag2CrO4 photocatalytic systems.
It is well known that the position of conduction band (CB) and valence band (VB) of a semiconductor is one of the important factors that affect the photocatalytic activity. As a sequence, to fully understand the photocatalytic reaction mechanism occurring during the photodegradation of the as-prepared In2O3/Ag2CrO4 composites, the band edge positions of the valence band and conduction band of both Ag2CrO4 and In2O3 are necessary to be determined. Although it is difficult to determine the potentials by experiment, the potentials of the conduction band and valence band edges of both Ag2CrO4 and In2O3 can be obtained according to the Mulliken electronegativity theory:32 EVB = X − EC + 0.5Eg and ECB = EVB − Eg, where EVB and ECB are the valence band and conduction band edge potentials, respectively, X is the absolute electronegativity of the semiconductor, which is the geometric mean of the electronegativity of the constituent atoms. According to the previous reports, the values of X for Ag2CrO4 and In2O3 have been calculated as 5.86 eV (ref. 8a) and 5.28 eV,15c respectively. EC is the energy of free electrons on the hydrogen scale (about 4.5 eV vs. NHE) and Eg is the band gap of the semiconductor.33 Based on the result in the Fig. 4b, the band gap energies of Ag2CrO4 and In2O3 were estimated at 1.72 eV and 2.62 eV, respectively. Thus given the equations above, the VB and CB of Ag2CrO4 were calculated to be 2.22 eV and 0.50 eV, respectively. Similarly, the VB and CB of In2O3 were calculated to be 2.09 eV and −0.53 eV, respectively. It is obvious that the CB and VB edge potential positions of In2O3 is more negative than that of Ag2CrO4.
On the basis of the above-mentioned results and analysis, a plausible mechanism was proposed to explain the enhancement of the photocatalytic properties of the In2O3/Ag2CrO4 composites. As illustrated in Fig. 8, In2O3/Ag2CrO4 transforms to In2O3/Ag2CrO4@Ag in the early stage of the photocatalytic reaction because of the photosensation of In2O3/Ag2CrO4. The Ag0 nanoparticles at the interface of In2O3/Ag2CrO4 act as the charge separation center to form the visible-light-driven In2O3/Ag2CrO4 Z-scheme system. Moreover, both the CB bottom and the VB top of Ag2CrO4 lay below the CB bottom and VB top of In2O3, respectively. Under the irradiation of visible light, both Ag2CrO4 and In2O3 can be excited and generate the photoinduced electron–hole pairs, the photogenerated electrons in the CB of Ag2CrO4 could easily shift into Ag nanoparticles through the Schottky barrier because of the more positive Fermi energy of Ag than the CB level of Ag2CrO4. Simultaneously, the holes in the VB of In2O3 could also shift into Ag nanoparticles due to the more negative Fermi energy of Ag than the VB level of In2O3. In the photocatalytic process, Ag nanoparticles at the interface of In2O3/Ag2CrO4 can act as a recombination center for the electrons from the CB of Ag2CrO4 and holes from the VB of In2O3, inhibiting the electron–hole pairs recombination in both Ag2CrO4 and In2O3, and enhancing the interfacial charge transfer. In this way, the photogenerated electrons and holes can be efficiently separated, resulting in the recombination of photogenerated electron–hole pairs is remarkably hindered, which further leading to the enhanced photocatalytic activity. It can be confirmed by the above-mentioned PL results. Subsequently, the separated electrons accumulated on the CB of In2O3 can transfer to the surface and be annihilated by surface absorbed acceptors like O2 to produce ˙O2− due to the position (−0.53 eV) of CB of In2O3 is more negative than the standard redox potential of O2/˙O2− (−0.33 V vs. NHE).34 The produced ˙O2− can oxidize the MO to degradation products. Similarly, the separated holes accumulated on the VB of Ag2CrO4 can transfer to the surface and directly oxidize the MO to degradation products. This is consistent with above hole and free radical trapping experiment results, the MO degradation rate is decreased obviously in the presence of TEOA or BQ. It is noted that the photogenerated electrons in the CB of Ag2CrO4 cannot reduce dissolved O2 to produce ˙O2− through one-electron reduction due to the CB potential (0.50 eV) of Ag2CrO4 is more positive than the standard redox potential of O2/˙O2− (−0.33 V vs. NHE).34 Therefore, it can be concluded that the photocatalytic mechanism of In2O3/Ag2CrO4 composite is not in accordance with the traditional charge separation process but a typical Z-scheme charge transfer. A similar Z-scheme mechanism for AgI/Ag3PO4 and g-C3N4/Ag3PO4 composite photocatalysts have been reported.35
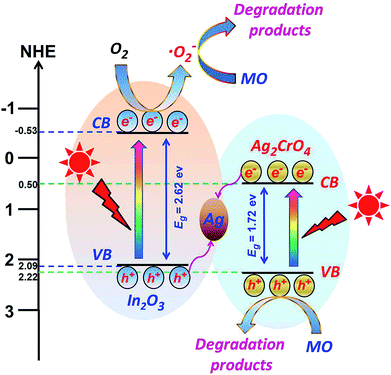 | ||
| Fig. 8 Schematic diagram of the photogenerated electron–hole pairs transfer pathway of the In2O3/Ag2CrO4 composite under visible light irradiation. | ||
Conclusions
In conclusion, the novel In2O3/Ag2CrO4 composites with different weight ratios of In2O3 have been fabricated by a facile chemical precipitation method. Under visible light irradiation, the as-prepared In2O3/Ag2CrO4 composite displayed enhanced photocatalytic activity and stability for the photocatalytic degradation of MO in comparison with the single In2O3 and Ag2CrO4. In particular, the optimum degradation rate constant of the In2O3/Ag2CrO4 composite at a weight content of 4.0% In2O3 for the degradation of MO was 8.8 and 3.3 times as high as that of pure In2O3 and Ag2CrO4, respectively. Such an enhanced photocatalytic performance was predominantly ascribed to the formation of Z-scheme system composed of In2O3, Ag and Ag2CrO4, which effectively improved the separation and transfer of photogenerated charge carriers. Furthermore, the superoxide radical anions and holes were considered as the main reactive species during the photodegradation process, and a possible photocatalytic mechanism is proposed based on the experimental results. The present work may provide a new insight for the smart design and synthesis of various highly efficient visible-light-driven photocatalysts for environmental and energy applications.Acknowledgements
This work was supported by the Guangdong Provincial Natural Science Foundation (No. 2016A030307015, 2015A030310431, 2015A030313893).Notes and references
- (a) Q. Liu, Y. R. Guo, Z. H. Chen, Z. G. Zhang and X. M. Fang, Appl. Catal., B, 2016, 183, 231–241 CrossRef CAS; (b) X. J. She, L. Liu, H. Y. Ji, Z. Mo, Y. P. Li, L. Y. Huang, D. L. Du, H. Xu and H. M. Li, Appl. Catal., B, 2016, 187, 144–153 CrossRef CAS.
- (a) A. Di Paola, E. García-López, G. Marcì and L. Palmisano, J. Hazard. Mater., 2012, 211–212, 3–29 CrossRef CAS PubMed; (b) E. García-López, G. Marcì, B. Megna, F. Parisi, L. Armelao, A. Trovarelli, M. Boaro and L. Palmisano, J. Catal., 2015, 321, 13–22 CrossRef; (c) V. Augugliaro, M. Bellardita, V. Loddo, G. Palmisano, L. Palmisano and S. Yurdakal, J. Photochem. Photobiol., C, 2012, 13, 224–245 CrossRef CAS; (d) H. F. Cheng, B. B. Huang and Y. Dai, Nanoscale, 2014, 6, 2009–2026 RSC.
- (a) J. Luo, X. S. Zhou, L. Ma and X. Y. Xu, RSC Adv., 2015, 5, 68728–68735 RSC; (b) J. Luo, X. S. Zhou, J. Q. Zhang and Z. H. Du, RSC Adv., 2015, 5, 86705–86712 RSC.
- X. J. Chen, Y. Z. Dai and X. Y. Wang, J. Alloys Compd., 2015, 649, 910–932 CrossRef CAS.
- (a) X. C. Wang, K. Maeda, A. Thomas, K. Takanabe, G. Xin, J. M. Carlsson, K. Domen and M. Antonietti, Nat. Mater., 2009, 8, 76–80 CrossRef CAS PubMed; (b) J. Liu, Y. Liu, N. Y. Liu, Y. Z. Han, X. Zhang, H. Huang, Y. Lifshitz, S. T. Lee, J. Zhong and Z. H. Kang, Science, 2015, 347, 970–974 CrossRef CAS PubMed.
- (a) G. P. Li, Y. X. Wang and L. Q. Mao, RSC Adv., 2014, 4, 53649–53661 RSC; (b) D. J. Martin, G. G. Liu, S. J. Moniz, Y. P. Bi, A. M. Beale, J. H. Ye and J. W. Tang, Chem. Soc. Rev., 2015, 44, 7808–7828 RSC.
- (a) J. Li, Y. Yu and L. Z. Zhang, Nanoscale, 2014, 6, 8473–8488 RSC; (b) T. Saison, N. Chemin, C. Chanéac, O. Durupthy, L. Mariey, F. Maugé, V. Brezová and J. P. Jolivet, J. Phys. Chem. C, 2015, 119, 12967–12977 CrossRef CAS.
- (a) J. Luo, X. S. Zhou, L. Ma, X. Y. Xu, J. X. Wu and H. P. Liang, Mater. Res. Bull., 2016, 77, 291–299 CrossRef CAS; (b) L. Shi, L. Liang, F. X. Wang, M. S. Liu and J. M. Sun, Dalton Trans., 2016, 45, 5815–5824 RSC.
- (a) S. X. Ouyang, Z. S. Li, Z. Ouyang, T. Yu, J. H. Ye and Z. G. Zou, J. Phys. Chem. C, 2008, 112, 3134–3141 CrossRef CAS; (b) D. F. Xu, B. Cheng, S. W. Cao and J. G. Yu, Appl. Catal., B, 2015, 164, 380–388 CrossRef CAS.
- L. F. Zhu, D. Q. Huang, J. F. Ma, D. R. Wu, M. R. Yang and S. Komarneni, Ceram. Int., 2015, 41, 12509–12513 CrossRef CAS.
- M. Pirhashemi and A. Habibi-Yangjeh, J. Mater. Sci.: Mater. Electron., 2016, 27, 4098–4108 CrossRef CAS.
- M. Pirhashemi and A. Habibi-Yangjeh, Solid State Sci., 2016, 55, 58–68 CrossRef CAS.
- A. Habibi-Yangjeh and A. Akhundi, J. Mol. Catal. A: Chem., 2016, 415, 122–130 CrossRef CAS.
- M. Pirhashemi and A. Habibi-Yangjeh, Ceram. Int., 2015, 41, 14383–14393 CrossRef CAS.
- (a) J. B. Mu, C. L. Shao, Z. C. Guo, M. Y. Zhang, Z. Y. Zhang, P. Zhang, B. Chen and Y. C. Liu, J. Mater. Chem., 2012, 22, 1786–1793 RSC; (b) J. B. Mu, B. Chen, M. Y. Zhang, Z. C. Guo, P. Zhang, Z. Y. Zhang, Y. Y. Sun, C. L. Shao and Y. C. Liu, ACS Appl. Mater. Interfaces, 2012, 4, 424–430 CrossRef CAS PubMed; (c) L. Y. Chen and W. D. Zhang, Appl. Surf. Sci., 2014, 301, 428–435 CrossRef CAS; (d) H. R. Liu, X. He, Y. C. Hu, X. G. Liu, H. S. Jia and B. S. Xu, Mater. Lett., 2014, 131, 104–107 CrossRef CAS.
- (a) F. Soofivand, F. Mohandes and M. Salavati-Niasari, Mater. Res. Bull., 2013, 48, 2084–2094 CrossRef CAS; (b) D. F. Xu, S. W. Cao, J. F. Zhang, B. Cheng and J. G. Yu, Beilstein J. Nanotechnol., 2014, 5, 658–666 CrossRef CAS PubMed.
- X. N. Liu, Q. F. Lu, C. Q. Wang, C. F. Zhu and S. W. Liu, J. Sol-Gel Sci. Technol., 2015, 73, 358–364 CrossRef CAS.
- J. B. Mu, B. Chen, M. Y. Zhang, Z. C. Guo, P. Zhang, Z. Y. Zhang, Y. Y. Sun, C. L. Shao and Y. C. Liu, ACS Appl. Mater. Interfaces, 2012, 4, 424–430 CAS.
- B. Chai and X. Wang, RSC Adv., 2015, 5, 7589–7596 RSC.
- (a) L. L. Xu, J. G. Guan, W. D. Shi and L. J. Liu, J. Colloid Interface Sci., 2012, 377, 160–168 CrossRef CAS PubMed; (b) A. Nashim, S. Martha and K. Parida, ChemCatChem, 2013, 5, 2352–2359 CrossRef CAS.
- Q. J. Xiang, D. Lang, T. T. Shen and F. Liu, Appl. Catal., B, 2015, 162, 196–203 CrossRef CAS.
- (a) S. L. Wang, H. H. Qian, Y. Hu, W. Dai, Y. J. Zhong, J. F. Chen and X. Hu, Dalton Trans., 2013, 42, 1122–1128 RSC; (b) J. J. Li, Y. L. Xie, Y. J. Zhong and Y. Hu, J. Mater. Chem. A, 2015, 3, 5474–5481 RSC.
- (a) J. L. Han, G. Q. Zhu, M. Hojamberdiev, J. H. Peng, X. Zhang, Y. Liu, B. Ge and P. Liu, New J. Chem., 2015, 39, 1874–1882 RSC; (b) H. F. Shi, H. Q. Tan, W. b. Zhu, Z. C. Sun, Y. J. Ma and E. B. Wang, J. Mater. Chem. A, 2015, 3, 6586–6591 RSC.
- (a) H. Xu, Y. X. Song, Y. H. Song, J. X. Zhu, T. T. Zhu, C. B. Liu, D. X. Zhao, Q. Zhang and H. M. Li, RSC Adv., 2014, 4, 34539–34547 RSC; (b) C. L. Yu, L. F. Wei, J. C. Chen, W. Q. Zhou, Q. Z. Fan and J. M. Yu, Rare Met., 2016, 35, 475–480 CrossRef CAS; (c) X. X. Wang, L. H. Zhang, H. J. Lin, Q. Y. Nong, Y. Wu, T. H. Wu and Y. M. He, RSC Adv., 2014, 4, 40029–40035 RSC; (d) X. J. Zou, C. Q. Ran, Y. Y. Dong, Z. B. Chen, D. P. Dong, D. X. Hu, X. Y. Li and Y. B. Cui, RSC Adv., 2016, 6, 20664–20670 RSC.
- (a) L. Y. Huang, Y. P. Li, H. Xu, Y. G. Xu, J. X. Xia, K. Wang, H. M. Li and X. N. Cheng, RSC Adv., 2013, 3, 22269–22279 RSC; (b) J. Luo, X. S. Zhou, L. Ma and X. Y. Xu, J. Mol. Catal. A: Chem., 2015, 410, 168–176 CrossRef CAS.
- T. Simon, N. Bouchonville, M. J. Berr, A. Vaneski, A. Adrović, D. Volbers, R. Wyrwich, M. Döblinger, A. S. Susha, A. L. Rogach, F. Jäckel, J. K. Stolarczyk and J. Feldmann, Nat. Mater., 2014, 13, 1013–1018 CrossRef CAS PubMed.
- L. Wang, J. Ding, Y. Y. Chai, Q. Q. Liu, J. Ren, X. Liu and W. L. Dai, Dalton Trans., 2015, 44, 11223–11234 RSC.
- (a) H. Y. Chen, L. G. Qiu, J. D. Xiao, S. Ye, X. Jiang and Y. P. Yuan, RSC Adv., 2014, 4, 22491–22496 RSC; (b) X. Y. Fan, J. Shao, Z. J. Li, F. L. Ma, A. A. Meng and Q. D. Li, New J. Chem., 2016, 40, 1330–1335 RSC.
- (a) H. Xu, Y. X. Song, Y. H. Song, J. X. Zhu, T. T. Zhu, C. B. Liu, D. X. Zhao, Q. Zhang and H. M. Li, RSC Adv., 2014, 4, 34539–34547 RSC; (b) C. Dong, K. L. Wu, X. W. Wei, X. Z. Li, L. Liu, T. H. Ding, J. Wang and Y. Ye, CrystEngComm, 2014, 16, 730–736 RSC.
- (a) J. W. Xu, Z. D. Gao, K. Han, Y. M. Liu and Y. Y. Song, ACS Appl. Mater. Interfaces, 2014, 6, 15122–15131 CAS; (b) C. N. Tang, E. Z. Liu, J. Wan, X. Y. Hu and J. Fan, Appl. Catal., B, 2016, 181, 707–715 CrossRef CAS; (c) O. Mehraj, N. A. Mir, B. M. Pirzada, S. Sabir and M. Muneer, J. Mol. Catal. A: Chem., 2014, 395, 16–24 CrossRef CAS.
- Q. Zhang, H. Y. Wang, S. Z. Hu, G. Lu, J. Bai, X. X. Kang, D. Liu and J. Z. Gui, RSC Adv., 2015, 5, 42736–42743 RSC.
- (a) J. Yang, R. S. Hu, W. W. Meng and Y. F. Du, Chem. Commun., 2016, 52, 2620–2623 RSC; (b) I. Aslam, C. B. Cao, M. Tanveer, M. H. Farooq, W. S. Khan, M. Tahir, F. Idrees and S. Khalid, RSC Adv., 2015, 5, 6019–6026 RSC.
- T. Yan, Q. Yan, X. D. Wang, H. Y. Liu, M. M. Li, S. X. Lu, W. G. Xu and M. Sun, Dalton Trans., 2015, 44, 1601–1611 RSC.
- (a) Y. P. Liu, P. Chen, Y. Chen, H. D. Lu, J. X. Wang, Z. S. Yang, Z. H. Lu, M. Li and L. Fang, RSC Adv., 2016, 6, 10802–10809 RSC; (b) Y. Z. Hong, Y. H. Jiang, C. S. Li, W. Q. Fan, X. Yan, M. Yan and W. D. Shi, Appl. Catal., B, 2016, 180, 663–673 CrossRef CAS.
- (a) H. Katsumata, T. Sakai, T. Suzuki and S. Kaneco, Ind. Eng. Chem. Res., 2014, 53, 8018–8025 CrossRef CAS; (b) H. Katsumata, T. Hayashi, M. Taniguchi, T. Suzuki and S. Kaneco, Mater. Res. Bull., 2015, 63, 116–122 CrossRef CAS.
| This journal is © The Royal Society of Chemistry 2016 |

