Heterogeneous UV-Fenton photodegradation of azocarmine B over [FeEDTA]− intercalated ZnAl-LDH at circumneutral pH
Xiaoxiao Tang,
Yun Liu* and
Sihui Li
Department of Environmental Science and Engineering, Xiangtan University, Xiangtan 411105, China. E-mail: liuyunscut@163.com; Fax: +86 731 58292231; Tel: +86 731 58292231
First published on 19th August 2016
Abstract
This work aimed at maintaining Fe(III) in soluble form at circumneutral pH and separating it from the treated effluent by using the heterogeneous catalyst of Fe(III)–ethylenediaminetetraacetate complex ([FeEDTA]−) intercalated layered double hedroxides (LDHs) in the UV-Fenton process for the degradation of azocarmine B (ACB). All samples were fully characterized by various techniques and the results indicated the successful intercalation of [FeEDTA]− within the interlayer of layered double hedroxides. In the decolorization and mineralization of the ACB process, the obtained catalyst showed a high photo-catalytic activity and an excellent stability at circumneutral pH. In addition, response surface methodology (RSM) was employed to optimize operating variables, and these mathematical models produced a satisfactory fit. The optimum conditions for ACB degradation were confirmed to be 6.54 initial pH, 100 mg L−1 ACB concentration and 11.5 mM H2O2 concentration. Under the optimum conditions, the maximum ACB decolorization efficiency and TOC removal could reach up to 97.27% and 90.36%, respectively, which closely agreed with the predicted values. Finally, the possible reaction mechanisms involved in the heterogeneous UV-Fenton system were proposed.
1 Introduction
The increasing use of synthetic azo dyes in textile, paint, plastic, printing, leather and cosmetic industries leads to the discharge of large amounts of wastewater containing recalcitrant organics, colors, surfactants and chlorinated compounds.1,2 This effluent, if not properly treated, is toxic to aquatic life and has an adverse impact on human health. However, the azo dye-containing wastewaters are non-biodegradable and the reduction of azo bonds in anaerobic conditions may produce hazardous intermediates which are mutagenic and carcinogenic.3 Hence, the development of new techniques on recalcitrant organic matter treatment has been paid more and more attention. The so-called advanced oxidation processes (AOPs) is one of the advanced techniques for the degradation of recalcitrant wastewater. Among the AOPs, photo-Fenton process presents very attractive advantages, such as fast reaction speed, high degradation efficiency and simple operation.4 Nevertheless, some not negligible disadvantages related to the homogeneous photo-Fenton process, including the narrow pH range of work (pH 2–3) and the difficulties in separation of iron ions from the final effluent, make it difficult to be applied widely in practice.5The problems related to the lack of efficiency of photo-Fenton at neutral pH can be solved by adding some chelating agents, which are able to maintain the iron soluble and form photoactive species that could keep active in neutral solutions.6 It is demonstrated that aminopolycarboxylates acids, such as ethylenediaminetetraacetic acid (EDTA) and ethylenediamine-N,N′-disuccinic acid (EDDS), can markedly enhance the efficiency of photo-Fenton in aqueous solution at neutral pH.7–9 However, due to difficulties in separation and regeneration of Fe complexes, the application of homogeneous catalysis by Fe(III) complexes is still rather limited. Thus, replacement of the homogeneous catalysts with heterogeneous catalysts where the active metal can be incorporated into a support stands out as a promising alternative.
In fact, the application of heterogeneous photo-Fenton catalysts for the degradation of organic pollutants has been extensively investigated in recent decades. Vast majority of the previous works were focused on the immobilization of hydroxy-metal (e.g., hydroxy-iron and hydroxy-iron–aluminum) by catalyst supports.10–12 But the application of heterogeneous catalysts containing hydroxy-metal still need prior acidification for further photo-Fenton treatment, which will cost additional expenses.13,14 In recent published works, the metal–EDTA immobilized clays were synthesized and applied in the field of chemical industry and environment remediation.15–17 While, there are few studies on the application of Fe(III)–EDTA intercalated LDHs in photo-Fenton system. Up to now, there is a certain amount of reports on Fe(III)–EDTA complex as homogeneous Fenton catalyst applied in water treatment,18–20 but most of these reports focus only on the role of hydroxyl radical (˙OH). Besides, the action mechanism of Fe(III)–EDTA intercalated LDHs in heterogeneous photo-Fenton system maybe different from that of Fe(III)–EDTA in homogeneous photo-Fenton system. So it is questionable whether other important active species can be generated in the heterogeneous photo-Fenton system containing Fe(III)–EDTA intercalated LDHs. Moreover, the possible pathways of the generation of active species in this system have not been fully understood. To increase knowledge on this subject, more fundamental studies on the reaction mechanism of Fe(III)–EDTA-driven photo-Fenton system are required.
To summarize the previous comments, the aim of this work is to synthesize a new kind of heterogeneous photo-Fenton catalyst which can be recovered easily and can degrade dyes efficiently in aqueous solution at circumneutral pH. Toward this aim, Fe(III)–ethylenediaminetetraacetate complex intercalated layered double hydroxide (EDTA–Fe–LDH) was prepared and tested as heterogeneous catalyst for the UV-Fenton decolorization and mineralization of azocarmine B (ACB). Ethylenediaminetetraacetic acid (EDTA) with strong complexation ability is able to form [FeEDTA]− anions to complex with iron ions and make it keep active at neutral or basic pH. Hydrotalcites like compounds, also refer to as layered double hedroxides,21 possess good anion-exchange capacity because of their layered structure, which make them to be attractive materials for the intercalation of anionic metallic complexes.22,23 In this work ZnAl layered double hydroxide (ZnAl-LDH) was used as catalyst support. Fe(III)–EDTA complex was intercalated into the galleries of ZnAl-LDH through anion exchange. The structure of the obtained catalyst was analyzed by X-ray diffraction (XRD), Fourier transform infrared spectroscopy (FTIR) and UV-vis diffuse spectra. To determine the optimal conditions for the ACB degradation and the effect of variables on the UV-Fenton process, response surface methodology (RSM) based on Box–Behnken design (BBD) was employed. In addition, the stability of EDTA–Fe–LDH was also measured. Moreover, the possible reaction mechanisms involved in the photo-Fenton system are proposed in this study.
2 Experimental sections
2.1 Materials
The ACB was purchased from National Medicine Group Chemical Reagent Co., LTD (China) and used without further purification. Hydrogen peroxide (H2O2 30%, mass/v), sodium nitrate (NaNO3), zinc nitrate (Zn(NO3)2·6H2O), aluminum nitrate (Al(NO3)3·9H2O), NaFeEDTA (C10H12FeN2NaO8·3H2O), sodium hydroxide (NaOH), and nitric acid (HNO3) were analytical grade reagents. Ultrapure water was used throughout the experiments.2.2 Synthesis of catalyst
![[thin space (1/6-em)]](https://www.rsc.org/images/entities/char_2009.gif) :
:![[thin space (1/6-em)]](https://www.rsc.org/images/entities/char_2009.gif) Al molar ratio 2
Al molar ratio 2![[thin space (1/6-em)]](https://www.rsc.org/images/entities/char_2009.gif) :
:![[thin space (1/6-em)]](https://www.rsc.org/images/entities/char_2009.gif) 1 was prepared by co-precipitation method at a constant pH of 6.24 Solution A: Zn(NO3)2·6H2O and Al(NO3)3·9H2O with Zn2+/Al3+ ratio of 2.0 were dissolved in ultrapure water to give solution with an Zn2+ concentration of 0.4 M. Solution B: NaOH was dissolved in ultrapure water. Solution C: NaNO3 solution.
1 was prepared by co-precipitation method at a constant pH of 6.24 Solution A: Zn(NO3)2·6H2O and Al(NO3)3·9H2O with Zn2+/Al3+ ratio of 2.0 were dissolved in ultrapure water to give solution with an Zn2+ concentration of 0.4 M. Solution B: NaOH was dissolved in ultrapure water. Solution C: NaNO3 solution.The synthesis was carried out by dropwise addition of solution A and B to solution C under magnetic stirring at 65 °C, then the mix solution was aged for 24 h at 70 °C. Finally, the suspension solution was filtered and washed with ultrapure water till the supernatant attained a pH value around 7, dried at 60 °C and ground to 200-mesh.
2.3 Characterization
Fourier transform infrared (FTIR) spectra of the samples were recorded by the KBr pellet technique on a Nicolet 380 FTIR spectrometer (Thermo Scientific Brand, America). Power X-ray diffraction (XRD) measurements were performed on a (Rigaku) D/max-2550 VK/PC diffract meter. Specific surface area based on nitrogen physisorption was measured by a Quanta chrome NOVA 2200e instrument. The samples were degassed at 120 °C for 12 h prior to the sorption measurement. Diffuse reflectance UV-vis absorption spectra were measured by UV-2550 double-beam digital spectrophotometer equipped with conventional components of a reflectance spectrometer. The reference was BaSO4.2.4 Analytical methods
The variation in dye color change at different time was monitored by taking intermittent dye solution and measuring its absorbance value (at 515 nm) in a UV-vis spectrophotometer (722S, Shanghai Analytical Instrument Co. Ltd, China). The mineralization degree of ACB was evaluated by measuring total organic carbon (TOC) concentration with a TOC analyzer (Shimadzu TOC-L CPH CN 200, Japan) equipped with an auto-sampler. The above measurements were repeated three times. The total dissolved iron concentration in heterogeneous photo-Fenton process was analyzed by an Atomic Absorption Spectrophotometer (Shimadzu AA7000, Japan).2.5 Experimental design and optimization
All experiments for photo-Fenton were conducted in a photochemical reaction instrument (BL-GHX-CH500, Xi'an Depai Biotech. Co. Ltd., China). A 300 W Hg arc lamp with the intensity of 16.0–17.5 mW cm−2, which could simulate the UV spectrum, was positioned inside a cylindrical Pyrex vessel surrounded by a circulating water jacket. In the photo-Fenton experiments, 0.14 g of catalyst was added to 700 mL ACB solution. To assure a good mixing of the solution, the vessel was provided with a magnetic stirrer.The optimization of experimental conditions for ACB degradation was conducted using Box–Behnken design (BBD) technique under RSM. The experimental design, data analysis, quadratic model buildings, and graph plotting were obtained from Design Expert 8.0.6. Three critical parameters of pH, initial dye concentration and H2O2 concentration were coded with selected ranges as shown in Table 1.
| Independent variables | Code | Real values of coded levels | ||
|---|---|---|---|---|
| −1 | 0 | 1 | ||
| pH | A | 5 | 7 | 9 |
| ACB (mg L−1) | B | 100 | 200 | 300 |
| H2O2 (mM) | C | 0.5 | 5 | 11.5 |
The responses were expressed as % of ACB decolorization efficiency and TOC removal efficiency, which could be calculated by the following equations (eqn (1) and (2)):
| ACB decolorization efficiency (%) = (C0 − Ci)/C0 × 100 | (1) |
| TOC removal efficiency (%) = (TOC0 − TOCi)/TOC0 × 100 | (2) |
| Y = k0 + kaA + kbB + kcC + kabAB + kacAC + kbcBC + kaaA2 + kbbB2 + kccC2 | (3) |
3 Results and discussion
3.1 Characterization of the catalysts
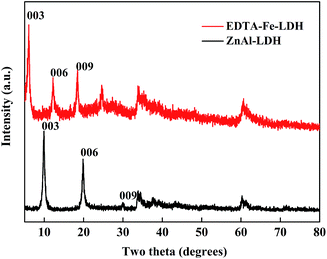
The XRD patterns of ZnAl-LDH and EDTA–Fe–LDH are illustrated in Fig. 1. ZnAl-LDH exhibits a typical characteristic of LDHs phase. The position of the 003 reflection (2θ = 9.794°) and the 006 reflection (2θ = 19.83°) match very closely with those reported for LDHs with an Zn/Al ratio of 2.23 Compared with ZnAl-LDH, the 003 reflection of EDTA–Fe–LDH slightly shifts to lower 2θ angle and the basal distance of increases from 0.9024 nm to 1.452 nm (as displayed on Table 2), which indicate that the NO3− in the interlayer galleries are replaced by the larger [FeEDTA]− anions.25| Sample | Two theta [degrees] (hkl) | Estimated parameters [Å] | ||||
|---|---|---|---|---|---|---|
| 003 | 006 | 009 | Metal distance a = 2d(110) | Basal spacing c′ = d(003) | Gallery height Δ = c′ − 4.80 Å | |
| ZnAl-LDH | 9.794 | 19.83 | 33.81 | 3.0718 | 9.024 | 4.224 |
| EDTA–Fe–LDH | 6.082 | 12.27 | 18.45 | 3.066 | 14.52 | 9.72 |
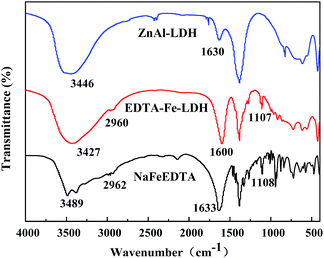
The FTIR spectra of the ZnAl-LDH, EDTA–Fe–LDH and NaFeEDTA are shown in Fig. 2. In the spectrum of ZnAl-LDH, the absorption band in the range 3300–3500 cm−1 is assigned to O–H stretching vibration of LDH layer as well as interlayer water molecules. The bending vibration of the interlayer water molecules gives rise to medium-intensity absorption close to 1630 cm−1. The presence of [FeEDTA]− in ZnAl-LDH can be confirmed by the presence of the bands around 2960 and 1107 cm−1, which are attributed to the stretching vibration of C–H and C–N respectively.26 Moreover, a significant absorption band around 1600 cm−1 can be found in the spectrum of EDTA–Fe–LDH and the absorption strength is much stronger than O–H bending vibration in the spectrum of ZnAl-LDH. This band could be assigned to C![[double bond, length as m-dash]](https://www.rsc.org/images/entities/char_e001.gif) O stretching of carboxylate group.25 Compared with NaFeEDTA, the C
O stretching of carboxylate group.25 Compared with NaFeEDTA, the C![[double bond, length as m-dash]](https://www.rsc.org/images/entities/char_e001.gif) O stretching band is slightly shifted after intercalation, perhaps due to the restrictions within the interlayer space and the stronger interaction with –OH via hydrogen bonding.27 From the analysis of the XRD and FTIR spectra, it can be concluded that [FeEDTA]− intercalate into the interlayer space of ZnAl-LDH successfully.
O stretching band is slightly shifted after intercalation, perhaps due to the restrictions within the interlayer space and the stronger interaction with –OH via hydrogen bonding.27 From the analysis of the XRD and FTIR spectra, it can be concluded that [FeEDTA]− intercalate into the interlayer space of ZnAl-LDH successfully.
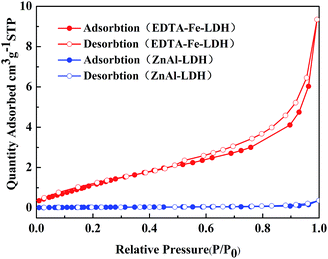
Nitrogen adsorption–desorption isotherms measurements used to examine the surface area and porous structure of ZnAl-LDH and EDTA–Fe–LDH are shown in Fig. 3. ZnAl-LDH shows a Brunauer–Deming–Deaming–Teller (BDDT) type III isotherm, which should not be porous materials, according to the IUPAC classification.28 In contrast to ZnAl-LDH, the isotherm of EDTA–Fe–LDH is type IV, which is characteristic of mesopores solids. The steep adsorption branch and sloping desorption branch at high P/P0 region suggest that the hysteresis loop is of type H3, which reflect the presence of slit-shaped pores introduced by the aggregation of plate-like particles.29 In addition, there is an increase in surface area for EDTA–Fe–LDH, because of basal spacing expansion, when bigger complex molecules are incorporated into the LDH layers. As a consequence, EDTA–Fe–LDH possesses a surface area of 5.2689 m2 g−1, whereas smaller surface area occurs for ZnAl-LDH with 2.4633 m2 g−1.
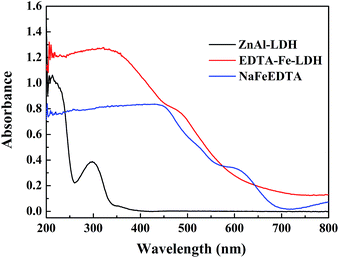
From the UV-vis diffused reflectance spectra of ZnAl-LDH, NaFeEDTA and EDTA–Fe–LDH (as shown in Fig. 4), it is evident that ZnAl-LDH has two strong UV absorptions at 220 and 300 nm, which is attributed to the existence of nitrate anions in the interlayer galleries.23 The absorbance curve of NaFeEDTA shows a significant UV-vis absorption below 450 nm. Compared to NaFeEDTA, the absorption strength of EDTA–Fe–LDH has increased obviously in the region of 200–450 nm. The additional UV-vis absorbance for EDTA–Fe–LDH can be ascribed to the strong supramolecular interactions among [FeEDTA]− in the galleries of ZnAl-LDH or the interactions between the intercalated [FeEDTA]− and ZnAl-LDH sheets.27
3.2 UV-Fenton degradation of ACB
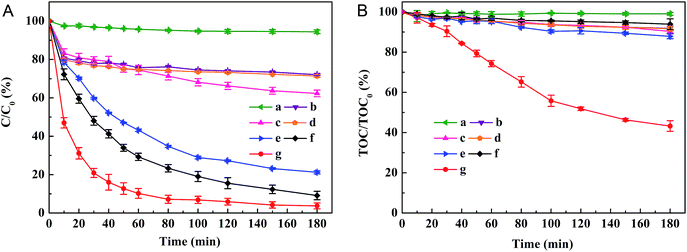
Decolorization and mineralization of ACB in solutions of pH 6 under various reaction conditions were carried out (as shown in Fig. 5). It can be found that ACB is tolerant to oxidation with only UV irradiation (curve a), as indicated by the 5.57% decolorization efficiency and the only 0.93% TOC removal efficiency after 180 min reaction. Without any H2O2 and UV irradiation, but with only EDTA–Fe–LDH (curve b), the decoloration and mineralization of ACB are fast in the first 10 min and finally reach to a steady state of 27.91% decoloration efficiency and 8.13% TOC removal efficiency, which may result from the adsorption of ACB on the surface of EDTA–Fe–LDH catalyst. For UV/EDTA–Fe–LDH system (curve c), the decolorization efficiency (37.69%) and TOC removal efficiency (9.68%) are close to the summation of only UV irradiation system and only EDTA–Fe–LDH system. In H2O2/EDTA–Fe–LDH system (curve d), the final ACB decolorization and TOC removal efficiency are 28.59% and 8.30% respectively, which are only slightly higher than that in EDTA–Fe–LDH system. When the reaction are carried out inUV/H2O2/ZnAl-LDH system (curve e) and UV/H2O2 system (curve f), more than 80% of color can be removed at 180 min, which is due to the oxidation of ACB by ˙OH radicals from the direct photolysis of H2O2 under the UV irradiation. However, the mineralization efficiency of UV/H2O2/ZnAl-LDH and UV/H2O2 reaction system are only 12.12% and 6.07%, respectively. According to these results, it could be speculated that the ACB can only be oxidized into longer-lived colorless intermediates but cannot be mineralized into H2O and CO2 by hydroxyl radicals. For UV/H2O2/EDTA–Fe–LDH system (curve g), excellent ACB removal efficiency can be obtained, the decoloration and TOC removal efficiency reach up to 96.26% and 56.74%, respectively, indicating that the EDTA–Fe–LDH catalyst has good catalytic activity in the photo-Fenton system at near-neutral pH. In UV/H2O2/EDTA–Fe–LDH system, the interactions between oxidant (H2O2) and catalyst (EDTA–Fe–LDH) under the UV irradiation can be explained by photo-Fenton reactions converting H2O2 into amounts of active species (such as ˙OH) during the process of circular transformation between EDTA–FeIII–LDH and EDTA–FeII–LDH. As a result, much higher mineralization degree could be reached in this system compared to UV/H2O2 system.3.3 Stability test of EDTA–Fe–LDHs catalyst
To determine the repeating applicability of the catalyst, the stability of EDTA–Fe–LDH was evaluated by performing a study. In this work, three times consecutive degradations were operated under the same conditions of 180 min treatment. After each treatment, EDTA–Fe–LDH catalyst was washed with ultrapure water after being separated by centrifugation, and then was dried at 60 °C. The results (Fig. 6) show that EDTA–Fe–LDH catalyst has an ideal long-term stability, as no significant difference in the catalytic activity was observed during these 3 cycles.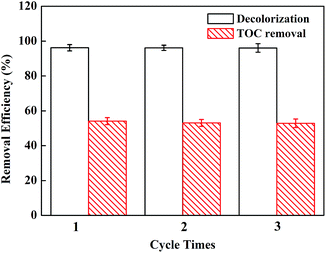 | ||
| Fig. 6 Removal efficiency of ACB under experiment conditions: [ACB] = 150 mg L−1; [H2O2] = 9 mM; [catalyst dosage] = 0.2 g L−1; [pH] = 6.0. | ||
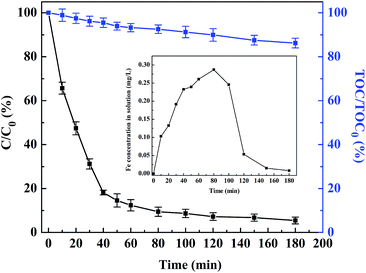
The total iron concentration in solution as a function of time in the heterogeneous photo-Fenton process has been measured by Atomic Absorption Spectrophotometer (AAS), which is shown in Fig. 7. The Fe ion concentration in solution increases initially from 0 to a peak value of 0.287 mg L−1 at about 80 min followed by a continuous decrease to a final value of 0.008 mg L−1. Similar results have been reported in previous literature.28,30,31 The iron leaching from EDTA–Fe–LDH is associated with some reaction intermediates such as organic acids that can capture Fe ions to form Fe complexes. When the concentration of the intermediates reaches a maximum, the dissolved iron concentration shows a peak value. Then the Fe ions return to the surface or interlayer of the catalyst after the intermediates being mineralized into CO2 and H2O.32,33 Generally, the total dissolved iron ions in the studied system are relatively low, indicating that the EDTA–Fe–LDH used as heterogeneous photo-Fenton catalysts is quite stable.
In addition, Fe(III)–EDTA containing equivalent weight of 0.287 mg Fe per L was used to test the role of dissolved iron ions in the degradation of ACB under the conditions of 9 mM H2O2, 150 mg L−1 ACB, and pH 6.0. The result shows that the ACB decolorization efficiency is more than 95% (as shown in Fig. 7), which is close to that in UV/H2O2 system and UV/H2O2/EDTA–Fe–LDH system. But the value of the TOC removal efficiency is only 13.79% after 180 min, far less than that in UV/H2O2/EDTA–Fe–LDH system (56.74%). Hence, the contribution of homogeneous photo-Fenton reaction is rather slight for the mineralization of ACB in the heterogeneous photo-Fenton process.
3.4 Fitting model and analysis of variance (ANOVA)
The Box–Behnken design (BBD) was selected in this study to optimize the experimental conditions and to evaluate the interactive effects of the experimental parameters. By using the quadratic polynomial model, the relationship between responses and variables was obtained in terms of coded units as follows (eqn (4) and (5)):| Decolorization efficiency (%) = 85.74 − 3.35A − 14.83B + 14.14C − 3.81AB + 2.16AC + 11.00BC − 3.58A2 − 4.68B2 − 0.82C2 | (4) |
| TOC removal efficiency (%) = 20.66 − 4.61A − 12.14B + 23.45C + 2.07AB − 1.84AC − 11.43BC − 5.34A2 + 5.01B2 + 16.09C2 | (5) |
The RSM model coefficients are validated by ANOVA and the data are shown in Table 2. The p-value is less than 0.0500, indicating the significance of the model terms.34 In the decolorization of ACB case, the terms of A, B, C, AB, BC, A2, B2and C2 are significant, while the significant terms in the TOC removal case are A, B, C, BC, A2, B2 and C2. The determination of coefficient value (R2) indicates how much of the variability in the data was accounted for by the model.35 Here, the R2 value of the decolorization and the TOC removal are 99.12% and 99.28%, respectively. These results indicate that only 0.88% and 0.72% of the total variation cannot be explained by the model in the decolorization case and the TOC removal case, respectively. Adjusted R2 (Radj2) is also a measure of goodness-of-fit. As it can be seen in Table 3, the Radj2 values are close to the corresponding the R2 values. Moreover, the signal to noise ratio can be measured by adequate precision, and a ratio more than 4 is desirable.36 In this work, the models' adequate precisions of decolorization efficiency (32.765) and TOC removal efficiency (36.686) are much greater than the acceptable value, indicating adequate signals for the models to be used to navigate the design space.
| Source | DF | Decolorization | TOC removal | ||||||
|---|---|---|---|---|---|---|---|---|---|
| Sum of squares | Mean square | F value | Prob > F | Sum of squares | Mean square | F value | Prob > F | ||
| Model | 9 | 4168.84 | 463.20 | 87.17 | <0.0001 | 7609.18 | 845.46 | 106.54 | <0.0001 |
| A | 1 | 89.98 | 89.98 | 16.93 | 0.0045 | 169.99 | 169.99 | 21.42 | 0.0024 |
| B | 1 | 1758.68 | 1758.68 | 330.97 | <0.0001 | 1179.23 | 1179.23 | 148.60 | <0.0001 |
| C | 1 | 1598.83 | 1598.83 | 300.89 | <0.0001 | 4399.37 | 4399.37 | 554.37 | <0.0001 |
| AB | 1 | 57.95 | 57.95 | 10.91 | 0.0131 | 17.12 | 17.12 | 2.16 | 0.1854 |
| AC | 1 | 18.65 | 18.65 | 3.51 | 0.1032 | 13.47 | 13.47 | 1.70 | 0.2339 |
| BC | 1 | 483.60 | 483.60 | 91.01 | <0.0001 | 522.14 | 522.14 | 65.80 | <0.0001 |
| A2 | 1 | 54.07 | 54.07 | 10.18 | 0.0153 | 119.89 | 119.89 | 15.11 | 0.0060 |
| B2 | 1 | 92.27 | 92.27 | 17.36 | 0.0042 | 105.57 | 105.57 | 13.30 | 0.0082 |
| C2 | 1 | 2.85 | 2.85 | 0.54 | 0.4877 | 1089.71 | 1089.71 | 137.31 | <0.0001 |
| Residual | 7 | 37.20 | 5.31 | 55.55 | 7.94 | ||||
| Lack of fit | 3 | 37.20 | 12.40 | 55.55 | 18.52 | ||||
| Pure error | 4 | 0.000 | 0.000 | 0.000 | 0.000 | ||||
| R2 = 0.9912; Radj2 = 0.9798; adeq precision = 32.765 | R2 = 0.9928; Radj2 = 0.9834; adeq precision = 36.686 | ||||||||
3.5 Optimization conditions and response surface analysis
The corresponding 3D surface response and contour plots obtained from the RSM equation are presented in Fig. 8–11.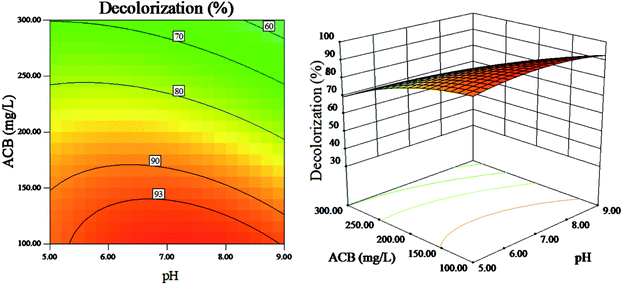 | ||
| Fig. 8 The effect of initial ACB concentration and pH on dye decolorization (other variables are held at center level). | ||
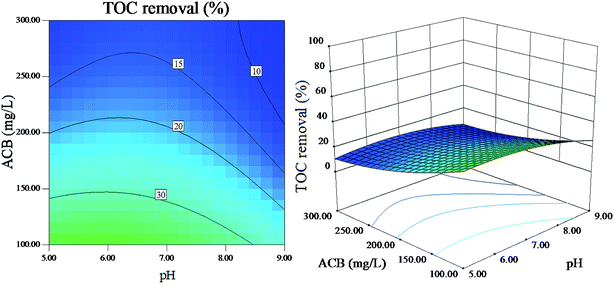 | ||
| Fig. 9 The effect of initial ACB concentration and pH on dye mineralization (other variables are held at center level). | ||
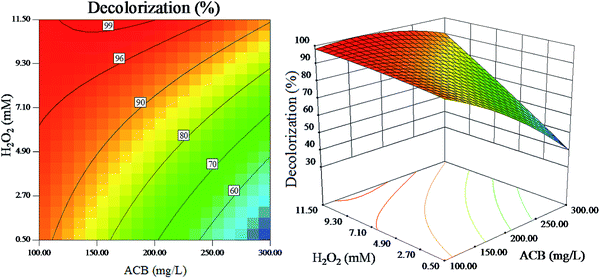 | ||
| Fig. 10 The effect of initial H2O2 concentration and initial ACB concentration on dye decolorization (other variables are held at center level). | ||
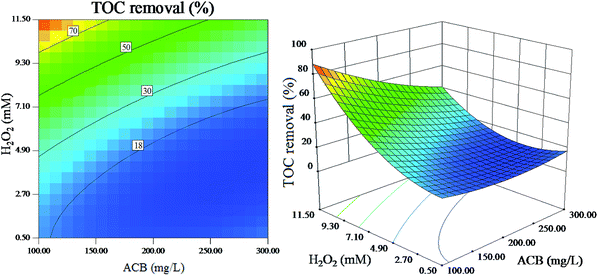 | ||
| Fig. 11 The effect of initial H2O2 concentration and initial ACB concentration on dye mineralization (other variables are held at center level). | ||
The interaction of pH and initial ACB concentration on ACB decolorization efficiency and TOC removal efficiency are shown in Fig. 8 and 9, respectively, it is indicated that ACB degradation is vulnerable to the change of initial pH. As can be observed, the ACB decolorization and TOC removal efficiency are highest at a pH between 6 and 7. Lower pH is less favourable for the heterogeneous reaction because of the dissolubility of LDH at lower pH values.37 In addition, catalyst activity decreases because of the decrease in complexation ability of EDTA towards Fe3+ at higher pH values. From Fig. 8 and 9, it also can be found that the ACB degradation decreases with increasing ACB concentration at all studied pH values, which is result from the fact that the higher concentration of ACB can prevent photo from arriving at the catalyst surface.
Fig. 10 and 11 reveal that the H2O2 concentration is directly related to the ACB degradation. In present experiment, the ACB decolorization efficiency and TOC removal efficiency increase significantly with the increase of H2O2 concentration. The reason is that high concentration of H2O2 can produce more ˙OH radicals, which can effectively enhance the rate of ACB decolorization and mineralization.
3.6 Model validation and experimental confirmation
From the results of BBD, the optimal conditions are found to be 6.54 for pH, 100 mg L−1 for ACB concentration and 11.5 mM for H2O2 concentration. Simultaneously the maximum ACB decolorization efficiency and TOC removal efficiency are 97.42% and 90.43% after 3 h reaction, respectively. Additional experiments were carried out to confirm the reliability of the response function predictions, and the ACB decolorization efficiency and TOC removal efficiency were found as 97.27% and 90.36%, respectively. It demonstrated that the BBD method was reliable and effective for optimizing the photo-Fenton conditions.3.7 Implication of photoinduced species in photo-Fenton process
Several important reactive photoinduced species are essential for the photo-Fenton reaction, mainly including ˙OH, 1O2 and O2˙−.38 To have a better understanding of the reaction mechanisms involved in the studied system, 2-propanol (C3H8O), sodium azide (NaN3) and chloroform (CHCl3) were chosen as radical scavengers, respectively.Under the conditions of 0.2 g L−1 EDTA–Fe–LDH, 9 mM H2O2, 150 mg L−1 ACB, and pH 6.0, the effect of 2-propanol addition on the ACB degradation is shown in Fig. 12A. It is indicated that the degradation of ACB is inhibited greatly by adding 2-propanol. At 40 mM 2-propanol, the degradation of ACB is decreased by 70%, suggesting that the degradation of ACB is mainly due to the generation of ˙OH radicals. The ACB degradation in the presence of different concentrations of NaN3 is reported in Fig. 12B. The decolorization of ACB slightly decreases with the presence of 30 mM NaN3. At higher concentrations of NaN3 (i.e., 40 mM) a similar inhibition extent (i.e., 30%) is observed. According to this result, it can be seen that the inhibition of NaN3 is weaker than that of 2-propanol. In addition, when different concentrations of CHCl3 were introduced into the reaction system, the degradation efficiency of ACB was almost unaffected, as shown in Fig. 12C.
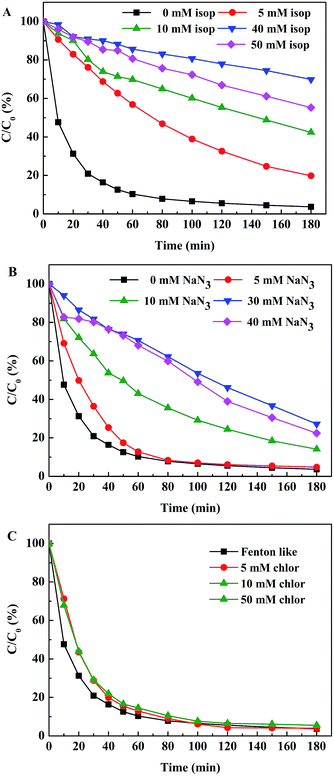 | ||
| Fig. 12 Decoloration efficiency of ACB under different scavengers. Experimental conditions: [ACB] = 150 mg L−1; [H2O2] = 9 mM; [catalyst dosage] = 0.2 g L−1; [pH] = 6.0. | ||
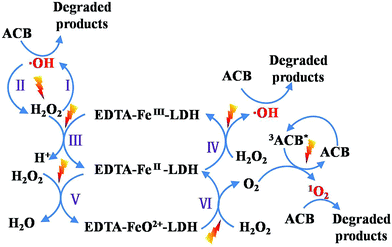
Based on the reactive species trapping experiments, ˙OH and 1O2 were considered to be the main active species for EDTA–Fe–LDH toward ACB degradation. Important conclusions on the mechanism, involved in the photo-Fenton process, can be drawn from these sets of experiments with all scavengers. As the schema of Fig. 13 proposed, different possible paths for ACB degradation are presented: (I) with UV light irradiation, H2O2 molecule cleaved into ˙OH which can oxidize ACB immediately.39 (II) The recombination of hydroxyl radicals can form H2O2.40 (III) EDTA–FeIII–LDH and H2O2 lead to the generation of EDTA–FeII–LDH and H+, this path is insignificant at neutral pH.41 (IV) Under ultraviolet irradiation, EDTA–FeII–LDH is oxidized to EDTA–FeIII–LDH by H2O2 with the formation of ˙OH which will react afterward with ACB.42 (V) In the presence of H2O2 and UV irradiation, EDTA–FeII–LDH can be oxidized into EDTA–FeO2+–LDH via a two-electron process, where EDTA–FeO2+–LDH is a convenient symbol of three resonance hybrid structures (EDTA–FeII(O)–LDH ↔ EDTA–FeIV![[double bond, length as m-dash]](https://www.rsc.org/images/entities/char_e001.gif) O–LDH ↔ EDTA–FeIII(O−˙)–LDH).43–45 (VI) The formed EDTA–FeO2+–LDH can react with H2O2 to form O2 and H2O. (VII) The adsorption of UV light promote ACB into its excited triplet state (3ACB*), that can react with O2 to form 1O2 which then degrade ACB effectively.46
O–LDH ↔ EDTA–FeIII(O−˙)–LDH).43–45 (VI) The formed EDTA–FeO2+–LDH can react with H2O2 to form O2 and H2O. (VII) The adsorption of UV light promote ACB into its excited triplet state (3ACB*), that can react with O2 to form 1O2 which then degrade ACB effectively.46
4 Conclusions
EDTA–Fe–LDH was synthesized and tested as heterogeneous catalyst for degradation of ACB in UV-Fenton system. All results of the experiments showed that EDTA–Fe–LDH exhibited a high photo-catalytic activity and an excellent stability in neutral solutions, the optimum operating conditions for the degradation of ACB in the UV/H2O2/EDTA–Fe–LDH system were found to be 6.54 of initial pH, 100 mg L−1 of ACB concentration and 11.5 mM of H2O2 concentration. Under above condition, the maximum ACB decolorization efficiency and TOC removal efficiency were 97.27% and 90.36%, respectively. In addition, based on the reactive species trapping experiments, ˙OH and 1O2 were considered to be the main active species for EDTA–Fe–LDH toward the degradation of ACB.Acknowledgements
The work is supported by the National Natural Science Foundation of China (No. 41573118) and Research Foundation of Education Bureau of Hunan Province, China (No. 14B177), and Special Project of Xiangtan University.References
- G. Harichandran and S. Prasad, Ultrason. Sonochem., 2016, 29, 178–185 CrossRef CAS PubMed.
- H. M. Pinheiro, E. Touraud and O. Thomas, Dyes Pigm., 2004, 61, 121–139 CrossRef CAS.
- A. Azizi, M. R. A. Moghaddam, R. Maknoon and E. Kowsari, J. Hazard. Mater., 2015, 299, 343–350 CrossRef CAS PubMed.
- H. Li, Y. Li, L. Xiang, Q. Huang, J. Qiu, H. Zhang, M. V. Sivaiah, F. Baron, J. Barrault, S. Petit and V. Valange, J. Hazard. Mater., 2015, 287, 32–41 CrossRef CAS PubMed.
- A. N. Soon and B. H. Hameed, Desalination, 2011, 269, 1–16 CrossRef CAS.
- A. De Luca, R. F. Dantas and S. Esplugas, Water Res., 2014, 61, 232–242 CrossRef CAS PubMed.
- W. Huang, M. Brigante, F. Wu, K. Hanna and G. Mailhot, J. Photochem. Photobiol., A, 2012, 239, 17–23 CrossRef CAS.
- W. Huang, M. Brigante, F. Wu, C. Mousty, K. Hanna and G. Mailhot, Environ. Sci. Technol., 2013, 47, 1952–1959 CrossRef CAS PubMed.
- T. Zhou, Y. Li, F.-S. Wong and X. Lu, Ultrason. Sonochem., 2008, 15, 782–790 CrossRef CAS PubMed.
- H. Bel Hadjltaief, P. Da Costa, M. E. Galvez and M. Ben Zina, Ind. Eng. Chem. Res., 2013, 52, 16656–16665 CrossRef CAS.
- Y. Zhao, H. Jiangyong and H. Chen, J. Photochem. Photobiol., A, 2010, 212, 94–100 CrossRef CAS.
- M. Luo, D. Bowden and P. Brimblecombe, Appl. Catal., B, 2009, 85, 201–206 CrossRef CAS.
- T. Xu, Y. Liu, F. Ge, L. Liu and Y. Ouyang, Appl. Clay Sci., 2013, 280, 926–932 CAS.
- T. Xu, Y. Liu, F. Ge and Y. Ouyang, Appl. Clay Sci., 2014, 100, 35–42 CrossRef CAS.
- E. Narita, T. Yamagishi, K. Tazawa, O. Ichijo and Y. Umetsu, Clay Sci., 1995, 9, 187–197 CAS.
- A. Lukashin, A. A. Vertegel, A. Eliseev, M. Nikiforov, P. Gornert and Y. D. Tretyakov, J. Nanopart. Res., 2003, 5, 455–464 CrossRef CAS.
- A. Tsyganok and A. Sayari, J. Solid State Chem., 2006, 179, 1830–1841 CrossRef CAS.
- T. Zhou, Y. Li, F. S. Wong and X. Lu, Ultrason. Sonochem., 2008, 15, 782–790 CrossRef CAS PubMed.
- E. H. Park, J. Jung and H. H. Chung, Chemosphere, 2006, 64, 432–436 CrossRef CAS PubMed.
- S. Nam, V. Renganathan and P. G. Tratnyek, Chemosphere, 2001, 45, 59–65 CrossRef CAS PubMed.
- I. M. Ahmed and M. S. Gasser, Appl. Surf. Sci., 2012, 259, 650–656 CrossRef CAS.
- W. Huang, M. Brigante, F. Wu, K. Hanna and G. Mailhot, J. Photochem. Photobiol., A, 2012, 239, 17–23 CrossRef CAS.
- H. Chai, Y. Lin, D. G. Evans and D. Li, Ind. Eng. Chem. Res., 2008, 47, 2855–2860 CrossRef CAS.
- F. Liu, W. Zhu, L. Wang, Z. Shan and W. Guo, J. Wuhan Univ. Technol., Mater. Sci. Ed., 2012, 34, 12–15 CAS.
- K. M. Parida, M. Sahoo and S. Singha, J. Catal., 2010, 276, 161–169 CrossRef CAS.
- V. P. Isupov, L. E. Chupakhina, R. P. Mitrofanova and Y. T. Pavlyukhin, Russ. J. Inorg. Chem., 2009, 54, 204–210 CrossRef.
- L. Huang, T. G. St Denis, Y. Xuan, Y. Y. Huang, M. Tanaka, A. Zadlo, T. Sarna and M. R. Hamblin, Free Radical Biol. Med., 2012, 53, 2062–2071 CrossRef CAS PubMed.
- Z. Huang, P. Wu, B. Gong, Y. Lu, N. Zhu and Z. Hu, Appl. Surf. Sci., 2013, 286, 371–378 CrossRef CAS.
- J. S. Valente, F. Tzompantzi and J. Prince, Appl. Catal., B, 2011, 102, 276–285 CrossRef CAS.
- J. Feng, X. Hu and P. L. Yue, Energy Environ. Sci., 2004, 38, 269–275 CAS.
- C. P. Huang and Y. H. Huang, Appl. Catal., A, 2009, 357, 135–141 CrossRef CAS.
- L. F. González-Bahamón, F. Mazille, L. N. Benítez and C. Pulgarín, J. Photochem. Photobiol., A, 2011, 217, 201–206 CrossRef.
- M. Bobu, A. Yediler, I. Siminiceanu and S. Schulte-Hostede, Appl. Catal., B, 2008, 83, 15–23 CrossRef CAS.
- K. Cruz-González, O. Torres-Lopez, A. M. García-León, E. Brillas, A. Hernández-Ramírez and J. M. Peralta-Hernández, Desalination, 2012, 286, 63–68 CrossRef.
- A. Long, H. Zhang and Y. Lei, Sep. Purif. Technol., 2013, 118, 612–619 CrossRef CAS.
- Z. Zhang and H. Zheng, J. Hazard. Mater., 2009, 172, 1388–1393 CrossRef CAS PubMed.
- P. Wu, Q. Zhang, Y. Dai, N. Zhu, P. Li, J. Wu and Z. Dang, Clays Clay Miner., 2011, 59, 438–445 CrossRef CAS.
- F. al Housari, D. Vione, S. Chiron and S. Barbati, Photochem. Photobiol. Sci., 2010, 9, 78–86 CAS.
- N. De la Cruz, J. Gimenez, S. Esplugas, D. Grandjean, L. F. de Alencastro and C. Pulgarin, Water Res., 2012, 46, 1947–1957 CrossRef CAS PubMed.
- O. Legrini, E. Oliveros and A. Braun, Chem. Rev., 1993, 93, 671–698 CrossRef CAS.
- W. Feng and D. Nansheng, Chemosphere, 2000, 41, 1137–1147 CrossRef CAS PubMed.
- S. K. Han, T. M. Hwang, Y. Yoon and J. W. Kang, Chemosphere, 2011, 84, 1095–1101 CrossRef CAS PubMed.
- K. Boehme and H. D. Brauer, Inorg. Chem., 2002, 31, 3468–3471 CrossRef.
- J. M. Aubry, B. Cazin and F. Duprat, J. Org. Chem., 2002, 54, 726–728 CrossRef.
- H. Sugimoto and D. T. Sawyer, J. Am. Chem. Soc., 1984, 106, 4283–4285 CrossRef CAS.
- I. E. Kochevar and R. W. Redmond, Methods Enzymol., 2000, 319, 20–28 CAS.
| This journal is © The Royal Society of Chemistry 2016 |

