
Selective fluorescence detection of anilines and Fe3+ ions by two lanthanide metal–organic frameworks†
Keheng Xua,
Fengqin Wang*a,
Shuo Huanga,
Zongchao Yua,
Jianxin Zhanga,
Jianguo Yua,
Haiyan Gaob,
Yiyuan Fub,
Xiuyu Lib and
Yongnan Zhaob
aCollege of Environment and Chemical Engineering, State Key Laboratory of Separation Membranes and Membrane Processes, Tianjin Polytechnic University, Tianjin 300387, China. E-mail: wangfengqin@tjpu.edu.cn; Tel: +86-22-83955457
bCollege of Materials and Engineering, Key Lab of Hollow Fiber Membrane Materials & Membrane Process, Tianjin Polytechnic University, Tianjin 300387, China
First published on 20th September 2016
Abstract
Two isostructural lanthanide metal–organic frameworks [Ln2(TDC)3(CH3OH)2·(CH3OH)] (Ln = Eu, 1; Tb, 2, TDC = 2,5-thiophenedicarboxylic acid) were successfully synthesized. For the two compounds, the participation of the fluorescent ligand H2L sensitized and enhanced the lanthanide characteristic emissions of the two MOFs as expected. Luminescent investigations reveal that 1 and 2 can be efficient multifunctional luminescent materials for high-sensitivity sensing of aromatic amine compounds and metal ions, especially for p-nitroaniline and Fe3+ ions with a fluorescence quenching effect. Additionally, diphenylamine significantly enhanced the ligand-based emission of 2 under the same experimental conditions. These features make 1 and 2 promising candidates for the development of multifunctional sensors in the future.
1. Introduction
Now, with the growth of industrialization and population, environmental problems are becoming more and more serious in our daily life. Therefore, governments and scientists have both been investing money and focusing attention towards environmental issues such as air, water, and industrial-waste pollution because they are detrimental to human health and sustainable development.1 Aromatic amines, known as notorious environmental pollutants, can result in carcinogenicity by ingestion, inhalation and skin contact, even at very low concentrations.2 Additionally, Fe3+ ions, as one of the most important elements for humans and other living organisms, play a crucial role in biological and environmental systems. The deficiency and excess of it can induce a number of physiological disorders.3 Therefore, the rapid and efficient detection of aromatic amines and Fe3+ ions is not only an exigent requirement in the field of public security, but also critical for environmental protection.However, the traditional detection methods are expensive and not always available. Compared to conventional methods, fluorescence sensing technology based on MOFs is convenient and has high sensitivity and selectivity, rapid response times and reproducibility, etc.4 Recently, a large amount of luminescent MOF sensors exhibiting high selectivity and sensitivity for detecting anions,5 cations,6 small molecules,7 and vapor8 have been reported. As far as the luminescent MOFs for sensing applications, most of which were constructed by d10 transition metal ions (Zn/Cd) and π-conjugated ligands.9 By contrast, lanthanide MOFs (Ln-MOFs) as fluorescent sensors has been rarely investigated. However, the strong characteristic emissions, high quantum yield and bright luminescent colors of Ln3+ ions, especially for Eu3+ and Tb3+, make Ln-MOFs the most promising sensor materials.10 Therefore, increasing interest was found in the recognition and sensing of metal ions and organic small molecules using Ln-MOFs as fluorescent sensors for their important roles in biological and environmental systems.11
It is well known that lanthanide metal ions have characteristic fluorescence emission when excited at a particular wavelength. However, the emission of lanthanide ions suffers from weak light absorption and the Laporte forbidden f–f transitions, which make it difficult to generate efficient fluorescence emission by direct excitation.12 In general, the organic linker containing π-conjugated system in lanthanide based MOFs can act as “antenna” to sensitize and enhance the lanthanide characteristic emission of the MOFs.7a,9a,13 So, it is critical to select appropriate organic linker for the construction of Ln-MOFs with characteristic fluorescence emission.
Considering the above mentioned, we selected 2,5-thiophenedicarboxylic acid (H2tpdc) as a sensitizing chromophore and multicarboxylate linker to assemble two lanthanide metal–organic frameworks, [Ln2(TDC)3(CH3OH)2·(CH3OH)] (Ln = Eu, 1; Tb, 2, TDC = 2,5-thiophenedicarboxylic acid) under solvothermal conditions. It is remarkable, that Eu- and Tb-MOFs emit bright characteristic light readily observed by the naked eye under a standard UV lamp. This may be attributed to the big radius of the S atom and its lone pair of electrons, which can be more easily delocalized within the heterocycle, and the ligand exhibits good charge-transfer ability.14,15 Although the structures and luminescent properties are well documented,15 their fluorescence sensing behaviors have not yet been reported. Herein, we systematically studied the fluorescence sensing performance for detection of aromatic amines and metal ions. As expected, the two Ln-MOFs exhibit excellent multi-responsive fluorescence sensing of organic small molecules and metal ions via the fluorescence quenching or enhancement effect. The results indicate that 1 and 2 are promising luminescent probes for detecting aromatic amines and Fe3+ ions, which can be potentially used for the detection of pollutants or environmental monitoring.
2. Experimental
2.1 Chemicals and instrumentation
All reagents and solvents employed were commercially available and used as supplied without further purification. Fourier transform infrared (FTIR) spectra were recorded on a FTIR-650 spectrophotometer using KBr pellets in the range 4000–400 cm−1. X-ray diffraction patterns (PXRD) were recorded on a D/MAX-2500 automated diffractometer using Cu Kα radiation from 3° to 80°. The simulated PXRD patterns were derived from the single crystal data through the diffraction-crystal module of the Mercury program version 3.0. Thermogravimetric (TG) analysis was carried out on a Shimadzu TG-60 analyzer at a heating rate of 5 °C min−1 from ambient temperature to 800 °C under argon atmosphere in the Al2O3 crucibles. The photoluminescence spectra of the complexes studied in the solid state and their samples in methanol solution were measured on an F-380 spectrophotometer.2.2 Synthesis of [Eu2(TDC)3(CH3OH)2·(CH3OH)] (1)
The reaction of H2TDC (0.0172 g, 0.1 mmol) and Eu(NO3)3·6H2O (0.0446 g, 0.1 mmol) in the presence of 5 mL of CH3OH, sealed in a 25 mL stainless steel vessel and statically heated at 120 °C for 3 days under autogenous pressure, and then cooled to room temperature. Colorless block crystals of 1 were obtained by filtration and washed with CH3OH. IR (KBr pellet cm−1): 3411 br, 1559 vs, 1381 vs, 1087 m, 1030 m, 858 w, 810 m, 768 s, 687 w, 622 w, 548 w, 475 m.2.3 Synthesis of [Tb2(TDC)3(CH3OH)2·(CH3OH)] (2)
Compound 2 was obtained with the same synthetic procedure except for using Tb(NO3)3·6H2O instead of Eu(NO3)3·6H2O. IR (KBr pellet cm−1): 3427 br, 1560 vs, 1385 vs, 1163 m, 1072 m, 949 w, 857 w, 774 m, 682 w, 544 m, 475 m.2.4 Fluorescence titrations in dispersed medium
To examine the potential of 1 and 2 for sensing aromatic amines compounds and metal ions, the MOFs (3 mg) were immersed in methanol (3 mL), respectively, which were treated by ultrasonication for 1.5 h. All titrations were carried out by gradually adding analytes in an incremental fashion. The corresponding fluorescence emission spectra were recorded at 298 K. Each titration was repeated several times to get concordant values. For all measurements, the suspensions of 1 were excited at λex = 395 nm and the corresponding emission wavelengths were monitored from 500 to 750 nm. The suspensions of 2 were excited at λex = 320 nm and the corresponding emission wavelengths were monitored from 330 to 650 nm. The fluorescence efficiency was calculated using the formula [(I0 − I)/I0] × 100% (I0 is the initial fluorescence intensity). Fluorescence quenching titration was further evaluated using the Stern–Volmer equation I0/I = 1 + Ksv[M], where the values I0 and I are the fluorescence intensity of the MOFs suspension without and with addition of analytes, respectively, Ksv is the quenching constant, [M] is the analytes concentration.3. Results and discussion
Compounds 1 and 2 were prepared from the solvothermal reaction according to the literature.15 The structure of 1 was confirmed by powder X-ray diffraction analysis. The diffraction peaks in the pattern is very similar to the reported bulk phase of [Eu2(TDC)3(CH3OH)2·(CH3OH)] (Fig. S1†), indicating that the framework structure of 1 is identical to the literature reported. Compound 2 has also been successfully synthesized using Tb(NO3)3 instead of Eu(NO3)3. We also determined the powder X-ray diffraction and IR spectrum of 2 (Fig. S2 and S3†), which are identical to those of 1, respectively, confirming that 1 and 2 are isostructural.The thermal stabilities of 1 and 2 were studied by using thermogravimetric analysis (TGA). Similar behaviors occurred between 1 and 2. As shown in Fig. S4,† the first weight loss of 10.1% (for 1) and 10.9% (for 2) occurred from beginning to 450 °C, corresponding to the release of two coordinated CH3OH molecules and one free CH3OH molecule (calcd: 10.4% for 1 and 10.3% for 2). With the temperature increasing, the frameworks collapsed.
3.1 The photophysical properties
The emission spectra for compounds 1 and 2 were recorded in the solid state at room temperature (Fig. S5 and S6†). Upon excitation at 395 nm, 1 gives four characteristic emission bands at 592, 617, 653 and 699 nm, which could be attributed to the characteristic f–f electronic transitions of the Eu3+: 5D0 → 7FJ (J = 1–4), respectively. The strongest 5D0 → 7F2 transition is the so-called hypersensitive transition, which is responsible for the brilliant red emission. For 2, when excited at 320 nm, it also exhibits four characteristic emission peaks at 490, 546, 590 and 619 nm, which belongs to 5D4 → 7FJ (J = 6, 5, 4 and 3) transitions of Tb3+ respectively. Among them, 5D4 → 7F5 transition presented at 546 nm is the most prominent characteristic emission peak, attributed to magnetic-dipole induced transitions and dominated the green color of 2. Besides, in 2, the ligand emission band at 356 nm is also observed, but it is much weaker than that of the free L ligand (Fig. S7†). However, in 1, the ligand-based fluorescence emission was still not observed by adjusting the excitation wavelength and the monitored emission ranges. The results clearly demonstrate that ligand L is an excellent antenna chromophore for sensitizing the fluorescence of Eu3+ and Tb3+ by the efficient energy transfer from the ligand to the lanthanide ions, while it is not completely effective for Tb3+ than Eu3+.14 In addition, taking into account the important role of solvents, the experiments were then performed in different solvents to determine the optimum solvent for sensing experiments. As shown in Fig. S8 and S9,† the suspensions of 1 and 2 in methanol have the similar emissions with the solid state samples of them. The strong emissions of 1 and 2 in the solid state and organic suspensions confirm that they have potential applications in liquid phase fluorescence detection. So, we selected methanol as the organic solvent for the sensing experiments.3.2 Detection of aromatic amines
Considering the excellent fluorescence properties of 1 and 2, we explored their potential sensing abilities. The fluorescence responses of 1 and 2 have been investigated by incremental addition of p-nitroaniline, aniline, diphenylamine and p-methylaniline to the methanol suspensions of them. For 1, the corresponding fluorescence curve shows the four characteristic emission peaks of Eu3+, but only the highest emission peak at 617 nm was recorded. Although all the given aromatic amines quenched the fluorescence intensities of 1, p-nitroaniline gives the most significant quenching effect. With the addition of p-nitroaniline of 0.2 μmol, the quenching efficiency is up to 89.5% (Fig. 1a), which is much higher than other aromatic amines compounds (Fig. S10–S12†). The percentage of fluorescence quenching of 1 obtained for different analytes were given in Fig. 2a. Similarly, for 2, p-nitroaniline also significantly quenched the fluorescence intensity of 2 at 546 nm (Fig. 1b). The quenching efficiency at 546 nm is about 54.3% with the addition of p-nitroaniline of 0.2 μmol. Apart from, different from 1, the diphenylamine also gives the fluorescence response of 2, especially to the ligand-based emission at 365 nm. Upon the addition amount of 0.2 μmol, the characteristic emission of Tb3+ at 546 nm quenched 24.6%. On the contrary, the ligand emission band intensified considerably together with the slight red shift, which reached above 408.5% with the addition amount only 0.1 μmol (Fig. 3). For other given aromatic amines, not only the characteristic emission peaks of Tb3+, but also the ligand-based emissions have no significant changes (Fig. S13 and S14†). The percentage of fluorescence quenching or enhancement of 2 obtained for different analytes were given in Fig. 2b. These results indicate that 1 and 2 both have the highly selective responses to p-nitroaniline. In addition, 2 also can selectively identify and detect diphenylamine. | ||
| Fig. 1 Fluorescence titration of 1 (a) and 2 (b) dispersed in methanol with the addition of different volumes of 10−3 M methanol solution of p-nitroaniline. The slit widths for excitation and emission were both 5 nm. | ||
 | ||
| Fig. 2 Percentage of fluorescence quenching or enhancement of 1 (a) and 2 (b) obtained for different analytes in methanol solutions at room temperature. | ||
 | ||
| Fig. 3 Fluorescence titration of 2 dispersed in methanol with the addition of different volumes of 10−3 M methanol solution of diphenylamine. The slit widths for excitation and emission were both 5 nm. | ||
In order to better assess the selectivity for sensing aromatic amines, triethylamine was selected as the example to investigate the influence of aliphatic amines on the fluorescence signals of 1 and 2. As shown in Fig. 2, no obvious fluorescence intensities changed in the two MOFs upon adding triethylamine into the methanol suspensions of 1 and 2 (Fig. S15†). These results further demonstrate that 1 and 2 are both selectively sensitive to aromatic amines.
The sensitization of fluorescence quenching of 1 and 2 toward p-nitroaniline were further investigated by monitoring the fluorescence responses with gradually increased p-nitroaniline concentrations. It can be clearly seen from Fig. 4, the concentrations of p-nitroaniline have a remarkable influence on the fluorescence intensities of 1 and 2. When the concentration of p-nitroaniline was 10−2 mol L−1, the quenched efficiency of 1 is about 96.74% and 2 is about 87.68% with the addition amount of p-nitroaniline only 100 μL. With the concentration of p-nitroaniline decreasing from 10−3 to 10−5 mol L−1, the fluorescence intensities of 1 and 2 quickly decreases. Comparatively, compound 1 has the higher sensitivity to p-nitroaniline. To further study the relationship between the p-nitroaniline concentration and quenching effect, a plot of the fluorescence intensity versus p-nitroaniline concentration was made, which can be well fitted by the Stern–Volmer equation (inset of Fig. 4).
 | ||
| Fig. 4 The fluorescence spectra of 1 (a) and 2 (b) in methanol solutions containing p-nitroaniline of different concentrations. The slit widths for excitation and emission were both 5 nm. The inset is Stern–Volmer plot of 1 and 2 quenched by p-nitroaniline methanol solution. | ||
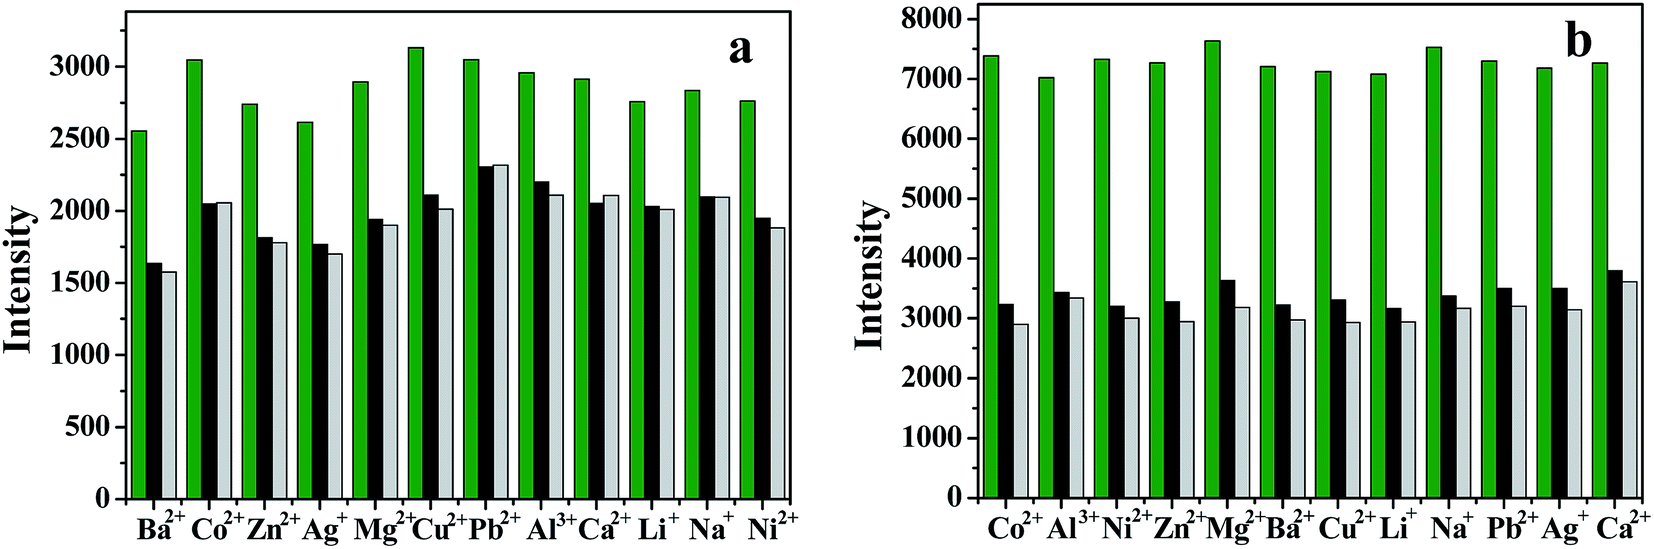
In addition, the recyclable capacity is very important for evaluating the sensing performance of a MOF in practical applications. Therefore, to design a new experimental sensor setup to satisfy the fast and simple regeneration is necessary. Herein, we prepared the firm sheet of 1 and 2, respectively, to the quartz slide through a double-sided conductive adhesive and recorded the fluorescence intensity changes after inserting in the p-nitroaniline solution (10−3 M). The recyclability for sensing of p-nitroaniline was determined by simply washing with fresh solvent. It is noteworthy that the initial fluorescence intensity and the quenching efficiency did not change much over ten repeated cycles for 1 and 2, respectively (Fig. 5). The PXRD and IR spectra were performed to confirm that the framework is retained after ten recycles (Fig. S16 and S17†). The experimental results clearly reveal that compounds 1 and 2 as sensors can be reused at least ten times by a simple method, showing the promising practical applications.
 | ||
| Fig. 5 Recyclability test on 1 (a) and 2 (b). Fluorescence was recovered by simply washing with fresh solvent. p-Nitroaniline was used as a model analyte. Green bar: emission of sample before sensing of p-nitroaniline. Gray bar: emission of sample after sensing of p-nitroaniline. | ||
3.3 Detection of metal ions
In order to study the selectivity of the sensing for various metal ions, the fluorescence spectra of 1 and 2 dispersed in methanol solutions containing the same concentrations of M(NO3)x (M = Na+, Li+, Ag+, Ca2+, Zn2+, Ni2+, Co2+, Ba2+, Mg2+, Cu2+, Pb2+, Al3+ and Fe3+) were studied. As well, the corresponding fluorescence curves still show the four characteristic emission peaks of Eu3+ and Tb3+ ions, but only the highest emission peaks were monitored. As shown in Fig. 6, the fluorescence responses of 1 and 2 are both heavily dependent on the species of metal ions. Notably, Fe3+ ions produce a drastic quenching effect on the fluorescence of 1 and 2, while other metal ions have no or slight effect on the emissions. The detailed fluorescence quenching efficiency of different metal ions of 1 and 2 is shown in Fig. S18–S30.† These results demonstrate that 1 and 2 both have high selectivity for the detection and recognition of Fe3+ ions compared to other metal ions. | ||
| Fig. 6 Percentage of fluorescence quenching of 1 (a) and 2 (b) interacting with different metal ions in 10−3 M methanol solution of M(NO3)x. The slit width for both excitation and emission was 5 nm. | ||
As is known, as a chemosensor, the sensing ability and selectivity are susceptible to the interference of other metal ions. Therefore, it is beneficial to explore the effect of mixed cations on the emission. The detailed experiments were described as follows: 200 μL of Fe3+ (1 × 10⁻³ M) and 100 μL of methanol solutions of other cations (1 × 10⁻³ M) were slowly dropped into the suspension of 1 in methanol, respectively. The fluorescence intensity of the resultant suspensions was measured and is recorded in Fig. 7. Strikingly, the fluorescence quenching effect of Fe3+ ion on 1 and 2 show no significant changes after adding the different mixed metal ions, indicating the presence of other metal ions did not disturb the detection of Fe3+ ions.
 | ||
| Fig. 7 Competitive binding studies of the different metal ions on 1 (a) and 2 (b): the green bars represent the fluorescence intensity of MOFs in methanol solution before sensing of metal ions. The black bars represent the fluorescence intensity of MOFs in methanol solution and 0.1 μmol (10−3 M, 200 μL) Fe3+. The gray bars represent the fluorescence intensity of MOFs in methanol solution, 0.2 μmol (10−3 M, 200 μL) Fe3+ and 0.1 μmol (10−3 M, 100 μL) other metal ions. | ||
For better understanding the fluorescence responses of 1 and 2 to Fe3+ ions, we also examined the quenching effect with different concentrations of Fe3+ ions ranging from 10−2 to 10−5 mol L−1. As a matter of fact, both 1 and 2 exhibit obvious responses with increasing the concentration of Fe3+ ions. As illustrated in Fig. 8, the fluorescence intensity of 1 at 617 nm is quenched by 72.53% at a Fe(NO3)3 concentration of 10−2 mol L−1. For 2, the emission intensity decreases faster than Eu3+, the maximum emission intensity of Tb3+ at 546 nm is almost completely quenched with the same concentration of 10−2 mol L−1. The results illustrate that the concentrations of Fe3+ have a positive effect on the extent of fluorescence quenching. Moreover, 2 has the more sensitive selectivity to Fe3+ ions. The relationships between the fluorescence intensities of the two MOFs and the concentration of Fe3+ ions are in good agreement with the first-order exponential equations (inset of Fig. 8). All the results demonstrate that 1 and 2 are reliable and efficient fluorescence sensors for detection Fe3+ ions with high sensitivity and selectivity.
 | ||
| Fig. 8 The fluorescence spectra of 1 (a) and 2 (b) in methanol solutions containing Fe(NO3)3 of different concentrations. The slit width for both excitation and emission was 5 nm. The inset is Stern–Volmer plot of 1 and 2 quenched by Fe3+ methanol solution. | ||
4. Conclusions
In summary, two lanthanide luminescent metal–organic frameworks were synthesized under hydrothermal condition by introducing the 2,5-thiophenedicarboxylic acid (H2L). In the two MOFs, the characteristic emission bands of Eu3+ and Tb3+ ions are observed respectively. Fluorescence sensing studies show that 1 and 2 display high-sensitivity fluorescence sensing functions to aromatic amines, particularly p-nitroaniline and diphenylamine. Importantly, 1 and 2 as the fluorescence probes of p-nitroaniline can be simply and quickly regenerated. Additionally, both 1 and 2 can be used to detect Fe3+ ions without the interference of other metal ions. Thus, this work may provide a facile route of designing multifunctional Ln-MOFs to be utilized in the field of fluorescent sensors.Acknowledgements
This project is supported by NSFC (Grant no. 21271138, 21403193) and the NSF of Tianjin (No. 14JCYBJC17500, 14JCQNJC02500), the State Key Laboratory of Inorganic Synthesis and Preparative Chemistry of Jilin University (No. 2015-02), the Science and Technology Plans of Tianjin (No. 15PTSYJC00230).References
- (a) Y. X. Guo, X. Feng, T. Y. Han, S. Wang, Z. G. Lin, Y. P. Dong and B. Wang, J. Am. Chem. Soc., 2014, 136, 15485–15488 CrossRef CAS PubMed; (b) B. Wang, X. L. Lv, D. Feng, L. H. Xie, J. Zhang, M. Li, Y. Xie, J. R. Li and H. C. Zhou, J. Am. Chem. Soc., 2016, 138, 6204–6216 CrossRef CAS PubMed; (c) F. Q. Wang, C. M. Wang, Z. C. Yu, Q. G. He, X. Y. Li and C. L. Shang, RSC Adv., 2015, 5, 70086–70093 RSC.
- (a) L. M. Games and R. A. Hites, Anal. Chem., 1977, 49, 1433–1440 CrossRef CAS; (b) J. L. Wang, G. D. Wang, G. A. S. Ansari and M. F. Khan, Toxicol. Appl. Pharmacol., 2008, 230, 227–234 CrossRef CAS PubMed; (c) F. Q. Wang, C. F. Dong, C. M. Wang, Z. C. Yu, S. K. Guo, Z. C. Wang, Y. N. Zhao and G. D. Li, New J. Chem., 2015, 39, 4437–4444 RSC.
- (a) C. Q. Zhang, Y. Yan, Q. H. Pan, L. B. Sun, H. M. He, Y. L. Liu, Z. Q. Liang and J. Y. Li, Dalton Trans., 2015, 44, 13340–13346 RSC; (b) H. Xu, H. C. Hu, C. S. Cao and B. Zhao, Inorg. Chem., 2015, 54, 4585–4587 CrossRef CAS PubMed.
- (a) Z. C. Yu, F. Q. Wang, X. Y. Lin, C. M. Wang, Y. Y. Fu, X. J. Wang, Y. N. Zhao and G. D. Li, J. Solid State Chem., 2015, 232, 96–101 CrossRef CAS; (b) Z. C. Hu, W. P. Lustig, J. M. Zhang, C. Zheng, H. Wang, S. J. Teat, Q. H. Gong, N. D. Rudd and J. Li, J. Am. Chem. Soc., 2015, 137, 16209–16215 CrossRef CAS PubMed; (c) R. M. Wang, X. B. Liu, A. Huang, W. Wang, Z. Y. Xiao, L. L. Zhang, F. N. Dai and D. F. Sun, Inorg. Chem., 2016, 55, 1782–1787 CrossRef CAS PubMed; (d) D. M. Chen, X. Z. Ma, W. Shi and P. Cheng, Cryst. Growth Des., 2015, 15, 3999–4004 CrossRef CAS; (e) T. K. Pal, N. Chatterjee and P. K. Bharadwaj, Inorg. Chem., 2016, 55, 1741–1747 CrossRef CAS PubMed.
- (a) P. F. Shi, H. C. Hu, Z. Y. Zhang, G. Xiong and B. Zhao, Chem. Commun., 2015, 51, 3985–3988 RSC; (b) H. Xu, C. S. Cao and B. Zhao, Chem. Commun., 2015, 51, 10280–10283 RSC.
- (a) X. Y. Xu and B. Yan, Sens. Actuators, B, 2016, 222, 347–353 CrossRef CAS; (b) Y. Kang, X. J. Zheng and L. P. Jin, J. Colloid Interface Sci., 2016, 471, 1–6 CrossRef CAS PubMed.
- (a) J. M. Zhou, W. Shi, N. Xu and P. Cheng, Inorg. Chem., 2013, 52, 8082–8290 CrossRef CAS PubMed; (b) H. Weng and B. Yan, Sens. Actuators, B, 2016, 228, 702–708 CrossRef CAS; (c) F. Y. Chen, Y. J. Ling, C. L. Song, Y. B. He, Y. Z. Lan and Y. L. Feng, Eur. J. Inorg. Chem., 2016, 2016, 503–508 CrossRef CAS.
- (a) Y. Y. Fu, W. Xu, Q. G. He and J. G. Cheng, Sci. China: Chem., 2016, 59, 3–15 CrossRef CAS; (b) M. Jurcic, W. J. Peveler, C. N. Savory, D. O. Scanlon, A. J. Kenyone and I. P. Parkin, J. Mater. Chem. A, 2015, 3, 6351–6359 RSC.
- (a) J. Z. Wang, W. Sun, S. Y. Chang, H. T. Liu, G. N. Zhang, Y. Q. Wang and Z. L. Liu, RSC Adv., 2015, 5, 48574–48579 RSC; (b) A. Buragohain, M. Yousufuddin, M. Sarma and S. Biswas, Cryst. Growth Des., 2016, 16, 842–851 CrossRef CAS; (c) J. Q. Liu, J. Wu, F. M. Li, W. C. Liu, B. H. Li, J. Wang, Q. L. Li, R. Yadav and A. Kumar, RSC Adv., 2016, 6, 31161–31166 RSC.
- (a) B. Liu, W. P. Wu, L. Hou and Y. Y. Wang, Chem. Commun., 2014, 50, 8731–8734 RSC; (b) J. Zhao, Y. N. Wang, W. W. Dong, Y. P. Wu, D. S. Li and Q. C. Zhang, Inorg. Chem., 2016, 55, 3265–3271 CrossRef CAS PubMed; (c) X. Z. Song, S. Y. Song, S. N. Zhao, Z. M. Hao, M. Zhu, X. Meng, L. L. Wu and H. J. Zhang, Adv. Funct. Mater., 2014, 24, 4034–4041 CrossRef CAS.
- (a) X. Shen and B. Yan, J. Colloid Interface Sci., 2015, 451, 63–68 CrossRef CAS PubMed; (b) Q. X. Yao, A. B. Gómez, J. Su, V. Pascanu, Y. F. Yun, H. Q. Zheng, H. Chen, L. F. Liu, H. N. Abdelhamid, B. Martín-Matute and X. D. Zou, Chem. Mater., 2015, 27, 5332–5339 CrossRef CAS; (c) X. Yan and B. Yan, RSC Adv., 2016, 6, 11570–11576 RSC; (d) K. M. Wang, L. Du, Y. L. Ma, J. S. Zhao, T. Yan and Q. H. Zhao, CrystEngComm, 2016, 18, 2690–2700 RSC; (e) Y. L. Hou, H. Xu, R. R. Cheng and B. Zhao, Chem. Commun., 2015, 51, 6769–6772 RSC.
- (a) Y. F. Li, D. Wang, Z. Liao, Y. Kang, W. H. Ding, X. J. Zheng and L. P. Jin, J. Mater. Chem. C, 2016, 4, 4211–4217 RSC; (b) J. W. Wu, H. B. Zhang and S. W. Du, J. Mater. Chem. C, 2016, 4, 3364–3374 RSC.
- X. L. Zhao, D. Tian, Q. Gao, H. W. Sun, J. Xu and X. H. Bu, Dalton Trans., 2016, 45, 1040–1046 RSC.
- J. L. Chen, F. Y. Yi, H. Yu, S. H. Jiao, G. S. Pang and Z. M. Sun, Chem. Commun., 2014, 50, 10506–10509 RSC.
- W. Huang, D. Y. Wu, P. Zhou, W. B. Yan, D. Guo, C. Y. Duan and Q. J. Meng, Cryst. Growth Des., 2009, 9, 1361–1369 CAS.
Footnote |
| † Electronic supplementary information (ESI) available: The PXRD and the simulated PXRD pattern of 1 (Fig. S1); the PXRD patterns of 1 and 2 (Fig. S2); IR spectra of 1 and 2 (Fig. S3); TGA of 1 and 2 (Fig. S4); the fluorescence spectra of 1, 2 and L ligand in the solid state (Fig. S5–S7); emission spectra of 1 and 2 in different organic solvent at room temperature (Fig. S8 and S9); fluorescence titration of 1 and 2 dispersed in methanol with the addition of different volumes of 10−3 M methanol solution of aromatic amines (Fig. S10–S15); the powder X-ray diffraction and IR spectra of 1 and 2 before and after the fluorescence titration (Fig. S16 and S17); fluorescence titration of 1 and 2 dispersed in methanol with the addition of different volumes of 10−3 M methanol solution containing different metal ions (Fig. S18–S30). See DOI: 10.1039/c6ra18336k |
| This journal is © The Royal Society of Chemistry 2016 |