
Fluorescent pH nanosensor based on carbon nanodots for monitoring minor intracellular pH changes
Afsaneh Safavi*a,
Raheleh Ahmadia,
Zahra Mohammadpoura and
Jie Zhoub
aDepartment of Chemistry, College of Sciences, Shiraz University, Shiraz, 7194684795, Iran. E-mail: safavi@susc.ac.ir; Fax: +98 713 6460724; Tel: +98 713 6137150
bDepartment of Chemistry, Brandeis University, 415 South Street, Waltham, Massachusetts 02453, USA
First published on 11th October 2016
Abstract
In this work, fluorescent unmodified carbon nanodots (CDs) were used as a biocompatible, sensitive, selective and reversible intracellular pH nanosensor. This sensor showed a linear response towards pH changes in the physiological pH range of 6.1–7.8 and could resolve pH differences of 0.1 units. The pH of a commercial solution of Roswell Park Memorial Institute medium (RPMI 1640) was determined by using fluorescent pH sensitive CDs. This indicates that the proposed pH nanosensor can monitor pH changes in complex media. An MTT (3-(4,5-dimethylthiazol-2-Yl)-2,5-diphenyltetrazolium bromide) assay on HeLa and HS-5 cell lines confirmed cell viability and biocompatibility of these unmodified carbon nanomaterials. A distinct fluorescence intensity change in confocal imaging supported the high pH sensitivity of CDs in living cells.
1. Introduction
Intracellular pH sensors have attracted considerable attention due to the crucial role of protonation–deprotonation in many physiological and pathological cellular processes, such as cell growth, cell proliferation, ion transport, RNA and DNA synthesis, drug resistance, enzymatic activity, muscle contraction, and signal transduction.1–5 In addition, intracellular pH changes can strongly affect the structure and function of proteins.4 The normal physiological pH range for these cellular functions is narrow (7.4 ± 0.05).6 Deviation from the normal physiological pH values by 0.1–0.2 pH units may cause neurological and cardiopulmonary problems such as cancers, inflammation, and Alzheimer's disease.6–8 Therefore, to understand cellular functions and diagnose many important diseases, accurate monitoring of pH variations in living cells is desirable.Different approaches to monitoring intracellular pH changes, including nuclear magnetic resonance (NMR), proton-permeable microelectrodes, absorbance spectroscopy, and fluorescence imaging and spectroscopy, have been described in the literature.8–10 Among these methods, much attention has been paid to fluorescence imaging and spectroscopy, because of their practical and technical benefits such as simplicity, rapidity, high sensitivity, excellent temporal and spatial resolution, high signal-to-noise ratio, applicability to a wide variety of living cells, and minimal damage to living samples.3,9,11
A wide variety of intracellular pH sensors based on organic dyes supported on silica nanoparticles,12 fluorescent proteins conjugated to semiconductor quantum dots (QD),13 and fluorogenic dyes covalently bound to upconverting nanoparticles14 or hyperbranched polyethyleneimine (PEI)-capped silver nanoclusters15 have been reported. In these cases, the pH indicator system has been grafted to the surface of the nanoparticles through a post-conjugation process. This post-functionalization step complicates the probe preparation and affects the simplicity of working procedure. Semiconductor QDs10,16 are also responsive to pH changes. However, the main concern with using QDs is their toxicity, which limits their practical use in cellular environments.
Carbon nanodots (CDs) have attracted intense interest in several fields of analytical and bioanalytical chemistry, biomedicine, and optoelectronic devices.11,17,18 Along with their excellent optical properties, the main advantage of CDs for biological applications is their high biocompatibility and low cytotoxicity, which makes them superior to conventional semiconductor QDs.17 The chemical stability, wide variety of low cost synthetic protocols and lack of photo bleaching also make CDs promising candidates for diverse analytical and biological applications.11,17,18
There are few reports on CD-based pH sensors in the literature.7,18–22 Similar to nanoparticle-supported systems, CDs can function as a carrier for organic dyes and polymers.7,19,22,23 In other CDs-based systems, where the fluorescence signal of CDs was directly monitored with pH change, the spectral resolution was 1.0 or 0.5 units. The low pH resolution in these reports makes these sensors unsuitable for monitoring minor intracellular pH changes.7,18,21,22 A vital feature of a proper intracellular pH sensor is to resolve pH differences by about 0.1–0.2 pH units. Partial deviation from normal physiological pH values causes many pathological problems.6,7 In the present work, CDs obtained by a facile, scalable synthesis were demonstrated to be highly sensitive to minor pH changes in the physiological pH range. The CDs were synthesized with a straightforward protocol with no surface post-functionalization and treatment. The unique feature of this nanosensor is its ability to resolve pH differences of 0.1 pH units in the physiological pH range of 6.1–7.8. An MTT (3-(4,5-dimethylthiazol-2-Yl)-2,5-diphenyltetrazolium bromide) assay and confocal fluorescence microscopy revealed the biocompatibility and application of these CDs in intracellular pH sensing. To the best of our knowledge, the pH resolution of this system is much better than most of the previously reported CDs-based pH sensors.7,9,21
2. Experimental section
2.1 Reagents
All chemicals were analytical reagent grade. Thiomalic acid (C4H6O4S), sulfuric acid (H2SO4, 98%), ammonium hydroxide (NH4OH, 25%), sodium dihydrogen phosphate monohydrate (NaH2PO4·H2O, 99%), and disodium hydrogen phosphate dihydrate (Na2HPO4·2H2O, 99.5%) were supplied by Merck. Dichloromethane (DCM) was obtained from Riedel-de Haën. Roswell Park Memorial Institute medium (RPMI 1640) was purchased from Gibco. HeLa (cancer cells) and normal human stromal cells (HS-5) were purchased from American Type Culture Collection (ATCC). Phosphate buffer solutions (PBS) with different pH values and concentrations were prepared from NaH2PO4·H2O and Na2HPO4·2H2O (0.01, 0.05, 0.1 and 0.2 M). Deionized distilled water was used throughout the experiments.2.2 Apparatus
All fluorescence measurements were performed using a spectrofluorometer (LS-50B, PerkinElmer) and a 1 cm quartz cuvette. A pH meter (827, Metrohm) was used for pH measurements. Transmission electron microscopy (TEM) was performed with a transmission electron microscope (CM10, Philips). X-ray diffraction (XRD) was conducted on a diffractometer (D/max-3C, Rigaku) with Cu-Kα radiation. Powder XRD patterns were taken with a step size of 0.02° and 1 s per step. X-ray photoemission spectroscopy (XPS) measurements were performed with a twin anode X-ray source (XR3E2, VG Microtech) using 1486.6 eV Al-Kα radiation. Fourier transform infrared spectroscopy (FTIR) was conducted on a FTIR spectrometer (Spectrum RX I, PerkinElmer). The MTT assay for cell viability was done using a multimode detector (DTX 880, Beckman Coulter). Confocal images were obtained on a spectral confocal microscope (TCS SP2, Leica).2.3 Synthesis of CDs
The CDs were synthesized as reported previously.24 Thiomalic acid (150 mg) was mixed with concentrated sulfuric acid (5 mL) in a 50 mL round bottom flask and the mixture was refluxed at 90 °C for 4 h. The mixture was allowed to cool gradually to room temperature, and then slowly poured into ice water (20 mL). DCM was used to extract the product (Pre-CDs) from the concentrated H2SO4. After evaporating the DCM at low temperature, excess ammonium hydroxide (50 mL, 25%) was added to the dried Pre-CDs and the mixture was left to stand for 24 h. By this time, CDs were produced by the polymerization of Pre-CDs. The product was obtained as a pale yellow solid by evaporation of ammonia at 60 °C in a vacuum oven.2.4 Fluorescence pH assay in buffer solutions
The stock solution of CDs (2 mg mL−1) was filtered with a syringe filter (pore size 0.2 μm). Different concentrations (0.01, 0.05, 0.1, and 0.2 M) of pH buffers were prepared using NaH2PO4/Na2HPO4. For each measurement, CDs stock solution (4 μL) was injected into the buffer solution (3 mL). The solution pH was adjusted to different values (5.0–8.6) in 0.1 unit intervals and the fluorescence spectra of CDs at variable pH values were measured at λex = 310 nm and λem = 420 nm. Similar analyses were performed for all buffer concentrations.2.5 MTT assays
HeLa cancer cells and HS-5 cells were exposed to concentrations of CDs from 100 to 500 μg mL−1. A 96-well plate (Cell Treat) was seeded with 1 × 10⁴ (cells per well) Hela cells with minimum essential medium (MEM) as the medium (100 μL) supplemented with 10% fetal bovine serum (FBS), 100 U mL−1 penicillin and 100 μg mL−1 streptomycin. HeLa cells were attached to the bottom of the 96-well plate after 12 h of incubation at 37 °C and 5% CO2. The medium was replaced with fresh growth medium (100 μL) that contained different concentrations of CDs and the cells were incubated at 37 °C and 5% CO2 for an additional 72 h. The viability of HeLa cells was measured for 3 days. In that time period, MTT (10 μL, 0.5 mg mL−1) was added to the wells every 24 h, followed by 0.1% sodium dodecyl sulfate (SDS; 100 μL) 4 h later. The assay results were collected after 24 h incubation. Reduction of MTT by mitochondrial reductase in living cells led to the formation of purple formazan. The solution absorbance at 595 nm was measured with a DTX 880 Multimode Detector. MEM medium was the blank and the untreated HeLa cells were the control. The absorbance value of the untreated cells minus that of the blank was defined as 100%. Each CDs concentration was measured in triplicate.2.6 Confocal microscopy
Cells in the exponential growth phase were seeded in a glass bottomed culture chamber at 2 × 10⁴ cell per well. After 12 h of attachment, cells were washed with PBS buffer three times. The images were taken immediately after the addition of CDs in live imaging solution.3. Results and discussion
3.1 Characterization of CDs
The CDs were synthesized according to a previously reported protocol.24 The size, morphology and surface functionality were characterized by TEM, XRD, XPS and FTIR analysis. The TEM image shows that the synthesized CDs were spherical nanoparticles with an average diameter of 6 nm (Fig. 1A). The XRD pattern (Fig. 1B) shows a diffraction peak located at 2θ = 23° (d = 0.39 nm), which confirms the (002) interlayer lattice spacing of CDs.21 The FTIR spectra of thiomalic acid, sulfuric acid (precursors) and CDs are shown in Fig. 1C. The peaks at 3124, 1690, 1317, 3500, 2568, 1422 and 860 cm−1 are attributed to C–H, COOH, C–O, O–H, S–H, CH2 and C–S functional groups, respectively.24 The FTIR spectrum of sulfuric acid (Fig. 1C) shows the functional groups S(O–H)2 (2958 and 1240 cm−1), O![[double bond, length as m-dash]](https://www.rsc.org/images/entities/char_e001.gif) SO (2462 cm−1), and S–(OH)2 (899 cm−1).25,26 Fig. 2A shows the full-scan XPS spectrum of CDs. The four peaks at 168, 284, 400 and 531 eV correspond to S 2p, C 1s, N 1s and O 1s, respectively. The high-resolution XPS spectrum of C 1s (Fig. 2B) displays three main binding energy peaks at 285, 286.5 and 288.3 eV, assigned to C–C, C–O and O–CO, respectively. The high-resolution O 1s spectrum of CDs in Fig. 2C confirms the presence of oxygenated groups on the surface of CDs with two peaks at 531.8 (C–O) and 534.0 eV (CO). These oxygenated functional groups on the surface of CDs, confirmed by FTIR and XPS analysis, make the CDs highly water-soluble. The S 2p scan of CDs signifies the presence of sulfur atoms inherited from the chemical structure of the precursor molecules. The deconvolution of the S 2p spectrum into four peaks at 163.2, 164.5, 168.4 and 169.6 eV, represent C–S (2p3/2), C–S (2p1/2), C–SO3 and C–SO4 bonds, respectively (Fig. 2D).27–29 The N 1s spectrum (Fig. 2E) displays three peaks at 397.6, 399.2 and 401.0 eV, which can be ascribed to H–N–(C)2, pyridinic N and N–H, respectively.30,31
SO (2462 cm−1), and S–(OH)2 (899 cm−1).25,26 Fig. 2A shows the full-scan XPS spectrum of CDs. The four peaks at 168, 284, 400 and 531 eV correspond to S 2p, C 1s, N 1s and O 1s, respectively. The high-resolution XPS spectrum of C 1s (Fig. 2B) displays three main binding energy peaks at 285, 286.5 and 288.3 eV, assigned to C–C, C–O and O–CO, respectively. The high-resolution O 1s spectrum of CDs in Fig. 2C confirms the presence of oxygenated groups on the surface of CDs with two peaks at 531.8 (C–O) and 534.0 eV (CO). These oxygenated functional groups on the surface of CDs, confirmed by FTIR and XPS analysis, make the CDs highly water-soluble. The S 2p scan of CDs signifies the presence of sulfur atoms inherited from the chemical structure of the precursor molecules. The deconvolution of the S 2p spectrum into four peaks at 163.2, 164.5, 168.4 and 169.6 eV, represent C–S (2p3/2), C–S (2p1/2), C–SO3 and C–SO4 bonds, respectively (Fig. 2D).27–29 The N 1s spectrum (Fig. 2E) displays three peaks at 397.6, 399.2 and 401.0 eV, which can be ascribed to H–N–(C)2, pyridinic N and N–H, respectively.30,31
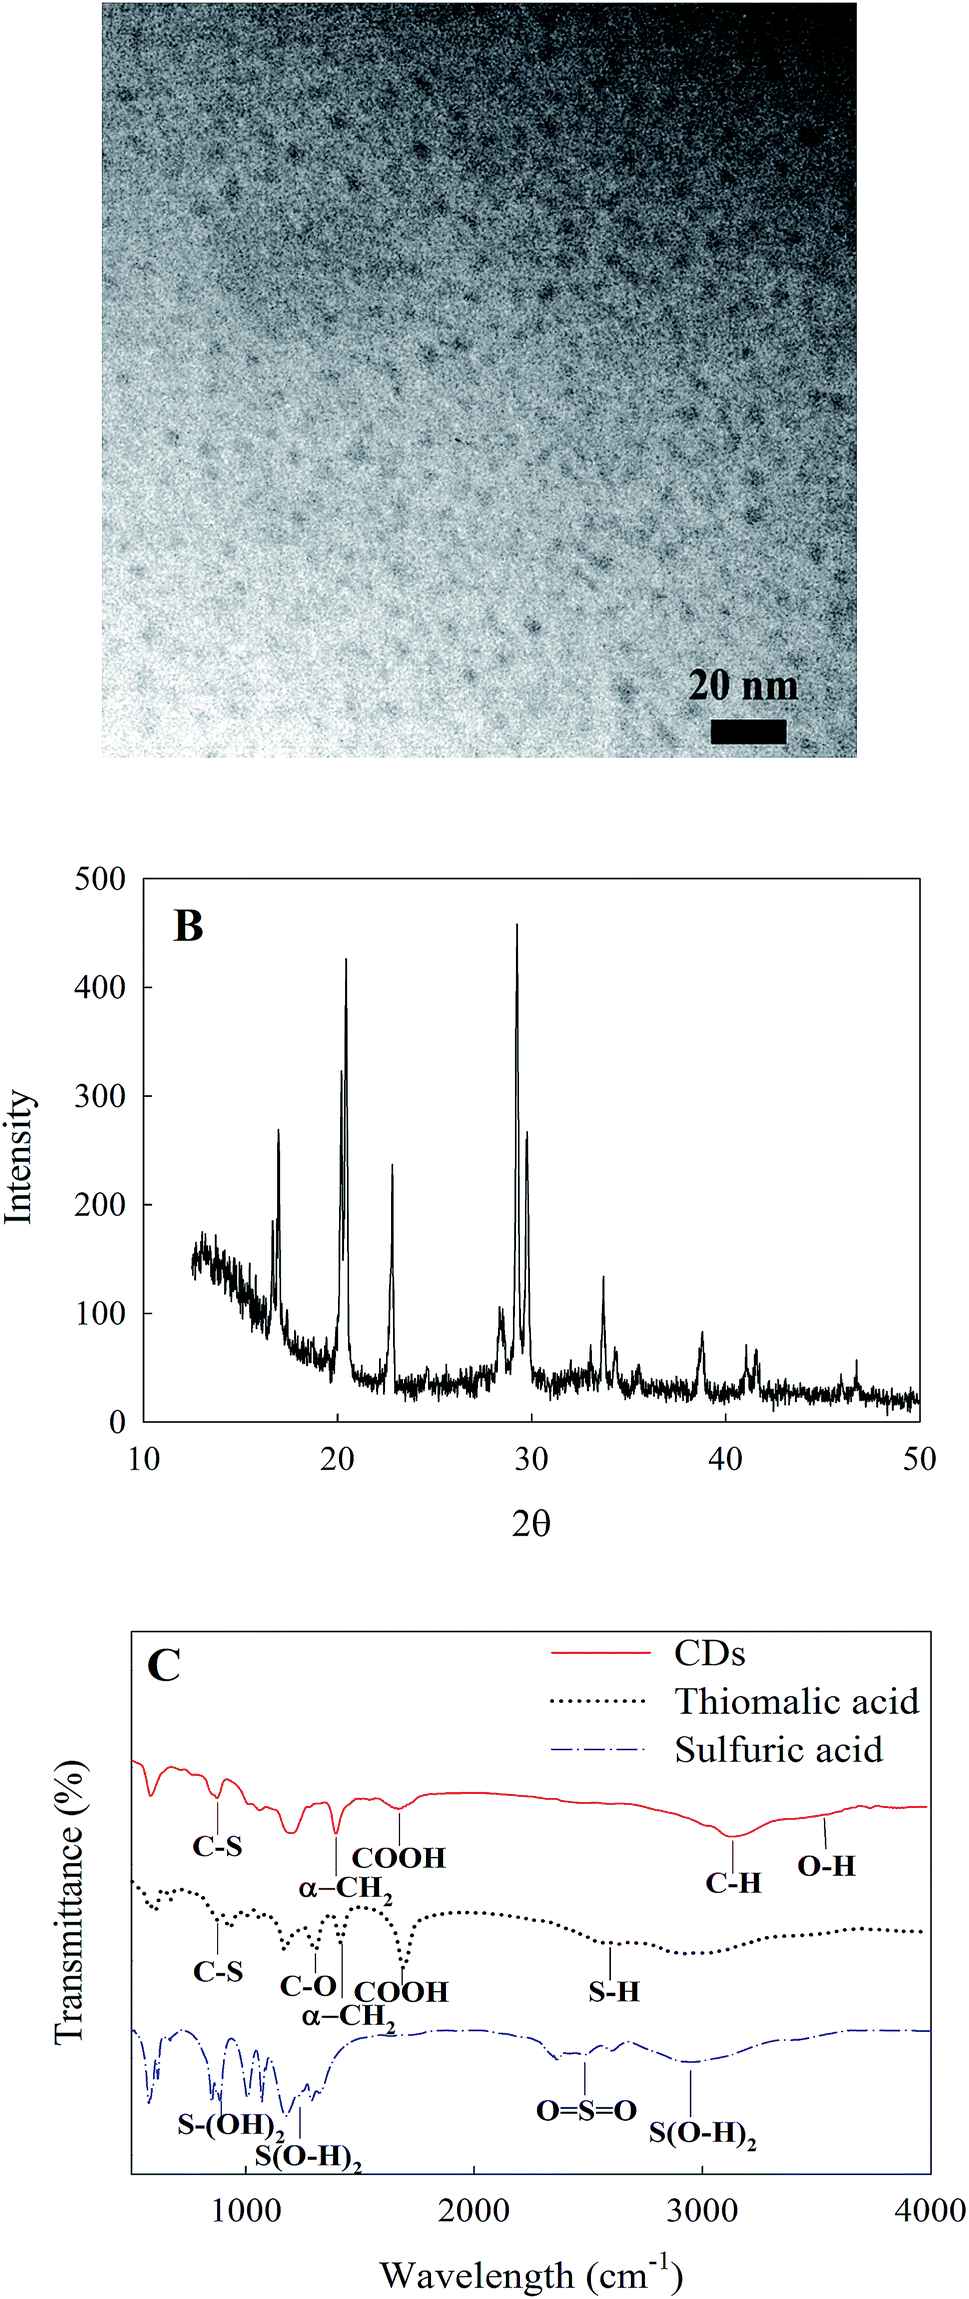 | ||
| Fig. 1 (A) TEM image, (B) XRD pattern and (C) FTIR spectra of the CDs. | ||
 | ||
| Fig. 2 (A) Full XPS scan, (B) C 1s, (C) O 1s, (D) S 2p and (E) N 1s XPS scan of the CDs. | ||
3.2 Sensitivity and selectivity of CDs fluorescence to pH
Fig. 3 shows the absorbance and fluorescence spectra of CDs. The inset of Fig. 3 shows the distinct blue luminescence of CDs aqueous solution under UV irradiation (λex = 366). The maximum absorption wavelength of CDs at 300 nm coincides well with their excitation wavelength at 310 nm. The emission wavelength of CDs did not change at different excitation wavelengths. This behaviour has been previously reported for CDs32 and is possibly caused by the lack of surface states.33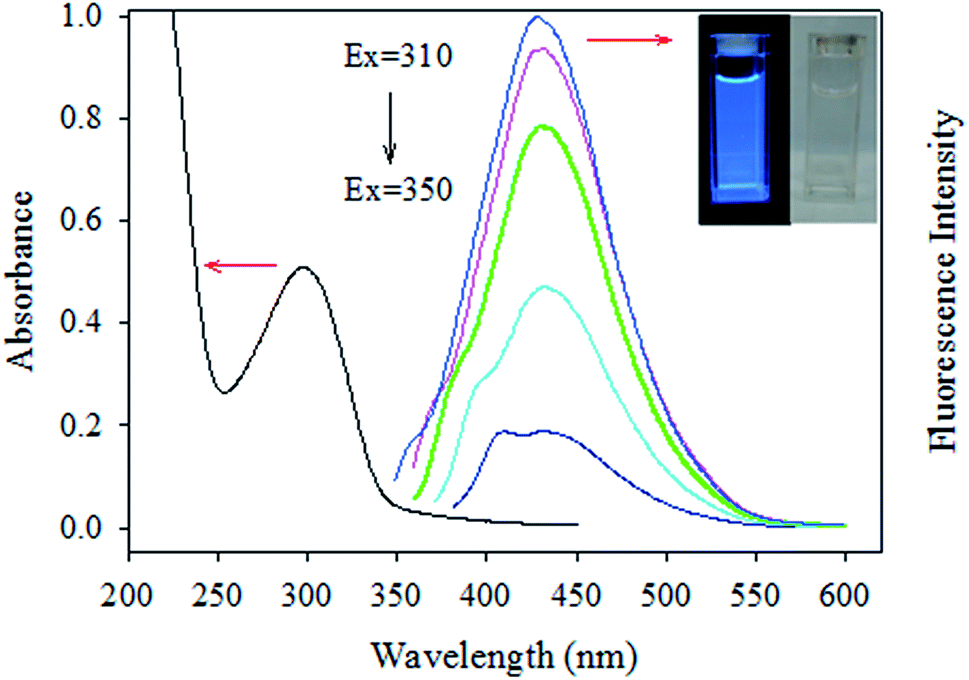 | ||
| Fig. 3 Absorbance- and excitation-dependent fluorescence emission of CDs with excitation wavelengths from 310 to 350 nm. Inset shows photographs of an aqueous dispersion of CDs under visible light (right) and a UV lamp with an excitation wavelength of 366 nm (left). | ||
Increasing the pH from 5 to 8.6 caused a dramatic increase in the fluorescence intensity of CDs of ∼4-fold accompanied by a slight red shift of about 2–4 nm (Fig. 4A). Excellent linearity and sensitivity was observed in the physiological pH range of 6.1–7.8 (Fig. 4B). The ability of this nanosensor to resolve pH differences of 0.1 pH units in the physiological pH range (6.1–7.8) makes it valuable for practical applications.
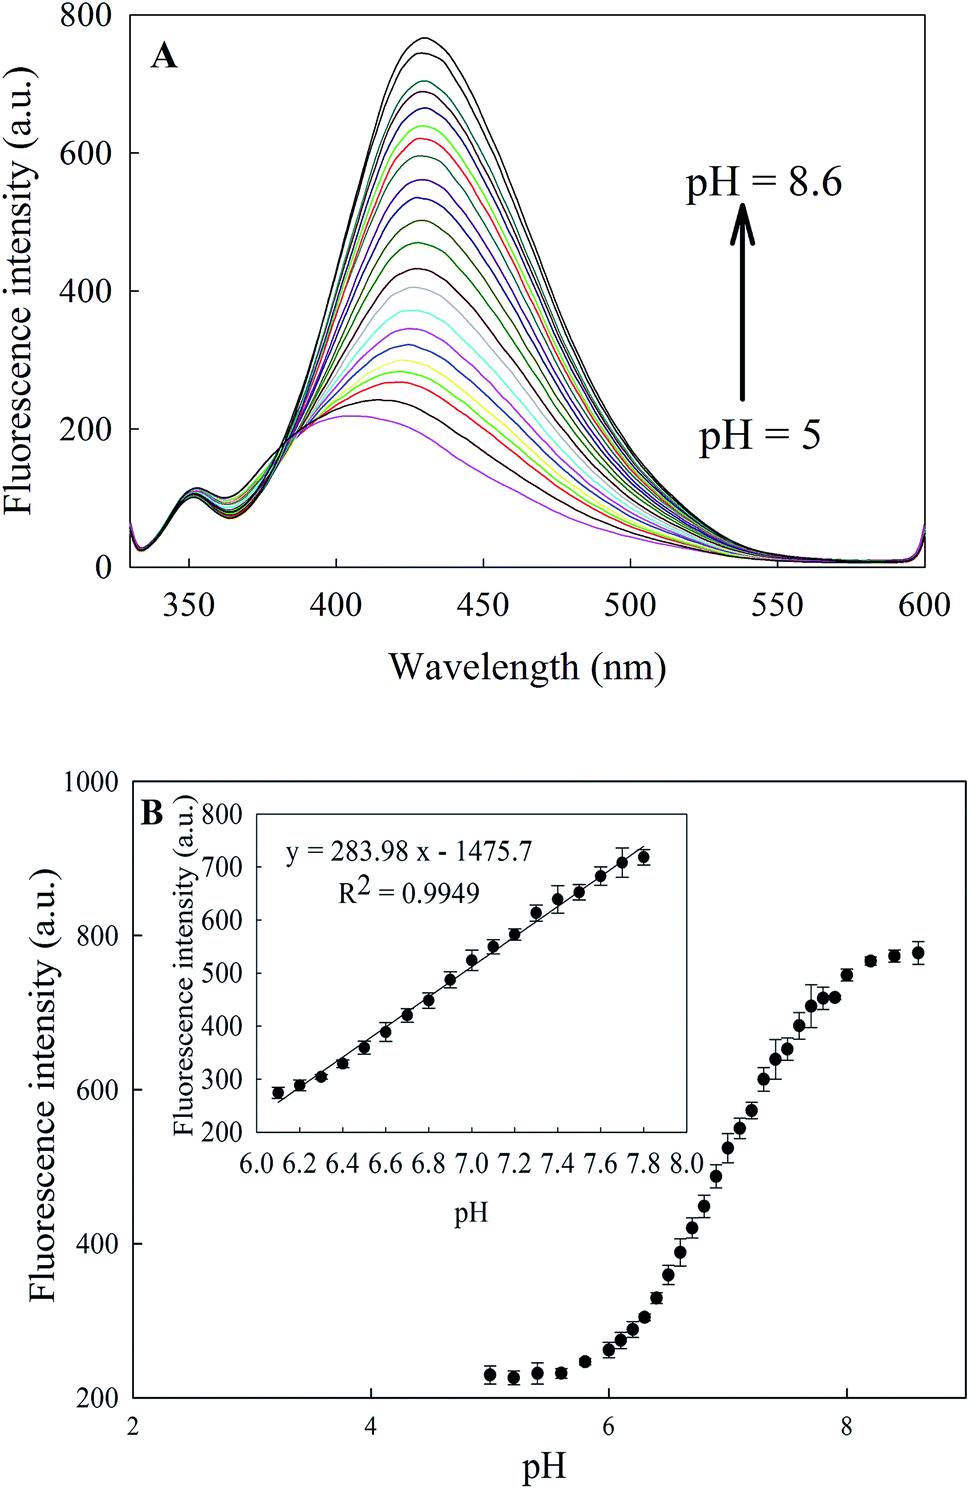 | ||
| Fig. 4 (A) Fluorescence spectra of CDs at 310 nm excitation for different pH values. (B) Relationship between the fluorescence intensity and pH in the whole range of 5–8.6. The inset shows the linear relationship between the fluorescence intensity of CDs at 310 nm excitation and pH variation in the physiological pH range 6.1–7.8. | ||
There is uncertainty about the pH sensitivity of CDs based on the previous findings. Some models have been proposed, but no mechanism for this behaviour has been established yet. Kong et al.34 suggested that OH− and H+ can passivate and recreate surface defects on CDs, respectively, which can change the fluorescence emission. Jia et al.35 proposed that protonation and deprotonation of the carboxyl groups on the surface of the CDs may cause electrostatic charging of the CDs and shift of the Fermi level. Zheng et al.36 suggested that when pH increases, deprotonation of carboxylic groups occurs on the surface of the CDs and a protective shell with a negative charge that has a lower non-radiative recombination rate is formed gradually on the CDs surface.
To investigate the effect of ionic strength, the fluorescence of the CDs was monitored in PBS with different concentrations (0.01, 0.05, 0.1 and 0.2 M). The ionic strength has a negligible effect on the fluorescence intensities of CDs in the pH range of 6.1–7.8 (Fig. 5). This is advantageous because the pH response of the nanosensor is independent of ionic species, even at high concentrations.
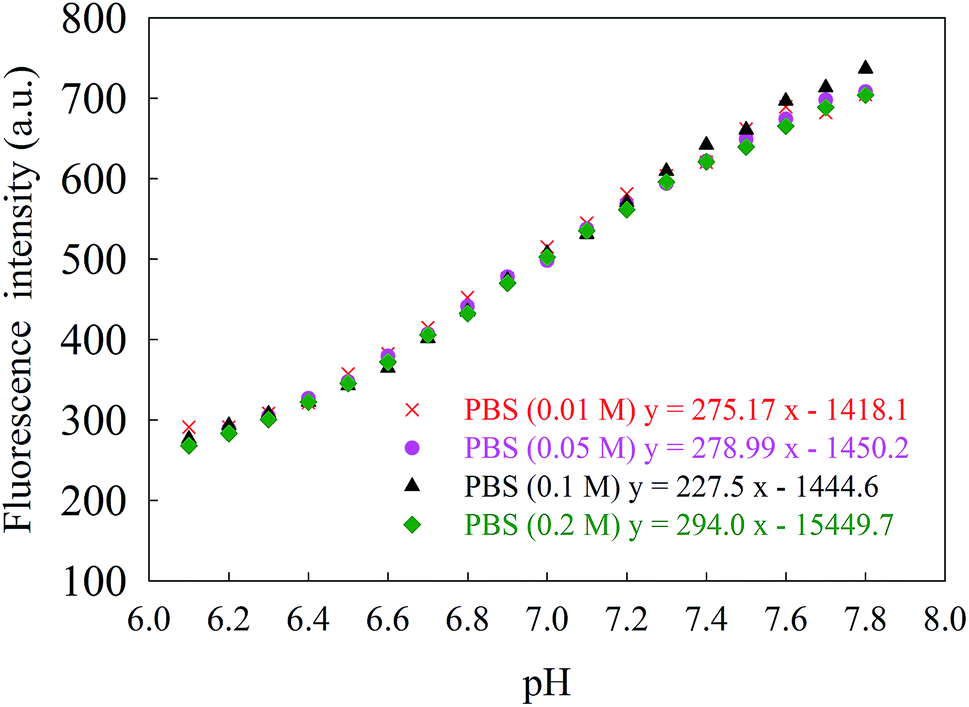 | ||
| Fig. 5 Linear relationship between the fluorescence intensity of CDs and physiological pH range of 6.1–7.8 in different concentrations of PBS (λex = 310 nm, λem = 420 nm). | ||
The pH reversibility of the proposed nanosensor was tested on a single solution of CDs in PBS buffer. The pH value of CDs in PBS (0.05 M) was switched from 6.1 to 7.8 and adjusted back to 6.1 10 times. The pH adjustment to the extreme values was performed using concentrated NaOH/HCl solutions. The reproducibility of the CDs fluorescence signal for pH changes is shown in Fig. 6. This result demonstrates the excellent pH reversibility and robustness of the pH sensor, even after 10 cycles.
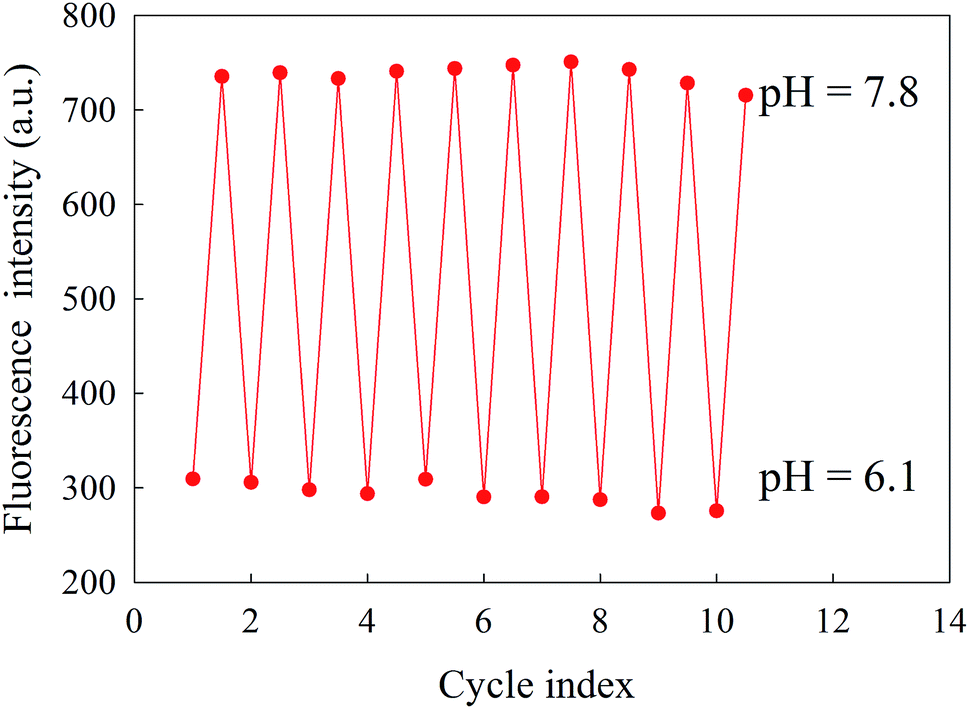 | ||
| Fig. 6 pH reversibility of CDs between pH 6.1 and 7.8. | ||
Because intracellular media is a complex mixture of various ions and biomolecules, it is important for a pH sensor to be robust to interferences. Therefore, selectivity is a fundamental feature required for intracellular pH sensors. The selectivity was checked in the presence of different ions and biomolecules that usually coexist in the intracellular media. They showed negligible effects on the response of this nanosensor, even with higher concentrations than in the intracellular medium (Fig. 7).
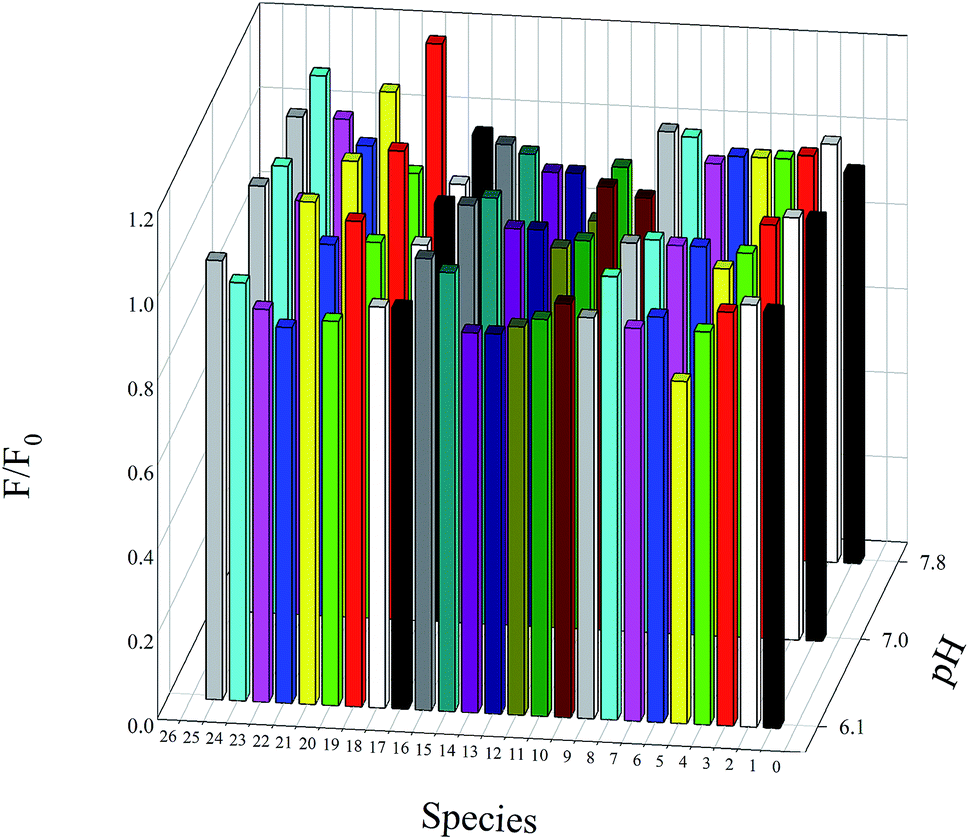 | ||
| Fig. 7 Interference study of the CDs as pH nanosensors at pH 6.1, 7 and 7.8. The fluorescence intensity of the CDs in the presence of foreign species was normalized by the fluorescence intensity of the blank (CDs with no interfering species) at the same pH. The foreign species are as follows: 1, Mn2+ (0.1 mM); 2, Mg2+ (0.1 mM); 3, Zn2+ (0.1 mM); 4, K+ (0.1 mM); 5, Cu2+ (0.1 mM); 6, Ca2+ (0.1 mM); 7, Ni2+ (0.1 mM); 8, Pb2+ (0.1 mM); 9, Cd2+ (0.1 mM); 10, Ag+ (0.1 mM); 11, Fe2+ (0.1 mM); 12, Fe3+ (0.1 mM); 13, Na+ (100 mM); 14, Cl− (100 mM); 15, glucose (5 mM); 16, histidine (1 mM); 17, glutamine (1 mM); 18, cysteine (1 mM); 19, tyrosine (0.5 mM); 20, glutathione (0.5 mM); 21, lysine (1 mM); 22, ascorbic acid (0.5 mM); 23, glycine (1 mM); 24, arginine (1 mM); BSA (68 mg mL−1). | ||
3.3 Real sample analysis
The practical use of CDs as an intracellular pH nanosensor was verified using a simulated intracellular medium (commercial solution of RPMI 1640). RPMI 1640 is a medium used in cell and tissue cultures.10 RPMI 1640 was diluted 50-fold with PBS (0.05 M). To determine the pH value with the nanosensor, CDs stock solution (4 μL, 2 mg mL−1) was added to dilute RPMI 1640 (3 mL) and the pH value of each sample was adjusted according to a pH meter. The fluorescence intensity was measured and the corresponding pH was determined by interpolating the average fluorescence intensity within the corresponding calibration plot. The results showed excellent agreement between the pH values obtained by the pH nanosensor and a conventional pH glass electrode (Table 1).| Sample | pH meter values (pH ± SD) | pH obtained by CD fluorescence (pH ± SD) |
|---|---|---|
RPMI 1640 (dilution 1![[thin space (1/6-em)]](https://www.rsc.org/images/entities/char_2009.gif) :50) :50) |
6.40 ± 0.01 | 6.51 ± 0.03 |
| 6.60 ± 0.02 | 6.70 ± 0.06 | |
| 6.80 ± 0.01 | 6.87 ± 0.03 | |
| 7.00 ± 0.02 | 7.07 ± 0.01 | |
| 7.20 ± 0.02 | 7.30 ± 0.07 | |
| 7.40 ± 0.01 | 7.47 ± 0.07 | |
| 7.60 ± 0.01 | 7.66 ± 0.06 | |
| 7.80 ± 0.01 | 7.82 ± 0.04 |
3.4 Bioimaging and cytotoxicity
The cytotoxicity of CDs was assessed with an MTT assay on HeLa and HS-5 cell lines. The cell viability results demonstrate that these CDs are biocompatible with cellular environments (Fig. 8A and B). After 24 h, almost 100% of HS-5 cells were viable with CDs concentrations as high as 500 μg mL−1 (Fig. 8A). Even after 3 days of incubation with 200 μg mL−1 CDs, about 80% of HS-5 cells were viable. Moreover, nearly 80% of HeLa cells (Fig. 8A) were alive after 24 h of incubation with 500 μg mL−1 CDs. These results clearly show the potential application of CDs as a biocompatible pH sensor in intracellular environments.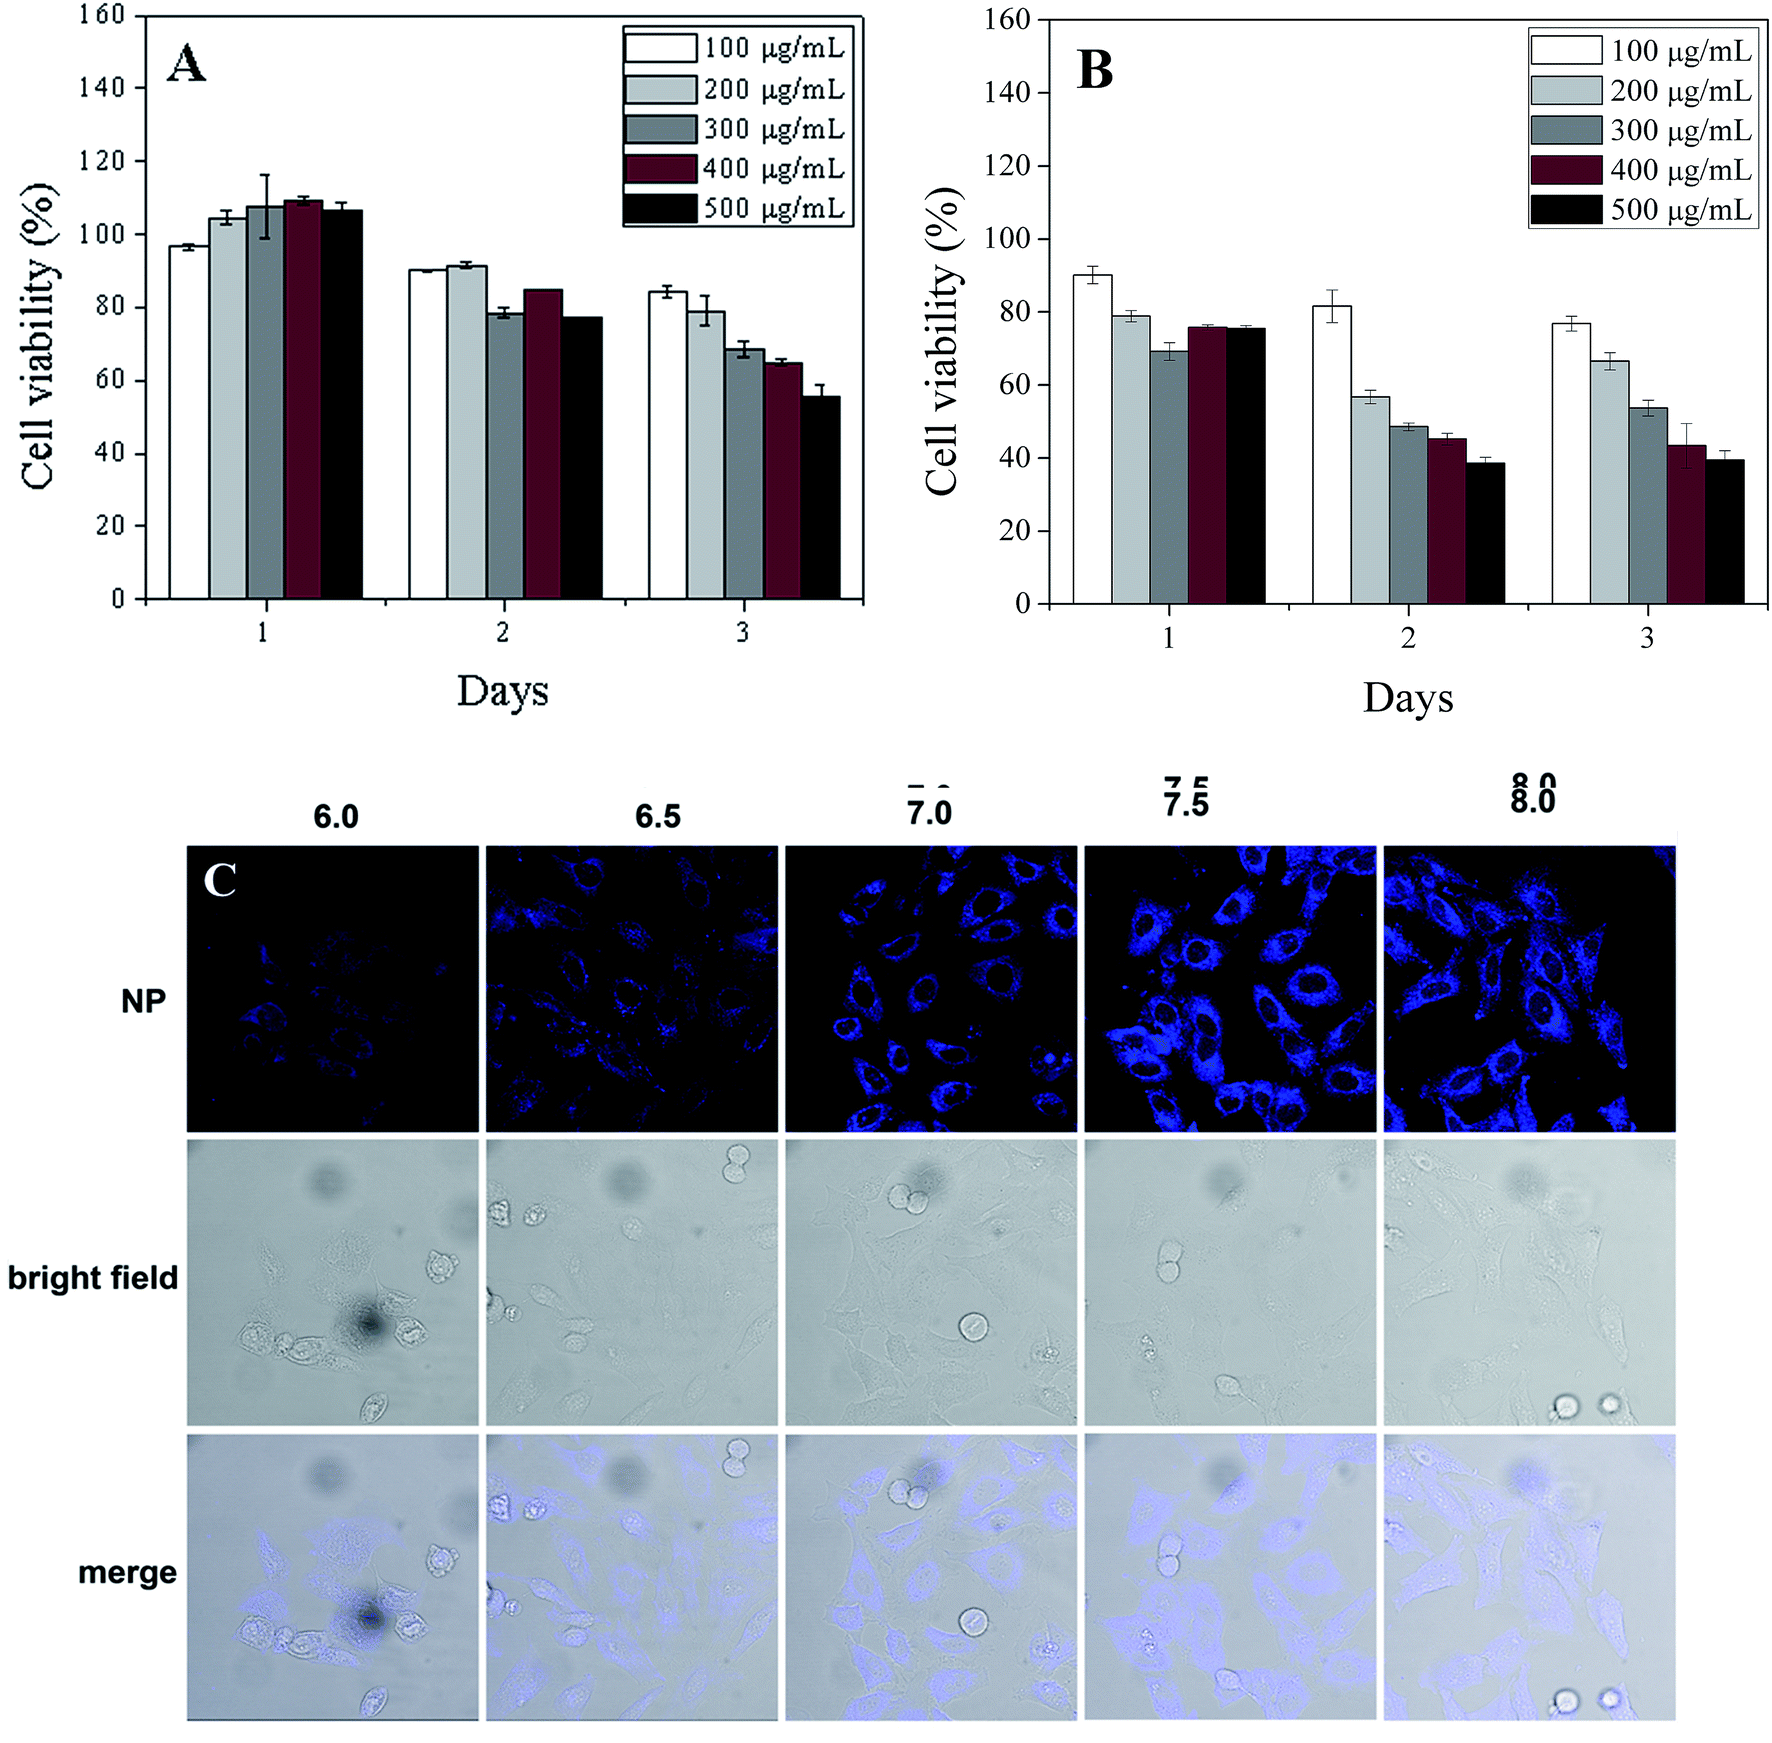 | ||
| Fig. 8 MTT assay showing the percentage of viable (A) HS-5 and (B) HeLa cells after incubation at different CD concentrations. (C) Confocal microscopic and bright-field images of the pH-dependent fluorescence response of cells with increasing pH values of 6.0, 6.5, 7.0, 7.5, and 8.0. | ||
In addition to the cell viability test, the suitability of the pH sensor for living organisms was confirmed by pH-dependent fluorescence imaging with a confocal fluorescence microscope (Fig. 8C). Cultured cells were incubated with CDs at five pH values (6.0, 6.5, 7.0, 7.5 and 8.0). The blue fluorescence emitted by CDs in Fig. 8 indicates their uniform distribution in the live cells. This demonstrates the excellent cell membrane permeability of CDs, possibly due to their small size. Cells loaded with CDs at pH 6 exhibited weak fluorescence. Increasing the pH from 6 to 7.5 increased the fluorescence emission. The fluorescence intensity of CDs in live cells levelled off at pH 8, consistent with our calibration data. Minor pH variations (0.5 units) within the cells were clearly shown by a brighter fluorescence response. The bright-field transmission images of cells incubated with CDs also show the cell viability. The confocal imaging results prove that the unmodified CDs used in this work can convert the pH changes in live cells into a bright fluorescence emission. In this work, the nanostructures did not require tedious surface functionalization, which is an advantage. These biocompatible CDs serve as a desirable intracellular pH sensor and are suitable labelling agents for fluorescence imaging.
4. Conclusion
In summary, a simple, efficient, cost-effective pH nanosensor was fabricated. Unlike most pH nanosensors, the fluorescent CDs in this work were used directly with no surface treatment or ligand modification. The perfect resolution in the physiological pH range of 6.1–7.8 in 0.1 pH unit intervals, excellent selectivity over various ions and biomolecules, and high reversibility of the pH response make this sensor a promising candidate for clinical applications. Analysis of RPMI 1640 as a real sample demonstrated that this nanosensor is capable of pH determination in complex biological matrices. Most importantly, the unmodified CDs in this work can easily penetrate into the living cells, are biocompatible, and are highly sensitive to pH changes inside living cells. Therefore, they are suitable for biomedical applications and cell imaging.Acknowledgements
The authors wish to express their gratitude to Iran's National Elites Foundation and Shiraz University Research Council for the support of this work. The authors also greatly appreciate the kind support and assistance of Dr Bing Xu from Brandeis University in obtaining the biological data.References
- J. R. Casey, S. Grinstein and J. Orlowski, Nat. Rev. Mol. Cell Biol., 2010, 11, 50–61 CrossRef CAS PubMed
.
- A. Ray, Y.-E. Koo Lee, T. Epstein, G. Kim and R. Kopelman, Analyst, 2011, 136, 3616–3622 RSC
- W. Huang, W. Lin and X. Guan, Tetrahedron Lett., 2014, 55, 116–119 CrossRef CAS
- L. Cao, X. Li, S. Wang, S. Li, Y. Li and G. Yang, Chem. Commun., 2014, 50, 8787–8790 RSC
- J. Zhou, C. Fang, T. Chang, X. Liu and D. Shangguan, J. Mater. Chem. B, 2013, 1, 661–667 RSC
- B. Tang, F. Yu, P. Li, L. Tong, X. Duan, T. Xie and X. Wang, J. Am. Chem. Soc., 2009, 131, 3016–3023 CrossRef CAS PubMed
- B. Kong, A. Zhu, C. Ding, X. Zhao, B. Li and Y. Tian, Adv. Mater., 2012, 24, 5844–5848 CrossRef CAS PubMed
- L. Fan, Q. Liu, D. Lu, H. Shi, Y. Yang, Y. Li, C. Dong and S. Shuang, J. Mater. Chem. B, 2013, 1, 4281–4288 RSC
- F. Du, Y. Ming, F. Zeng, C. Yu and S. Wu, Nanotechnology, 2013, 24, 365101 CrossRef PubMed
- M. J. Ruedas-Rama, A. Orte, E. a H. Hall, J. M. Alvarez-Pez and E. M. Talavera, Chem. Commun., 2011, 47, 2898–2900 RSC
- Z. L. Wu, M. X. Gao, T. T. Wang, X. Y. Wan, L. L. Zheng and C. Z. Huang, Nanoscale, 2014, 6, 3868–3874 RSC
- F. Gao, L. Tang, L. Dai and L. Wang, Spectrochim. Acta, Part A, 2007, 67, 517–521 CrossRef PubMed
- A. M. Dennis, W. J. Rhee, D. Sotto, S. N. Dublin and G. Bao, ACS Nano, 2012, 6, 2917–2924 CrossRef CAS PubMed
- R. Arppe, T. Näreoja, S. Nylund, L. Mattsson, S. Koho, J. M. Rosenholm, T. Soukka and M. Schäferling, Nanoscale, 2014, 6, 6837–6843 RSC
- F. Qu, N. B. Li and H. Q. Luo, Langmuir, 2013, 29, 1199–1205 CrossRef CAS PubMed
- A. Orte, J. M. Alvarez-Pez and M. J. Ruedas-Rama, ACS Nano, 2013, 7, 6387–6395 CrossRef CAS PubMed
- X. Jia, J. Li and E. Wang, Nanoscale, 2012, 4, 5572–5575 RSC
- S. G. Pedro, A. Salinas-Castillo, M. Ariza-Avidad, A. Lapresta-Fernandez, C. Sanchez-Gonzalez, C. S. Martinez-Cisneros, M. Puyol, L. F. Capitan-Vallvey and J. Alonso-Chamarro, Nanoscale, 2014, 6, 6018–6024 RSC
- W. Shi, X. Li and H. Ma, Angew. Chem., Int. Ed., 2012, 51, 6432–6435 CrossRef CAS PubMed
- N. Gogoi and D. Chowdhury, J. Mater. Chem. B, 2014, 2, 4089–4099 RSC
- X. Jin, X. Sun, G. Chen, L. Ding, Y. Li, Z. Liu, Z. Wang, W. Pan, C. Hu and J. Wang, Carbon, 2015, 81, 388–395 CrossRef CAS
- Y. Mao, Y. Bao, L. Yan, G. Li, F. Li, D. Han, X. Zhang and L. Niu, RSC Adv., 2013, 3, 5475–5482 RSC
- Y. Dong, R. Wang, H. Li, J. Shao, Y. Chi, X. Lin and G. Chen, Carbon, 2012, 50, 2810–2815 CrossRef CAS
- S. Chandra, P. Patra, S. H. Pathan, S. Roy, S. Mitra, A. Layek, R. Bhar, P. Pramanik and A. Goswami, J. Mater. Chem. B, 2013, 1, 2375–2382 RSC
- A. B. Horn and K. Jessica Sully, Phys. Chem. Chem. Phys., 1999, 1, 3801–3806 RSC
- K. L. Nash, K. Jessica Sully and A. B. Horn, J. Phys. Chem. A, 2001, 105, 9422–9426 CrossRef CAS
- H. Ding, J.-S. Wei and H.-M. Xiong, Nanoscale, 2014, 6, 13817–13823 RSC
- D. Sun, R. Ban, P. H. Zhang, G. H. Wu, J. R. Zhang and J. J. Zhu, Carbon, 2013, 64, 424–434 CrossRef CAS
- Z. Yang, Z. Yao, G. Li, G. Fang, H. Nie, Z. Liu, X. Zhou, X. Chen and S. Huang, ACS Nano, 2012, 6, 205–211 CrossRef CAS PubMed
- J. Zhang, X. An, N. Lin, W. Wu, L. Wang, Z. Li, R. Wang, Y. Wang, J. Liu and M. Wu, Carbon, 2016, 100, 450–455 CrossRef CAS
- Y.-Q. Zhang, D.-K. Ma, Y. Zhuang, X. Zhang, W. Chen, L.-L. Hong, Q.-X. Yan, K. Yu and S.-M. Huang, J. Mater. Chem., 2012, 22, 16714–16718 RSC
- Y. Zhuo, H. Miao, D. Zhong, S. Zhu and X. Yang, Mater. Lett., 2015, 139, 197–200 CrossRef CAS
- H. Nie, M. Li, Q. Li, S. Liang, Y. Tan, L. Sheng, W. Shi and S. X. A. Zhang, Chem. Mater., 2014, 26, 3104–3112 CrossRef CAS
- W. Kong, H. Wu, Z. Ye, R. Li, T. Xu and B. Zhang, J. Lumin., 2014, 148, 238–242 CrossRef CAS
- X. Jia, J. Li and E. Wang, Nanoscale, 2012, 4, 5572–5575 RSC
- C. Zheng, X. An and J. Gong, RSC Adv., 2015, 5, 32319–32322 RSC
| This journal is © The Royal Society of Chemistry 2016 |