Solution-phase synthesis of γ-In2Se3 nanoparticles for highly efficient photocatalytic hydrogen generation under simulated sunlight irradiation†
Shuang Yangab,
Cheng-Yan Xu*ab,
Li Yanga,
Sheng-Peng Huabc and
Liang Zhen*ab
aSchool of Materials Science and Engineering, Harbin Institute of Technology, Harbin 150001, China. E-mail: cy_xu@hit.edu.cn; lzhen@hit.edu.cn; Fax: +86-451-8641-3921; Tel: +86-451-8641-2133
bMOE Key Laboratory of Micro-System and Micro-Structures Manufacturing, Harbin Institute of Technology, Harbin 150080, China
cSchool of Materials Science and Engineering, Harbin Institute of Technology at Weihai, Weihai 264209, China
First published on 2nd November 2016
Abstract
Hexagonal indium selenide (γ-In2Se3) nanoparticles were successfully synthesized by a hot-injection method using triethylene glycol as a solvent. The structure and morphology of the obtained nanoparticles were characterized by powder X-ray diffraction (XRD), X-ray photoelectron spectroscopy (XPS), scanning electron microscopy (SEM), and transmission electron microscopy (TEM). Phase-pure γ-In2Se3 nanoparticles could be obtained at a relatively low temperature of 220 °C. Further increasing the reaction temperature leads to enhanced crystallinity of the γ-In2Se3 nanoparticles, which favors improving the photocatalytic activity. The γ-In2Se3 nanoparticles synthesized at 250 °C exhibit excellent and stable photocatalytic hydrogen generation under simulated sunlight irradiation, which might be attributed to the strong absorbance both in the UV and visible light regions as well as their nano-sized morphology.
Introduction
Photocatalytic water splitting over semiconductor nanomaterials has attracted intense research interest in recent years, because it is a “green” approach to convert solar energy into chemical energy.1,2 Among the numerous semiconductor nanomaterials, metal selenides (e.g., CdSe and PbSe), which possess appropriate band levels for water splitting, as well as their narrow band gaps allowing visible light absorption,3,4 have been extensively studied as promising candidates for the solar energy conversion process. However, lead- or cadmium-based semiconductors are usually viewed as toxic and not environmentally friendly materials. Because of low toxicity and eco-friendly, indium selenide gradually has recently extensive concern to replace CdSe and PbSe in the field of photocatalytic water splitting.As an important III–VI group inorganic semiconductor, indium selenide (In2Se3) with band gap of 1.36–2.0 eV has attracted much attention due to its highly anisotropic structural, electrical, optical and mechanical properties, which make it attractive for ionic batteries,5 phase change random access memories,6 visible-light photodetectors7–9 and photovoltaic solar cells.10 In recent years, various strategies have been utilized to synthesize indium selenide nanostructures, such as thermal evaporation,9 chemical vapor deposition techniques,11–13 electrochemical atomic layer epitaxy,14 molecular beam epitaxy,15,16 and solution-phase synthesis.17–20 However, it is difficult to synthesize In2Se3 nanostructures by solution-phase method. On one hand, indium ions is easy to hydrolyze in aqueous solution due to their deficient electron properties, which will baffle the synthesis of In2Se3 in aqueous solution.19 On the other hand, the same stoichiometric In2Se3 exists in several kinds of crystalline phases, such as, room temperature phases of α-In2Se3, and high temperature phases of β-In2Se3, γ-In2Se3, δ-In2Se3 and κ-In2Se3,19,20 which largely restrict the formation of single phase γ-In2Se3.
In a previous report, Hsiang et al. synthesized hexagonal shaped γ-In2Se3 particles with sizes of 0.5–2 μm utilized InCl3·4H2O and Se as raw materials and oleylamine and octadecene as solvents at 250 °C.17 Ning et al. found that hexagonal crystal structure In2Se3 nanoplates were formed at high reaction temperature (330 °C) while InSe nanocrystals with zinc blende structure were formed at relatively low temperature of 280 °C using oleylamine as solvent.18 Tan et al. demonstrated the synthesis of γ-In2Se3 flower-like hierarchical nanostructures by ascorbic acid (AA)-assisted solvothermal method with InCl3·4H2O and Se as starting materials.19 Wei et al. developed a two-step strategy for the synthesis of porous γ-In2Se3 tegragonal particles. In–Se based precursor was prepared in a water–ethylenediamine mixed solvent under hydrothermal conditions, and was then calcined under N2 atmosphere, forming porous γ-In2Se3 tegragonal particles with improved photocatalytic activity for water splitting compared with In2Se3 nanoparticles.20 To obtain the deserved phase and morphology of indium selenides, particular attention should be paid to the reaction temperature as well as the selection of solvents with respect to the starting materials. We are thus motivated to search for alterative solvent for hot-injection synthesis of γ-In2Se3 crystals at mild conditions. Triethylene glycol (TEG) is a cheaper polyols solvents with merits of less toxicity and eco-friendly, and it can serves as both solvent and reductant for controlled synthesis of indium selenides.
Herein, we report a facile hot-injection synthesis route to prepare γ-In2Se3 nanoparticles through the reaction of InCl3·4H2O with Se using triethylene glycol as solvents at 250 °C. Because of low price, reduced toxicity, high boiling point and good dissolvability with many inorganic metal salts, triethylene glycol was selected for solvent to prepare the γ-In2Se3 nanoparticles for the first time. Meanwhile, this synthetic approach requires no precursor synthesis or toxic compounds. Furthermore, the obtained γ-In2Se3 nanoparticles exhibit efficient hydrogen evolution capacity under simulated sunlight irradiation.
Experimental section
Synthesis
All the reagents were of analytical grade and were used as received without further purification. In a typical procedure, 0.75 mmol indium chloride tetrahydrate (InCl3·4H2O) was dissolved into 5 mL of triethylene glycol (C6H14O4, TEG) in a beaker under magnetic stirring at room temperature until a clear indium precursor solution was obtained. Then, 0.01 g selenium (Se) powder was added into 45 mL of TEG in a 100 mL three-necked round-bottom flask. The three-necked flask was attached to a reflux condenser and heated to 250 °C under magnetic stirring. Then, the indium precursor solution was quickly injected into the three-necked flask with vigorous stirring. The reaction solution was refluxed at 250 °C for 2 h. After the completion of reaction, the reaction solution was allowed to cool to room temperature naturally. The products were collected by high speed centrifugation, washed with absolute ethanol for several times, and dried at 60 °C in air. In order to investigate the synthetic temperature, injection temperature was set as 210 °C, 220 °C, 230 °C and 250 °C, respectively, while the other processing parameters used were unchanged as above conditions.Characterization
The phases were identified by means of X-ray diffraction (XRD) with Rigaku D/max 2500 diffractometer using Cu Kα radiation (λ = 0.15418 nm). The morphology and microstructures of the products were characterized by field-emission scanning electron microscope (FE-SEM, FEI Quanta 200F), transmission electron microscope and high-resolution transmission electron microscope (TEM and HRTEM, JEOL JEM 2100). The elemental compositions of the samples were determined with energy-dispersive X-ray spectroscopy (EDS). The surface chemistry and elemental valence analysis of the products were recorded on the X-ray photoelectron spectra (XPS, Thermofisher Scientific Company). The diffusion reflectance spectrum of samples was analyzed by using UV-vis spectrometer (Shimadzu UV-2550).Photocatalytic hydrogen evolution
The photocatalytic hydrogen evolution was performed with a CEL-SPH2N photocatalytic hydrogen generation system (Beijing Au-light, China). A 300 W xenon lamp (CEL-HXF 300, Beijing Au-light, China, wavelength: 200–1100 nm; I = 20 A) was used as simulated sunlight source. The incident light intensity was 364 mW cm−2 (CEL-NP2000 optical power meter). In the photocatalytic process, a cylindrical quartz vessel with diameter of 7 cm and height of 10 cm was employed as the reactor. The temperature of reaction system was kept at about 25 °C using recycled chilling water. In a typical photocatalytic experiment, 20 mg γ-In2Se3 powders were suspended in 100 mL of triethanolamine (C6H15NO3, TEA, 10 vol%) solution. A certain amount of H2PtCl6·6H2O aqueous solution was dripped into the system to load Pt onto the surface of the photocatalyst (as co-catalyst). The concentration of H2 was analyzed by gas chromatography (GC7890 II TECHCOMP, China) equipped with a thermal conductivity detector (N2 carrier), which was connected to the gas circulating line. After catalytic reaction, the used catalyst was centrifuged and washed with absolute ethanol for several times. The recycled catalyst was dried at 60 °C in air for the next cycle of catalytic test. The photocatalysis experiments were repeated for three times for each sample.The apparent quantum yield (AQY) for H2 evolution was determined using a 300 W xenon lamp (CEL-HXF 300, Beijing Au-light, China, I = 20 A) with a band-pass filter (λ = 500 nm). The irradiation area was about 38.5 cm2. For the 500 nm monochromatic light, the average intensity was 42.4 mW cm−2 (CEL-NP2000 optical power meter). The AQY was calculated as:
Results and discussion
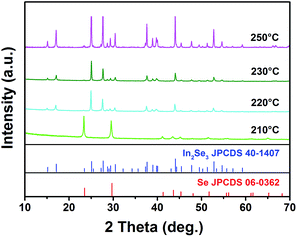
As previously reported,18 γ-In2Se3 nanocrystals could be synthesized by InCl3·4H2O and selenourea in the solvent of oleylamine when reaction temperature is high enough (330 °C). The reaction temperature of solution-phase synthesis has important influence on the morphology and phase structure of the γ-In2Se3. Fig. 1 shows XRD patterns of the products synthesized at different injection temperatures. When reacted at 210 °C, no significant redox reaction actually occurs between triethylene glycol and Se. The morphologies of selenium have significantly changed at 210 °C because following the increase of reaction temperature, the solubility of selenium is increased. Hence, the sphere-like selenium microparticles will decrease or disappear for the growth of wire-like or rod-like selenium crystals21 (Fig. S1 and S2†). The EDS spectrums further verify that the phases of both irregular microrods and microparticles were Se (Fig. S3a and b†). Selenium has a relatively low melting point (∼216.8 °C).21 Hence, Se could occur remelting and recrystallization, when the temperature is above 216.8 °C.21 When the temperature was increased to 220 °C, all the diffraction peaks of the products can be assigned to that of hexagonal γ-In2Se3 structure (JCPDS no. 40-1407) (Fig. 1). Almost the same characteristic diffraction peaks as injection temperatures of 220 °C appear on XRD patterns injection temperatures of 230 °C and 250 °C, respectively (Fig. 1). As the reaction temperature further increased, the diffraction intensity of γ-In2Se3 was enhanced, suggesting better crystallinity at higher reaction temperature.Even though the phase of the products remain unchanged with the increasing of reaction temperature (above 220 °C), the morphology of the products are different. When the temperature was set as 220 °C, the as-prepared γ-In2Se3 were irregular microspheres with diameters of 1.0–2.5 μm and nanoparticles of 350–500 nm (Fig. S2c and d†). When the temperature was 230 °C, the synthesized γ-In2Se3 was composed of microspheres with diameters of 1–2 μm (Fig. S2e†). And those microspheres are constructed by numerous irregular nanoparticles (Fig. S2f†). Energy dispersive X-ray spectroscopy (EDS) was applied to analyze the chemical compositions of the microspheres synthesized at 220 and 230 °C. The peaks associated with In and Se element can be detected in the EDS spectrums and the corresponding atomic ratios of In to Se are determined to be 1![[thin space (1/6-em)]](https://www.rsc.org/images/entities/char_2009.gif) :
:![[thin space (1/6-em)]](https://www.rsc.org/images/entities/char_2009.gif) 1.44 and 1
1.44 and 1![[thin space (1/6-em)]](https://www.rsc.org/images/entities/char_2009.gif) :
:![[thin space (1/6-em)]](https://www.rsc.org/images/entities/char_2009.gif) 1.46 from EDS profiles, close to the stoichiometric ratio of In to Se in In2Se3 (Fig. S3c and d†). When the temperature was further increased to 250 °C, the morphologies of the synthesized γ-In2Se3 were transformed to submicron particles. From these above results, it could be concluded that the products show the significantly characteristics of crystal face with rising of temperature. The good crystallinity of γ-In2Se3 nanoparticles will be benefit for enhancing the photocatalytic activity.
1.46 from EDS profiles, close to the stoichiometric ratio of In to Se in In2Se3 (Fig. S3c and d†). When the temperature was further increased to 250 °C, the morphologies of the synthesized γ-In2Se3 were transformed to submicron particles. From these above results, it could be concluded that the products show the significantly characteristics of crystal face with rising of temperature. The good crystallinity of γ-In2Se3 nanoparticles will be benefit for enhancing the photocatalytic activity.
The morphology and microstructures of γ-In2Se3 synthesized at 250 °C were characterized by FE-SEM and TEM (Fig. 2). The as-prepared γ-In2Se3 is nanoparticles with size ranging from 200 to 400 nm (Fig. 2a and b). The majority of these nanoparticles tend to agglomerate in order to reduce surface energy (Fig. 2b and c). Fig. 2c shows a typical TEM image of the products, which indicates that the products are polyhedral shape particles. Selected-area electron diffraction (SAED, in Fig. 2d) pattern corresponding to a single particle (the blue rectangle in Fig. 2c) shows the diffraction spots, which can be indexed to the (![[1 with combining macron]](https://www.rsc.org/images/entities/char_0031_0304.gif) 100), (01
100), (01![[1 with combining macron]](https://www.rsc.org/images/entities/char_0031_0304.gif) 0) and (
0) and (![[1 with combining macron]](https://www.rsc.org/images/entities/char_0031_0304.gif) 2
2![[1 with combining macron]](https://www.rsc.org/images/entities/char_0031_0304.gif) 0) planes of the hexagonal γ-In2Se3. These diffraction spots clearly exhibit a single-crystalline structure, high crystallinity and diffraction characteristics of the [0001] zone axis of hexagonal γ-In2Se3.
0) planes of the hexagonal γ-In2Se3. These diffraction spots clearly exhibit a single-crystalline structure, high crystallinity and diffraction characteristics of the [0001] zone axis of hexagonal γ-In2Se3.
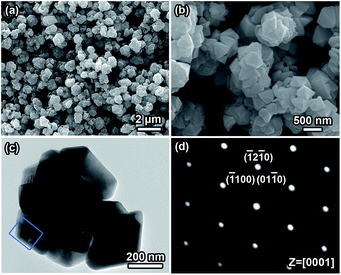 | ||
| Fig. 2 (a and b) SEM images, (c) TEM image, and (d) SAED pattern of γ-In2Se3 nanoparticles synthesized at 250 °C. | ||
The chemical compositions of the γ-In2Se3 nanoparticles were examined by X-ray photoelectron spectroscopy (XPS). Fig. 3a shows the XPS spectra obtained from the products synthesized at 250 °C, which confirms that the products contain In and Se elements. The binding energies of In 3d5/2 and In 3d3/2 in Fig. 3b is located at 444.0 and 451.5 eV, respectively. As shown in Fig. 3c, the Se 3d features have binding energy of 54.0 eV. These results are consistent with that of pure γ-In2Se3.22,23
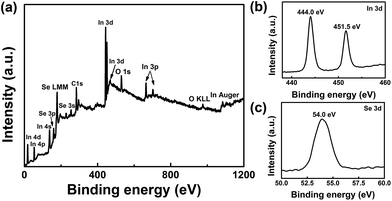 | ||
| Fig. 3 (a) XPS survey spectrum, (b) In 3d and (c) Se 3d XPS spectra of γ-In2Se3 nanoparticles synthesized at 250 °C. | ||
The optical absorptions of γ-In2Se3 nanoparticles synthesized at reaction temperatures of 250 °C were investigated by UV-vis diffuse reflectance spectrometer. As shown in Fig. 4, the γ-In2Se3 nanoparticles have the strong absorbance both in the UV and visible light regions (200–700 nm). To obtain the relation of band gap (Eg) and the optical absorption, the absorption spectra can be analyzed by the following equation for near-edge absorption:24,25 (αhν)n = A(hν − Eg), where α is the absorption coefficient, hν is the photo energy, A is a constant, and n is 1/2 for an indirect semiconductor and 2 for a direct semiconductor. The optical indirect band gap of γ-In2Se3 nanoparticles in absorption can be calculated by the functions of (ahν)1/2 − hν. From the plots of absorbance versus energy for typical products, the band gap of γ-In2Se3 nanoparticles is about 1.58 eV (Fig. 4b), which is close to the value of γ-In2Se3 (1.63 eV) reported in other literature.20 The band-edge potentials of the valence band (EVB) and conduction band (ECB) can be estimated by the formula:26 EVB = X − EC + 0.5Eg and ECB = X − EC − 0.5Eg, where X is the geometric mean of the electronegativity of the constituent atoms (4.56 eV for In2Se3), EC is the energy of free electrons on the hydrogen scale (about 4.5 eV). Thus, the EVB and ECB of γ-In2Se3 can be estimated to be 1.39 and −0.19 eV, respectively, indicating that the as-prepared γ-In2Se3 nanoparticles have the appropriate ECB for photocatalytic hydrogen evolution.
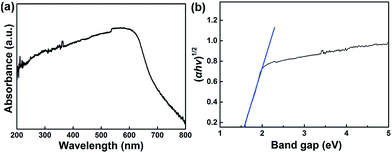 | ||
| Fig. 4 (a) UV-vis diffuse reflectance spectrum and (b) the plots of (αhν)1/2 versus hν for the band gap determination of γ-In2Se3 nanoparticles synthesized at 250 °C. | ||
The photocatalytic activity of γ-In2Se3 nanoparticles synthesized at 250 °C was studied using triethanolamine (TEA) as agent. Compared with other hole scavengers (e.g., methanol and ethanol), TEA was selected as the hole scavenger for photocatalytic H2 production for its great environmental significance, which is a non-biodegradable pollutant as well as present in wastewater generated by oil production.20,27 Pt is used as a co-catalyst for photocatalytic hydrogen generation, which could promote the separation of photoexcited electrons/holes as reduction/oxidation sites and reduce the activation energy for H2 generation.28 The optimum amount of the Pt loading for γ-In2Se3 nanoparticles prepared at 250 °C was firstly examined, and the results are presented in Fig. 5 and S4.† Without Pt loading, γ-In2Se3 nanoparticles shows no activity for photocatalytic H2 evolution. With Pt loading, the activity of In2Se3 nanoparticles increases remarkably. When the Pt loading content is 0.5 wt%, γ-In2Se3 nanoparticles shows low activity for photocatalytic H2 evolution (44.5 μmol g−1 h−1). By increasing Pt content to 1.0 wt%, the hydrogen evolution rate was greatly enhanced and the activity reached a maximum (866.9 μmol g−1 h−1). Further increasing the amount of Pt loading to 2.0 wt%, the hydrogen evolution rate was reduced (288.9 μmol g−1 h−1). The higher loading amount of Pt covers more active sites of γ-In2Se3 nanoparticles, on the other hand, the loading Pt could act as electron–hole recombination centers, both of which will result in lower photocatalytic activity.29 The optimum loading amount of Pt was found to be 1.0 wt%. In addition, the apparent quantum yield for H2 evolution was determined to be 1.2% under monochromatic light irradiation (λ = 500 nm).
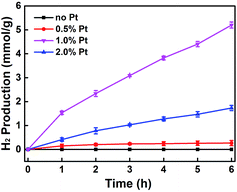 | ||
| Fig. 5 Time-depended hydrogen evolution rate of γ-In2Se3 nanoparticles with different amounts of Pt loaded. | ||
As shown in Fig. 6, H2 production rate under identical conditions except light source is about 314.5 μmol g−1 h−1 under visible light irradiation (λ > 420 nm), about one third of that under simulated sunlight (λ: 200–1100 nm). Considering the energy portion of visible light (ca. 45% of total energy from 200 nm) and UV-vis diffusion reflection spectrum of γ-In2Se3 particles (Fig. 4), such ratio is rational and does somewhat reflect the wavelength response. The high hydrogen production with simulated sunlight irradiation is due to the promotion of hot electrons for ultimate disposition by the platinum catalyst nanoparticles.30
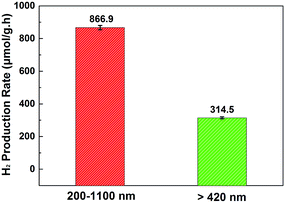 | ||
| Fig. 6 Hydrogen produced rate over γ-In2Se3 particles under light irradiation with different wavelength ranges. The loading of Pt is 1.0%. | ||
We further compared the hydrogen evolution rate of γ-In2Se3 samples synthesized at different reaction temperatures by loading 1.0% Pt as co-catalyst under simulated sunlight irradiation. As shown in Fig. 7a, the hydrogen evolution rate of γ-In2Se3 nanoparticles synthesized at 250 °C is much higher than that of the products synthesized at reaction temperatures of 230 and 220 °C (91.5 and 34.2 μmol h−1 g−1) under simulated sunlight irradiation. The average hydrogen evolution rate of γ-In2Se3 nanoparticles is 28 times higher than that of porous γ-In2Se3 tetragons (30.4 μmol h−1 g−1).20 It can be ascribed to the strong absorbance both in the UV and visible light regions and nano-sized morphology, which could offer larger excitation energy and the photoexcited charge carriers move rapidly from the interior to the surface to involve in the photocatalytic reaction. Eventually, the stability of photocatalytic activity was also investigated. As shown in Fig. 7b, activity can be maintained over three photoreduction cycles. More importantly, the catalytic activity of γ-In2Se3 nanoparticles did not present any significant loss in the second and third cycles. These results indicated that the γ-In2Se3 nanoparticles could be used as a photocatalyst for hydrogen evolution in the sunlight.
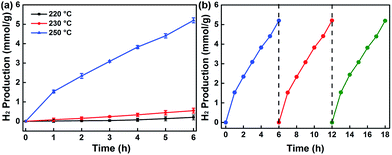 | ||
| Fig. 7 (a) Comparison of H2 production rate on the products synthesized at different injection temperatures. (b) Cyclic H2 production curve for the product synthesized at 250 °C. | ||
Conclusions
In summary, γ-In2Se3 nanoparticles can be synthesized by a facile solution-phase reaction route. The solution reaction temperature plays a key role in the formation phase of hexagonal γ-In2Se3, and the γ-In2Se3 micro/nanoparticles could be obtained above 220 °C. The hexagonal γ-In2Se3 nanoparticles synthesized at 250 °C exhibit excellent and stable photocatalytic activity for hydrogen production (866.9 μmol g−1 h−1), which might be ascribed to the combined effect of the strong absorbance both in the UV-vis light regions and nano-sized morphology.Acknowledgements
This work was financially supported by the Fundamental Research Funds for the Central Universities (HIT.BRETIII.201203).Notes and references
- Z. Zou, J. Ye, K. Sayama and H. Arakawa, Nature, 2001, 414, 625–627 CrossRef CAS PubMed.
- C. Liu, J. Tang, H. M. Chen, B. Liu and P. Yang, Nano Lett., 2013, 13, 2989–2992 CrossRef CAS PubMed.
- M. A. Holmes, T. K. Townsend and F. E. Osterloh, Chem. Commun., 2012, 48, 371–373 RSC.
- K. N. Sharma, H. Joshi, V. V. Singh, P. Singh and A. K. Singh, Dalton Trans., 2013, 42, 3908–3918 RSC.
- C. Julien, E. Hatzikraniotis, A. Chevy and K. Kambas, Mater. Res. Bull., 1985, 20, 287–292 CrossRef CAS.
- H. Lee, D. H. Kang and L. Tran, Mater. Sci. Eng., B, 2005, 119, 196–201 CrossRef.
- T. Zhai, X. Fang, M. Liao, X. Xu, L. Li, B. Liu, Y. Koide, Y. Ma, J. Yao and Y. Bando, ACS Nano, 2010, 4, 1596–1602 CrossRef CAS PubMed.
- Q. Li, Y. Li, J. Gao, S. Wang and X. Sun, Appl. Phys. Lett., 2011, 99, 243105 CrossRef.
- T. Zhai, Y. Ma, L. Li, X. Fang, M. Liao, Y. Koide, J. Yao, Y. Bando and D. Golberg, J. Mater. Chem., 2010, 20, 6630–6637 RSC.
- S. Kwon, B. Ahn, S. Kim, K. Yoon and J. Song, Thin Solid Films, 1998, 323, 265–269 CrossRef CAS.
- H. Peng, D. T. Schoen, S. Meister, X. F. Zhang and Y. Cui, J. Am. Chem. Soc., 2007, 129, 34–35 CrossRef CAS PubMed.
- J. Zhou, Q. Zeng, D. Lv, L. Sun, L. Niu, W. Fu, F. Liu, Z. Shen, C. Jin and Z. Liu, Nano Lett., 2015, 15, 6400–6405 CrossRef CAS PubMed.
- S. M. Yu, J. H. Yoo, S. P. Patole, J. H. Lee and J. B. Yoo, Electron. Mater. Lett., 2012, 8, 245–250 CrossRef CAS.
- R. Vaidyanathan, J. L. Stickney, S. M. Cox, S. P. Compton and U. Happek, J. Electroanal. Chem., 2003, 559, 55–61 CrossRef CAS.
- T. Ohtsuka, K. Nakanishi, T. Okamoto, A. Yamada, M. Konagai and U. Jahn, Jpn. J. Appl. Phys., Part 1, 2001, 40, 509 CrossRef CAS.
- T. Okamoto, A. Yamada and M. Konagai, J. Cryst. Growth, 1997, 175, 1045–1050 CrossRef.
- H. I. Hsiang, L. H. Lu, Y. L. Chang, D. Ray and F. S. Yen, J. Alloys Compd., 2011, 509, 6950–6954 CrossRef CAS.
- J. Ning, G. Xiao, N. Xiao, L. Wang, B. Liu and B. Zou, J. Cryst. Growth, 2011, 336, 1–5 CrossRef CAS.
- X. Tan, J. Zhou and Q. Yang, CrystEngComm, 2011, 13, 2792–2798 RSC.
- D. Wei, Z. Lin, Z. Cui, S. Su, D. Zhang, M. Cao and C. Hu, Chem. Commun., 2013, 49, 9609–9611 RSC.
- G. Xi, K. Xiong, Q. Zhao, R. Zhang, H. Zhang and Y. Qian, Cryst. Growth Des., 2006, 6, 577–582 CAS.
- P. Liu, S. Yu, W. Fan and W. Shi, Dalton Trans., 2013, 42, 2887–2893 RSC.
- W. Shi, S. Yu, P. Liu, W. Fan, H. Luo and S. Song, Chem. Eng. J., 2013, 225, 474–480 CrossRef CAS.
- M. Tahir and N. S. Amin, Appl. Catal., B, 2016, 2013(142), 512–522 Search PubMed.
- S. Guo, Y. Zhu, Y. Yan, Y. Min, J. Fan and Q. Xu, Appl. Catal., B, 2016, 185, 315–321 CrossRef CAS.
- J. Cao, X. Li, H. Lin, B. Xu, S. Chen and Q. Guan, Appl. Surf. Sci., 2013, 266, 294–299 CrossRef CAS.
- J. Ran, J. Yu and M. Jaroniec, Green Chem., 2011, 13, 2708–2713 RSC.
- X. Fu, X. Wang, Z. Chen, Z. Zhang, Z. Li, D. Y. Leung, L. Wu and X. Fu, Appl. Catal., B, 2010, 95, 393–399 CrossRef CAS.
- L. Shang, C. Zhou, T. Bian, H. Yu, L. Z. Wu, C. H. Tung and T. Zhang, J. Mater. Chem. A, 2013, 1, 4552–4558 CAS.
- S. Mubeen, J. Lee, N. Singh, S. Krämer, G. D. Stucky and M. Moskovits, ACS Catal., 2013, 8, 247–251 CAS.
Footnote |
| † Electronic supplementary information (ESI) available: SEM images of raw selenium powder. SEM images and EDS spectra of the products synthesized at different temperatures. Comparison of photocatalytic hydrogen production rate of the γ-In2Se3 nanoparticles with different amounts of Pt loaded. See DOI: 10.1039/c6ra21784b |
| This journal is © The Royal Society of Chemistry 2016 |


