Effect of direct synthesis Al–SBA-15 supports on the morphology and catalytic activity of the NiMoS phase in HDS of DBT†
Shujiao Jiang,
Yasong Zhou*,
Sijia Ding,
Qiang Wei,
Wenwu Zhou and
Yacheng Shan
State Key Laboratory of Heavy Oil Processing, China University of Petroleum, Beijing 102249, PR China. E-mail: zhouyasong2011@163.com; Tel: +86 010 89733501
First published on 28th October 2016
Abstract
A series of Al–SBA-15 (Al-15) materials was prepared by direct synthesis method with a broad range of Si/Al molar ratios (X = 40, 20, 10, 5, and 2.5), and the corresponding NiMoS/Al-15(X) catalysts were used to perform the hydrodesulfurization (HDS) reaction with dibenzothiophene (DBT). The prepared samples were characterized by N2 physisorption, ICP-OES, powder XRD, 27Al MAS NMR, H2-TPR, pyridine-FTIR and HRTEM. Al–SBA-15(10) had the highest number of Brønsted acid sites and the total acid density of silica–alumina supports increased with Al loading. The enhanced acidity of the Al-15-type materials led to higher catalyst activity compared to those of NiMo/γ-Al2O3 and NiMo/SBA-15. A suitable stacking of the NiMoS slabs favors the hydrogenation reaction of DBT while introduction of Al into the silica supports can help the hydrogenolysis of the C–S bond. The acid density and surface roughness of the support (the surface periodicity of the support in the atomic scale) impact the morphology of the active phase, which, in turn, affects the reaction selectivity of DBT HDS.
1. Introduction
The use of fossil fuels still plays a leading role in the field of energy consumption. The burning of high sulfur-containing fuels produces considerable amounts of SOx, causing serious environmental problems.1,2 Hydrodesulfurization (HDS) is an effective method to remove these harmful compounds from fuels and is thus becoming one of the most important refinery methods due to increasingly stringent environmental regulations and the deteriorating quality of heavy crude oil. Therefore, the production of high activity Co(Ni)MoS catalysts is receiving wide attention at the present time.3,4The properties of the support are a key factor in the catalytic activity of supported Co(Ni)MoS catalysts.3,5 The properties of the support and the morphology of the active phase are directly related. A strong metal–support interaction leads to more of the type I Co(Ni)MoS active phase with a low catalytic activity, and the opposite will produce more of the type II Co(Ni)MoS active phase with abundant accessible active sites.6 γ-Al2O3 is widely used as a commercial HDS catalytic support because of its advantages in function and price. Although the active phase is highly dispersed because of excessive Lewis acid on the surface of γ-Al2O3, the strong metal–support interaction leads to insufficient sulfidation of the oxidic precursors. Moreover, coke formation tends to occur over γ-Al2O3-supported catalysts.7,8 Due to their favorable textural characteristics and simple surface properties, mesoporous SBA-15 materials are used for the supports to study the relationship between MoS2 phase morphology and active sites during HDS reactions.9–11 However, Mo(Ni)/SBA-15 has poor metal dispersion and hydrogenation activity. In order to modify the support–metal interaction, Al atoms are usually introduced into the framework of SBA-15.12,13 In particular, the direct synthetic method has received greater attention due to better preservation of pore structure and hydrothermal stability.14,15 In this study, highly HDS active NiMo/Al-15(X) catalysts were prepared using direct synthetic Al–SBA-15 supports. With the help of favorable textural characteristics and adjustable acidity of Al-15(X), the aims of this study are as follows: direct synthesis of Al-15(X) supports with favorable textural characteristics and enhanced acidity; analysis of the effect of the Si/Al ratio on the properties of the supports, catalysts and reaction results; investigation of the relationship between the support, active phase and selectivity of the dibenzothiophene hydrodesulfurization reaction.
2. Experimental
2.1 Preparation of supports and catalysts
The mesoporous material SBA-15 was synthesized according to the reported procedures.16 Triblock copolymer Pluronic P123 (EO20PO70EO20, Aldrich, MW = 5800) and tetraethyl orthosilicate (TEOS) were used as a structure-directing agent and silica source, respectively. In a typical synthesis, 2 g of P123 and 15 g of distilled water were added into 60 g of aqueous HCl (2 M) solution, with stirring (120 rpm) at 40 °C for 3 hours until the P123 was dissolved completely. Next, 4.25 g of TEOS was added into the solution dropwise under stirring. After stirring for another 36 h at the same rate at 40 °C, the white mixture was transferred into a Teflon bottle, and aged for 24 h at 100 °C. The final solid was washed with deionized water, dried at 100 °C for 4 h and calcined at 550 °C for 5 h (with a heating rate of 1 °C min−1).The initial synthesis of Al–SBA-15 was carried out using similar steps as those used for SBA-15. After adding TEOS to the transparent solution for 3 h, 2 M HCl solution containing the required amount of NaAlO2 was added. Taking the Si/Al molar ratio of 10 as an example, the final solution composition was 0.168 g NaAlO2: 0.008 g NaF: 5.000 g H2O: 20.000 g HCl (2 M). A trace amount of NaF can promote the hydrothermal stability of Al–SBA-15.17 Then, the mixture was stirred vigorously (180 rpm) at 40 °C for 24 h, and aged at 100 °C for 48 h. After cooling to room temperature, the pH of the mixture was adjusted to 6.5 using ammonia (25%), and it was further aged for 48 h at 100 °C. The mixture was finally filtered and washed then later dried at 100 °C for 4 h and calcined at 550 °C for 5 h with a heating rate of 1 °C min−1. The supports were labelled as Al-15(X), where X is the molar ratio of Si/Al.
The materials SBA-15, Al-15(X) and γ-Al2O3 (purchased from Zibo Xinshan Aluminium Co., PRC) were used as supports for the NiMo catalysts. The catalysts were prepared by the sequential impregnation method using ammonium heptamolybdate and nickel nitrate successively.18 The molybdate was dissolved in 0.5 M oxalic acid. The oxalic acid can help to remove the extra-framework Al species formed during the calcination step.19 After each impregnation step, the samples were dried overnight at room temperature, then dried at 100 °C for 4 h and calcined at 550 °C for 4 h. The theoretical metal loadings of the catalysts were: 12 wt% of MoO3 and 3 wt% of NiO.3
2.2 Characterization
The textural properties of the samples were measured by N2 adsorption–desorption isotherms at −196 °C using a Micromeritics ASAP 2420 apparatus. Before the measurements, the samples were degassed at 300 °C for 6 h. The surface areas were calculated by the Brunauer–Emmett–Teller (BET) equation, the pore volumes were determined from the adsorption isotherm at P/P0 = 0.99, and the pore size distributions were obtained from the desorption isotherms using the Barrett–Joyner–Halenda (BJH) method. Before determining the textural characteristics of the supports and catalysts, all of the powder materials were tableted by tablet machine at 24 MPa for 30 min. The elementary compositions of the samples were determined by ICP-OES. The low-angle (2θ = 0.7–5.0°) and the wide-angle (2θ = 5.0–90°) X-ray diffraction (XRD) patterns of the samples were measured by a PANalytical Advance powder diffractometer. The low-angle XRD patterns used Cu Kα radiation (λ = 1.5406 Å) and a Soller slit of 0.04°. The wide-angle XRD patterns were obtained at a scanning rate of 4° min−1, and the X-ray tube was set at 40 kV and 40 mA. 27Al MAS NMR was performed on a Bruker AVANCE III 600 spectrometer at the resonance frequency of 156.4 MHz using a 4 mm HX double-resonance MAS probe at a sample spinning rate of 14 kHz and recorded by the small-flip angle technique with a pulse length of 0.5 μs (<π/12), recycle delay of 1 s and 2000 scans. The chemical shift of 27Al was referenced to 1 M aqueous Al(NO3)3. H2-TPR experiments were performed using a home-built apparatus with a TCD detector. The heating rate was 10 °C min−1 from 120 °C to 1000 °C under a 10% H2/Ar stream (30 mL min−1). Pyridine-FTIR was conducted on a PE FT-IR spectrometer. The samples were dehydrated at 350 °C for 1 h under a vacuum of 10−2 Pa, followed by adsorption of pure pyridine vapor at room temperature for 30 min. Then the system was evacuated at 200 °C and 350 °C sequentially for 1 h, and finally FT-IR spectra were recorded. The quantification of the acid sites by pyridine desorption used the following equation:| C = B × S/(f × m) | (1) |
2.3 Catalytic activity
The HDS activities of catalysts were evaluated using 1.0 wt% DBT in cyclohexane. The reactions were carried out in a fixed-bed microreactor with a 4 mL stainless steel tube, and the reaction process diagram is presented in Scheme 1 of the ESI.† 0.38 g of catalyst was diluted with quartz sand, and both ends were plugged off with silica wool. The catalysts were pre-sulfided with 2.0 wt% CS2/cyclohexane solution at 320 °C, and 4 MPa hydrogen pressure for 4 h. In a typical reaction for activity test, the hydrogenation reaction conditions were 4 MPa, volumetric ratio of hydrogen to oil of 180 and the liquid hourly space velocity (LHSV) was varied in the range from 2 to 20 h−1. There was 12 h for catalyst stabilization, and another 4 h to collect the liquid product. All samples were detected by a DSQ GC-MS apparatus coupled with an Rtx-1 capillary column (60 m, 0.25 mm, 0.25 μm).2.4 Kinetic analysis
The HDS of DBT is considered to follow a pseudo-first-order reaction on NiMo/Al2O3 and other catalysts.20,21 The apparent rate constants can be calculated by eqn (2):
 | (2) |
 | (3) |
3. Results
3.1 Characterization of supports
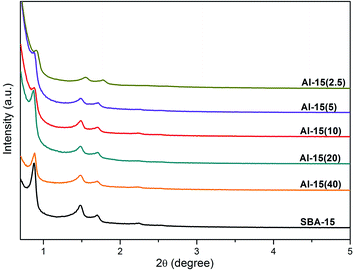
As Fig. 1 shows, the three well-resolved diffraction peaks (2θ = 0.9°, 1.6° and 1.8°) are indexed to (100), (110) and (200) reflections of p6mm hexagonal symmetry, respectively.23 It can be seen that the three characteristic diffraction peaks are still found for the Al promoted materials, confirming that the highly ordered p6mm mesoporous structure is preserved after the direct synthesis. Additionally, Al-15(X) shows lower d-spacing than SBA-15, which is likely due to the slight deformation of mesoporous channels and pore wall thickening caused by Al incorporation, especially extra-framework.24As listed in Table 1, silica–alumina supports have large surface areas, ranging from 669.83 m2 g−1 to 438.68 m2 g−1. Compared to pure SBA-15, Al-15(X) shows decreasing surface area, pore volume and pore size as the Si/Al ratio is increased. For example, the pore volume decreased from 1.18 cm3 g−1 for SBA-15 to 0.80 cm3 g−1 for Al-15(2.5), indicating that the high loading of extra-framework Al can cause the deterioration of THE pore structure to a certain degree. The N2 adsorption–desorption isotherms and pore size distribution curves of THE supports are shown in Fig. S + 1.† All the silica supports exhibit a type IV isotherm with a H1-type hysteresis loop in the range P/P0 = 0.6–0.8, indicating that the highly ordered structure and mesoporous channels of Al-15(X) are preserved. All materials show a main peak on the pore-size distribution curve, ranging from 3 to 10 nm. In comparison, SBA-15 has an intensive peak at 8 nm, Al-15(X) shows a slight shift to the left as the Si/Al ratio is decreased, which is probably caused by the accumulation of Al clusters on the inner channel wall.
| Sample | SBET (m2 g−1) | VP (cm3 g−1) | Dpa (nm) | Si/Alb |
|---|---|---|---|---|
| a Pore diameter was determined from the desorption isotherms by the BJH method.b The Si/Al molar ratio, determined by ICP-OES. | ||||
| SBA-15 | 669 | 1.18 | 8.8 | |
| Al-15(40) | 534 | 1.12 | 8.4 | 41.16 |
| Al-15(20) | 522 | 1.04 | 8.4 | 20.86 |
| Al-15(10) | 502 | 0.90 | 7.9 | 12.03 |
| Al-15(5) | 453 | 0.84 | 7.5 | 5.21 |
| Al-15(2.5) | 438 | 0.80 | 7.0 | 2.70 |
| γ-Al2O3 | 244 | 0.37 | 5.1 | |
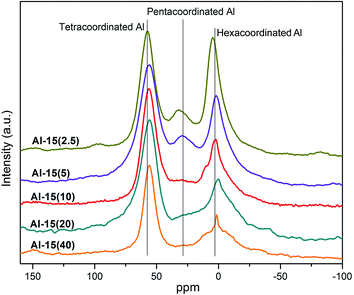
As demonstrated in Fig. 2, the peak at 53 ppm is assigned to the tetracoordinated Al, which is considered to be the framework Al species.25 The peaks at approximately 30 ppm and 0 ppm are characteristic of pentacoordinated and hexacoordinated Al species respectively, which are identified as extra-framework Al.13,19 According to the results presented in Fig. 2, the proportion of extra-framework Al species increases with the total Al loading, especially for the hexacoordinated Al species, and small amounts of the pentacoordinated Al species appear when the Si/Al ratio is decreased to 5. The intensity of the peak at 53 ppm is stronger than those of the other two coordinated species at all Si/Al ratios, which means Al atoms mainly exist in the framework structure by this direct synthetic method.
As shown in Fig. 3 and Table 2, the pyridine adsorption IR spectra after degassing at 200 and 350 °C are associated to the amounts of total and strong acid sites, respectively. The peaks at wavenumbers of approximately 1450 and 1540 cm−1 in the IR spectra are assigned to pyridine adsorbed onto L and Brønsted acid sites, respectively. The peak at 1490 cm−1 is attributed to pyridine adsorbed onto a combination of B and Lewis acid sites.21,26 After degassing at 200 °C, γ-Al2O3 has few Lewis acid acids and SBA-15 has even fewer. Brønsted acid sites are initially found at a Si/Al ratio of 40 and reach the highest when the Si/Al ratio is 10. This is attributed to the formation of Si–OH–Al bonds, which are regarded as the locations of Brønsted acid sites. These acid groups partly substitute the Si–OH groups that display nearly no acidity on the surface of SBA-15, thus dramatically enhancing the surface acid environment of the support. When the Si/Al decreases further, the extra-framework Al aggregate on the surface, leading to the simultaneous decrease of Brønsted acid sites and increase of Lewis acid sites. There is little pyridine adsorbed on strong Brønsted acid sites after degassing at 350 °C, indicating that Al-15(X) materials have few strong Brønsted acid sites. Besides, Lewis acid sites presents less change and follow the order of Al-15(2.5) > Al-15(5) > Al-15(10) > Al-15(20) > Al-15(40) > γ-Al2O3 > SBA-15. The acid density of Al-15(X), calculated from the amounts of B + L acid sites on a unit surface area, increases with the increase in the amount of incorporated Al.
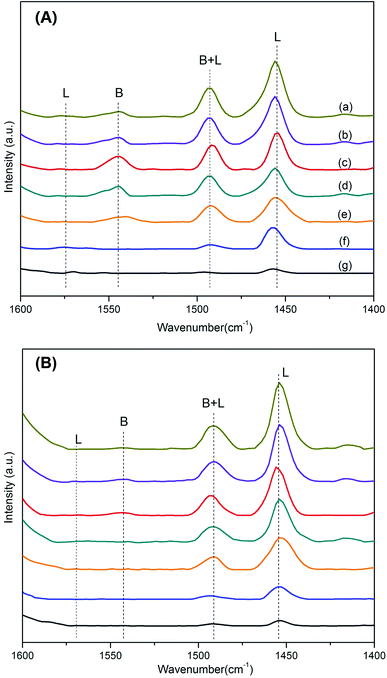 | ||
| Fig. 3 FTIR spectra of pyridine adsorbed on (a) Al-15(2.5), (b) Al-15(5), (c) Al-15(10), (d) Al-15(20), (e) Al-15(40), (f) γ-Al2O3 and (g) SBA-15 after degassing at 200 °C (A) and 350 °C (B). | ||
| Sample | 200 °C | 350 °C | ||||||
|---|---|---|---|---|---|---|---|---|
| B (μmol g−1) | L (μmol g−1) | B + L (μmol g−1) | ρB+La (μmol m−2) | B (μmol g−1) | L (μmol g−1) | B + L (μmol g−1) | ρB+La (μmol m−2) | |
| a Acid density was obtained by dividing total acid (B + L) by SBET. | ||||||||
| SBA-15 | 0.0 | 14.5 | 14.5 | 0.02 | 0.0 | 8.6 | 8.6 | 0.01 |
| Al-15(40) | 37.1 | 113.0 | 150.1 | 0.28 | 0.0 | 88.0 | 88.0 | 0.16 |
| Al-15(20) | 46.1 | 114.3 | 160.4 | 0.31 | 0.0 | 93.8 | 93.8 | 0.18 |
| Al-15(10) | 65.6 | 124.5 | 190.1 | 0.38 | 6.6 | 105.3 | 111.9 | 0.22 |
| Al-15(5) | 32.6 | 189.7 | 222.3 | 0.4 | 5.6 | 122.4 | 128.0 | 0.28 |
| Al-15(2.5) | 29.3 | 230.4 | 259.7 | 0.44 | 3.8 | 146.5 | 150.2 | 0.34 |
| γ-Al2O3 | 0.0 | 76.3 | 76.3 | 0.31 | 0.0 | 27.3 | 27.3 | 0.11 |
Overall, the properties of the support are a key factor in determining the catalytic activities of hydrogenation catalysts. Enhanced Al-15(X) materials present excellent structural and acidity properties. The highly ordered mesoporous structures are still preserved after a series of hydrothermal treatments. Although there is slight pore-blocking on Al-15(X) compared with pure SBA-15, Al atoms are incorporated into the framework of silica effectively. The increase of Al loading is conducive to increasing the total acid densities of Al-15(X) and forming more Brønsted acid centres at low Al loading on the surface.
3.2 Characterization of catalysts
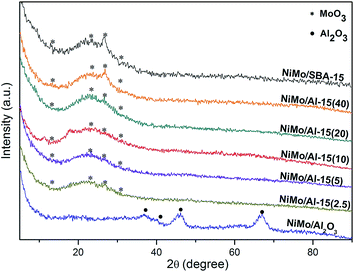
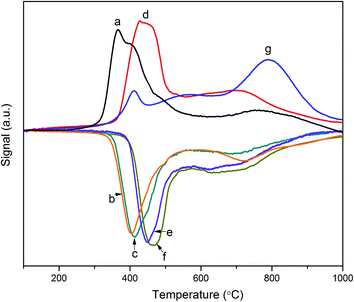
As Fig. 4 shows, the broad peak around 2θ = 25° is the characteristic diffraction of amorphous silica materials.27 The four peaks denoted by dots are attributed to γ-Al2O3 and the four asterisks correspond to different crystal planes of MoO3.28 It was found that NiMo/SBA-15 has four visible peaks that are attributed to MoO3, especially for the dominant crystal plane (021) located at 2θ = 27.4°, revealing that the active phase has a poor distribution on the pure silica support. Conversely, these four peaks are weaker for NiMo/Al-15(X) with low Al loading, indicating that the introduction of Al stimulates the distribution of the active phase on the surface of the enhanced supports. In addition, due to the increased acid density, NiMo/Al-15(X) does not present any crystalline molybdenum at high Al loading, meaning that the active phases are finely distributed over the surface of supports.As demonstrated in Fig. 5, the results reveal that the properties of the support have a serious effect on the shapes and peak positions of the TPR patterns. The main peak, ranging from 300 to 450 °C, is attributed to the first reduction stage of polymeric octahedral Mo species (Mo6+ → Mo4+), and the reduction process of NiO (Ni2+ → Ni0) also happens in this stage. These two metal oxide species are considered to have weak interactions with supports.29 It is speculated that a new multiphase NiMoOx is formed during the active metal impregnation step. The shoulder peak at approximately 500–700 °C can be ascribed to the second reduction step of polymeric octahedral Mo species (Mo4+ → Mo0). The last reduction temperature range, from 700 to 1000 °C, belongs to the tetrahedrally coordinated Mo species, which have strong interactions with the supports and are difficult to reduce.30 The NiMo/γ-Al2O3 catalyst has the highest proportion of tetrahedrally coordinated Mo species, which is caused by the strong interaction between γ-Al2O3 and active metal linked by stable Al–O–Mo bonds.31 NiMo/SBA-15 shows the lowest temperature for the first reduction stage due to the weak metal–support interaction. The NiMo/Al-15(X) catalysts have a big low reduction peak around 450 °C. At the same time, this peak shifts to higher temperatures with the increase of Al loading, indicating stronger metal–support interactions at lower Si/Al ratios. Notably, the NiMo/Al-15(10) catalyst has medium metal–support interaction compared with that of other Si/Al ratios of silica–alumina.
Fig. 6 presents the typical HRTEM images of SBA-15 and sulfide catalysts. The highly ordered hexagonal mesoporous structures of the silica materials can be observed directly at low magnification. The statistical analysis of the average slab length and stacking layers of active sites for sulfided catalysts are obtained by counting 30 typical micrographs with 300 slabs, and the results are presented in Table 3. It can be seen that NiMo/SBA-15 has the poorest slab distribution compared to the others, and NiMo/γ-Al2O3 shows the lowest stacking layer numbers. The basal active metal atoms preferentially and highly scatter on the surface of γ-Al2O3 because it can reduce the surface energy from both extensive coordinative vacancies and electrostatic imbalance sites.32 Thus, the upper layers of NiMoS slabs cannot exist stably and nearly all of them exist as monolayers and in short states over the NiMo/γ-Al2O3 catalysts. The oxygen atoms that connect Mo with Al are hard to be substituted by sulfur. On the contrary, the pure SBA-15 surface has few acid sites due to the inert Si–OH groups. This neutral and regular surface leads to weak metal–support interactions, due to which the active slabs exhibit the greatest length and highest stacking over the NiMo/SBA-15 catalyst. NiMo/Al-15(X) shows a shorter average slab length than the pure silica support, initially decreasing to 4.20 and increasing when the Si/Al ratio is 5. NiMo/Al-15(10) possesses the highest fMo value, indicating the best distribution of the active phase, which is also consistent with the wide-angle XRD results. It is reasonable to speculate that Al atoms already homogeneously cover the whole surface when the Si/Al ratio is 10, and even show slight aggregation to form Al clusters at higher Al loading, which is consistent with the wide-angle XRD result of Al-15(2.5). Thus, the NiMoS slabs can grow to higher lengths on this totally covered surface. The layer stacking number of NiMo/Al-15(X) decreases with increasing Al loading. It is probable that a higher acid density will lead to stronger metal–support interactions for the silica supports. This provides a reasonable explanation for the decrease in the layer stacking of NiMo/Al-15(X) with increasing Si/Al ratio.
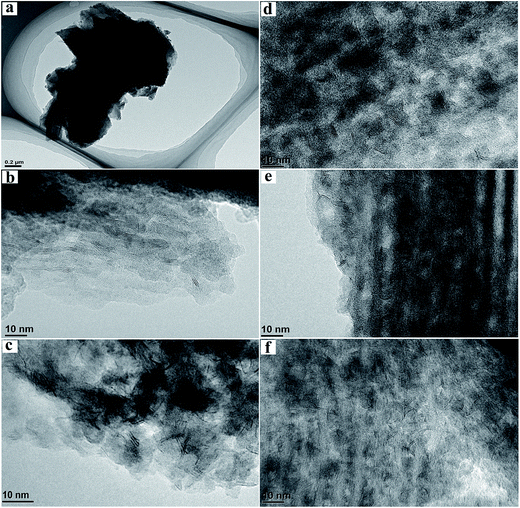 | ||
| Fig. 6 HRTEM images of the support and sulfided catalysts. (a) SBA-15; (b) NiMo/SBA-15; (c) NiMo/γ-Al2O3; (d) NiMo/Al-15(40); (e) NiMo/Al-15(10); (f) NiMo/Al-15(2.5). | ||
| Sample | Lav (nm) | Nav | fMo |
|---|---|---|---|
| NiMo/SBA-15 | 7.6 | 4.1 | 0.16 |
| NiMo/Al-15(40) | 5.7 | 3.7 | 0.21 |
| NiMo/Al-15(20) | 4.9 | 3.4 | 0.24 |
| NiMo/Al-15(10) | 4.2 | 3.1 | 0.28 |
| NiMo/Al-15(5) | 4.4 | 2.9 | 0.27 |
| NiMo/Al-15(2.5) | 4.8 | 2.4 | 0.25 |
| NiMo/γ-Al2O3 | 4.5 | 1.6 | 0.26 |
3.3 Catalytic activity
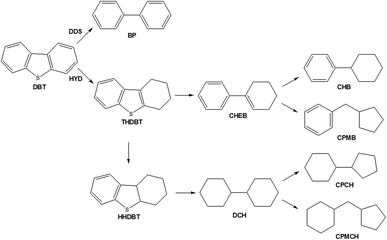
The catalytic activities of NiMo/SBA-15, NiMo/Al-15(X) and NiMo/γ-Al2O3 were evaluated for the HDS of DBT. Generally, there are two pathways: direct desulfurization (DDS) and hydrogenation of HDS (HYD). DDS is indicated by the formation of biphenyl (BP), correlating with the direct hydrogenolysis of the C–S bond. HYD mainly produces cyclohexylbenzene (CHB) and cyclohexenylbenzene (CHEB) via the hydrogenation of tetrahydrodibenzothiophene (THDBT) and hexahydrodibenzothiophene (HHDBT). Fig. 7 presents the reaction network of the DBT HDS reaction, which is obtained by combining the results of other studies and the detected products in this work (Fig. S + 2†).12,33,34The product distributions of DBT HDS, with 50 ± 5% HDS conversion by changing LHSV, are presented in Table 4. Compared to other catalysts, NiMo/γ-Al2O3 has the highest BP selectivity of 76.29%, indicating that DDS is the main pathway on this catalyst. NiMo/Al-15(X) catalysts have lower BP yields and the BP yield increases with the decrease of the Si/Al ratio, from 58.41% to 66.17% (Fig. S + 3†). CHB is formed in the highest proportion on all hydrogenation products and reaches a higher yield of 25.38% on NiMo/SBA-15, indicating better hydrogenation activity on this catalyst than on NiMo/γ-Al2O3. At the same time, cyclopentylcyclohexane (CPCH) and some other isomerization productions, such as cyclopentylmethylcyclohexane (CPMCH) and cyclopentylmethylbenzene (CPMB), are found over NiMo/Al-15(X) catalysts, indicating their higher isomerization ability.19 This isomerization ability of NiMo/Al-15(X) catalysts can have a positive effect on the HDS of 4,6-dimethyldibenzothiophene (4,6-DMDT).35–37
| Catalyst | Product composition (%) | ||||||||
|---|---|---|---|---|---|---|---|---|---|
| CPCH | CPMCH | CPMB | DCH | CHB | CHEB | BP | HHDBT | HDBT | |
| NiMo/SBA-15 | 0.5 | 1.0 | 0.8 | 25.4 | 4.3 | 61.7 | 1.9 | 4.5 | |
| NiMo/Al-15(40) | 0.5 | 0.3 | 3.2 | 0.6 | 25.0 | 5.5 | 58.4 | 1.9 | 4.6 |
| NiMo/Al-15(20) | 1.0 | 0.3 | 3.6 | 0.3 | 20.5 | 7.1 | 60.6 | 1.7 | 5.0 |
| NiMo/Al-15(10) | 1.6 | 0.2 | 3.7 | 0.3 | 21.2 | 5.9 | 62.4 | 0.9 | 3.9 |
| NiMo/Al-15(5) | 1.8 | 4.1 | 18.9 | 5.6 | 65.4 | 1.1 | 3.1 | ||
| NiMo/Al-15(2.5) | 1.8 | 4.2 | 17.5 | 5.2 | 66.2 | 2.5 | 2.7 | ||
| NiMo/γ-Al2O3 | 1.0 | 0.5 | 15.4 | 2.5 | 76.3 | 0.8 | 3.5 | ||
In order to further define the selectivity of DDS and HYD over all catalysts, quantitative calculation were performed using eqn (4) and (5):38
 | (4) |
 | (5) |
As listed in Table 5, NiMo/SBA-15 presents the lowest values of k and TOF, which is due to the poor metal distribution. In addition, due to the strong metal–support interaction, NiMo/γ-Al2O3 has a lower catalytic activity although its kDDS/kHYD ratio is the highest. There is an obvious increase in the rate constant and TOF over NiMo/Al-15(40). This superiority is attributed to both the improvement of textural characteristics and the number of accessible active sites over the catalyst. The suitable metal–support interaction of NiMo/Al-15(40) favors the improvement in active phase distribution to yield more accessible active sites for the catalytic reaction. For the same reason, NiMo/Al-15(10) exhibits the highest k and TOF of 8.64 × 10⁻⁴ mol h−1 g−1 and 1.33 × 10⁴ s−1, respectively. However, this improvement is limited at lower Si/Al ratios, indicating that supports with a high acidic density are less beneficial to the activity of catalysts. NiMo/Al-15(X) have increased kDDS/kHYD ratios at higher contents of incorporated Al, indicating that the hydrogenolysis of C–S bonds occurs easily on the active phase with a low stacking number in the morphology.
| Catalyst | TOF (104 s−1) | Rate constants (10−4 mol h−1 g−1) | Ratio | ||
|---|---|---|---|---|---|
| k | kDDS | kHYD | kDDS/kHYD | ||
| NiMo/SBA-15 | 0.68 | 2.6 | 1.6 | 0.8 | 1.93 |
| NiMo/Al-15(40) | 1.24 | 6.1 | 3.6 | 2.1 | 1.67 |
| NiMo/Al-15(20) | 1.28 | 7.2 | 4.4 | 2.4 | 1.84 |
| NiMo/Al-15(10) | 1.33 | 8.6 | 5.4 | 2.8 | 1.9 |
| NiMo/Al-15(5) | 1.29 | 8.0 | 5.2 | 2.4 | 2.16 |
| NiMo/Al-15(2.5) | 1.26 | 7.3 | 4.8 | 2.1 | 2.31 |
| NiMo/γ-Al2O3 | 0.94 | 5.8 | 4.4 | 1.1 | 3.93 |
As shown in Fig. 8, all catalysts exhibit increased HDS conversion at higher temperature, reaching nearly 90% at 310 °C, except for NiMo/SBA-15. The HDS conversion of DBT increases in the order NiMo/SBA-15 < NiMo/γ-Al2O3 < NiMo/Al-15(40) < NiMo/Al-15(20) < NiMo/Al-15(2.5) < NiMo/Al-15(5) < NiMo/Al-15(10). This result shows the same tendency as that of the rate constants of HDS at 270 °C. The superiority of NiMo/Al-15(10) in HDS conversion can be attributed to the excellent textural characteristics as well as active phase distribution. NiMo/SBA-15 has a poor distribution of NiMoS phase, due to which it cannot supply enough active sites for the HDS reaction. On the contrary, NiMo/γ-Al2O3 has a high metal distribution, but its nearly monolayer MoS2 slabs cannot provide more accessible active sites for DBT molecules. Besides, Fig. S + 4† shows that the NiMo/Al-15(10) catalyst has good catalytic stability during DBT HDS.
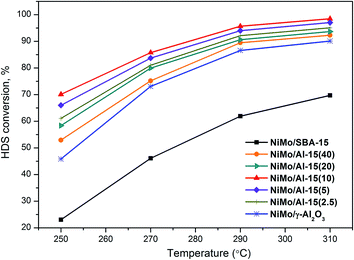 | ||
| Fig. 8 HDS conversion of DBT at different temperatures over NiMo catalysts supported on various supports with the LHSV of 10.53 h−1. | ||
4. Discussion
4.1 Effect of support properties on the morphology of active phases
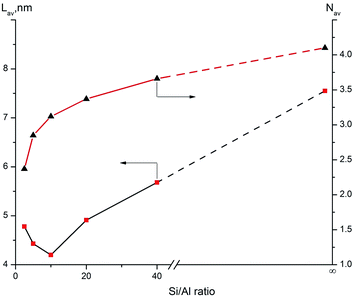
Support properties have an important effect on the distribution of active phases. Al-15(X) materials possess favorable pore structure properties and acidity, which can be controlled by changing the Si/Al ratio. Such control can help to study the relationship between the support properties and catalytic ability of the hydrogenation catalyst. Fig. 9 presents the effect of the Si/Al ratio on the average layer length and stacking number of slabs over NiMoS/Al-15(X) catalysts. It can be seen that the average layer stacking numbers increase with the Si/Al ratio. However, the average layer length initially decreases at low Al content, showing the shortest value at the Si/Al ratio of 10. It then increases again at higher Al contents. It is widely accepted that the dispersion of the active phase has a significant impact on the support–metal interaction. On one hand, the stacking number of layers is dramatically affected by the properties of the support.39 Weak metal–support interaction on silica supports can lead to the formation of more type II NiMoS, which is considered as the more active phase. However, excessive stacking decreases the number of active sites and the utilization rate of metals. It is reasonable to consider that there is a quantifiable relationship between acid density and support–metal interaction for silica supports. The pure SBA-15 surface has a very low acidity and even smaller acid density due to the large surface area. Al-15(2.5) possesses a high acid density, which leads to strong interactions with oxide precursors. Thus, there is more active phase with low stacking numbers (2.37). When Al atoms are introduced in small amounts, the average stacking number of the active phase decreases markedly as compared to NiMo/SBA-15. This can result in the formation of more of the suitable multi-layers, namely, the type II NiMoS active phase, which is expected to have a greater contribution to the dynamic migration of sulfur atoms or the formation of adjacent vacancies. This can partly explain the superior activity of NiMo/Al-15(10). On the other hand, the support–metal interaction affects the average layer-length of NiMoS slabs. The active phase with short length can increase the rate of the “corner sites”, which are considered as the key active sites during HDS reaction. The properties of the support surface easily impact the extension of NiMoS slab length. γ-Al2O3 has an irregular and rough surface, which limits the growth of NiMoS slabs to a longer length.32,40 Pure SBA-15 has a smooth and regular surface due to the neutral Si–OH groups, and NiMoS slabs can grow longer on this moderate surface. However, the average layer-length of the active phase shows more complex changes on NiMoS/Al-15(X) catalysts. When small amounts of Al atoms are introduced into the silica material, these interspersed Al atoms promote the metal–support interaction. At the same time, Al atoms decrease the surface periodicity of the support in the atomic scale, which can be described as the rough surface. Thus, the migration of Mo and Ni precursors is limited on that rough surface, leading to a shorter average length of NiMoS slabs. The roughness of the support surface is highest when the Si/Al ratio is 10. At a ratio of 5, the Al atoms almost cover the entire silica surface. In this case, the surface periodicity is improved for a certain degree, leading to NiMoS slabs with greater layer lengths. Thus, we speculate that the average slab length is probably affected by the roughness of the support surface.4.2 Effect of the morphology of the active phase on the selectivity of yields for DBT HDS
It is widely accepted that the morphology of the active phase has an important impact on the yield selectivity of DBT HDS.20,41,42 Fig. 10 presents the morphology of the active phase over NiMoS/Al-15(X) catalysts on the TOF and kDDS/kHYD of DBT HDS. A bigger fMo of the NiMoS/Al-15(X) catalysts lead to a higher TOF value. Meanwhile, the HYD selectivity increases along with the average stacking number of the NiMoS/Al-15(X) catalysts. It is indicated that the change of active phase morphology affects the catalytic properties of NiMoS/Al-15(X) catalysts and the reaction selectivity of DBT HDS. Moreover, we speculate that the morphology of the active phase not only affects the adsorption geometry of the reactant molecules but also the amounts of both hydrogenolysis and hydrogenation active sites.41,43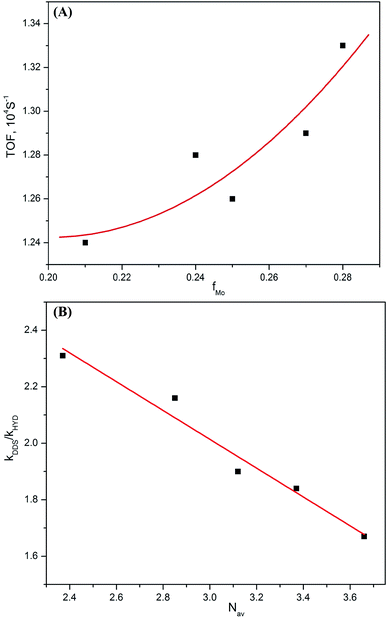 | ||
| Fig. 10 Effect of fMo (A) and Nav (B) of NiMoS/Al-15(X) catalysts on the TOF and kDDS/kHYD ratio of DBT HDS at 543 K. | ||
It has been accepted that the hydrogenolysis of DBT first needs a perpendicular absorption mode on the edge of the active phase, and the flat adsorption mode is an essential prerequisite for the hydrogenation of aromatic rings.43 The coordinatively unsaturated sites (CUS) located on the edge of MoS2 slabs are attributed to the active sites that undergo perpendicular adsorption, as reported in some studies.3,44 This adsorption mode is hardly affected by the layer stacking of the NiMoS slabs, thus, the NiMo/Al-15(X) catalysts have greater BP yields at higher incorporated Al contents, as shown in Fig. 10. Recently, the planar adsorption of aromatic rings has been associated with the adjacent CUS on the Mo-edge.43 Moreover, the adsorption and hydrogenation of thiophenic rings have been associated with the “brim sites” near the edge of the sulfide MoS2 phase.45 In either case, HYD of DBT will be limited by the number of accessible active sites and the size of the DBT molecule. Therefore, the HYD of DBT over a multilayer NiMoS slab has a higher selectivity.
Although there is still no consensus about the location of active sites, there is wide agreement that active sites for both hydrogenolysis and hydrogenation, which are responsible for the DDS and HYD routes of DBT and HDS, respectively, exist together on the MoS2 slabs. The “rim-edge” model proposes that the hydrogenolysis sites are located on the edge of the MoS2 slabs and the hydrogenation reaction occurs only on the slab rims, namely the extra-CUS on the un-enhanced catalysts.46 However, a different view of active sites has been proposed, involving brim sites that are located near the edge of MoS2 nanoclusters.6,45 Such brim sites are considered to catalyse the C–S bond hydrogenolysis and hydrogenation reactions of thiophene. In summary, due to the selectivity results of DBT HDS (Tables 4, 5 and Fig. 10), it is reasonable to speculate that suitable multi-layers, which favor the hydrogenation reaction of DBT while introducing Al into silica supports, can help the hydrogenolysis reaction.
5. Conclusions
High hydrodesulfurization (HDS) activity NiMo/Al-15(X) catalysts were prepared successfully with direct synthetic supports. Al-15(10) had the highest number of Brønsted acid sites and the total acid density of Al-15(X) increased with the Al content. NiMo/Al-15(X) catalysts showed increasing metal–support interactions with increasing Al content. The average stacking number of NiMoS slabs decreased with the Si/Al ratio, and the layer length was the shortest at the Si/Al ratio of 10. The properties of Al-15(X) determined the morphology of the active phase. Furthermore, the average stacking number is easily affected by the acid density (or metal–support interactions), while the average slab length is probably affected by the roughness of the support surface. The morphology of the active phase impacts the reaction selectivity of DBT HDS.Acknowledgements
This study was financially supported by the Union Fund of National Natural Science Foundation of China and CNPC (Grant No. U1362203 and No. U1462117).References
- C. Yin and D. Xia, Fuel, 2004, 83, 433–441 CrossRef CAS.
- G. M. Kumaran, S. Garg, K. Soni, V. V. D. N. Prasad, L. D. Sharma and G. M. Dhar, Energy Fuels, 2006, 20, 1784–1790 CrossRef CAS.
- O. Y. Gutiérrez and T. Klimova, J. Catal., 2011, 281, 50–62 CrossRef.
- J. N. Wang, Y. M. Yuan, A. Shuai, J. Xu and J. Y. Shen, RSC Adv., 2015, 5, 74312–74319 RSC.
- D. Valencia and T. Klimova, Catal. Today, 2011, 166, 91–101 CrossRef CAS.
- H. Topsøe, Appl. Catal., A, 2007, 322, 3–8 CrossRef.
- A. Infantes-Molina, A. Romero-Pérez, V. Sánchez-González, B. Pawelec, J. L. G. Fierro, A. Jiménez-López and E. Rodríguez-Castellón, ACS Catal., 2011, 1, 175–186 CrossRef CAS.
- F. Cui, G. C. Li, X. B. Li, M. H. Lua and M. S. Li, Catal. Sci. Technol., 2015, 5, 549–555 CAS.
- O. Y. Gutiérrez, D. Valencia, G. A. Fuentes and T. Klimova, J. Catal., 2007, 249, 140–153 CrossRef.
- Y. R. Han, J. W. Park, H. Kim, H. Ji, S. H. Lim and C. H. Jun, Chem. Commun., 2015, 51, 17084–17087 RSC.
- P. Sharma and A. P. Singh, RSC Adv., 2014, 4, 58467–58475 RSC.
- O. Y. Gutiérrez, S. Singh, E. Schachtl, J. Kim, E. Kondratieva, J. Hein and J. A. Lercher, ACS Catal., 2014, 4, 1487–1499 CrossRef.
- T. Klimova, J. Reyes, O. Gutiérrez and L. Lizama, Appl. Catal., A, 2008, 335, 159–171 CrossRef CAS.
- B. Sun, L. Li, Z. Fei, S. Gu, P. Lu and W. Ji, Microporous Mesoporous Mater., 2014, 186, 14–20 CrossRef CAS.
- M. A. Betiha, H. M. A. Hassan, A. M. Al-Sabagh, A. S. Khder and E. A. Ahmed, J. Mater. Chem., 2012, 22, 17551–17559 RSC.
- T. R. Hughes and H. M. White, J. Phys. Chem., 1967, 71, 2192–2201 CrossRef CAS.
- T. Jiang, H. Tao, J. Ren, X. Liu, Y. Wang and G. Lu, Microporous Mesoporous Mater., 2011, 142, 341–346 CrossRef CAS.
- G. Muthu Kumaran, S. Garg, K. Soni, M. Kumar, L. D. Sharma, G. Murali Dhar and K. S. Rama Rao, Appl. Catal., A, 2006, 305, 123–129 CrossRef.
- Y. Li, D. Pan, C. Yu, Y. Fan and X. Bao, J. Catal., 2012, 286, 124–136 CrossRef CAS.
- P. A. Nikulshin, D. I. Ishutenko, A. A. Mozhaev, K. I. Maslakov and A. A. Pimerzin, J. Catal., 2014, 312, 152–169 CrossRef CAS.
- D. Gao, A. Duan, X. Zhang, Z. Zhao, H. E, J. Li and H. Wang, Appl. Catal., B, 2015, 165, 269–284 CrossRef CAS.
- H. Liu, Y. Li, C. Yin, Y. Wu, Y. Chai, D. Dong, X. Li and C. Liu, Appl. Catal., B, 2016, 198, 493–507 CrossRef CAS.
- D. Valencia and T. Klimova, Appl. Catal., B, 2013, 129, 137–145 CrossRef CAS.
- B. Dragoi, E. Dumitriu, C. Guimon and A. Auroux, Microporous Mesoporous Mater., 2009, 121, 7–17 CrossRef CAS.
- G. Muthu Kumaran, S. Garg, K. Soni, M. Kumar, J. K. Gupta, L. D. Sharma, K. S. Rama Rao and G. Murali Dhar, Microporous Mesoporous Mater., 2008, 114, 103–109 CrossRef.
- T. Kataoka and J. A. Dumesic, J. Catal., 1988, 112, 66–79 CrossRef CAS.
- G. M. Kumaran, S. Garg, K. Soni, M. Kumar, L. D. Sharma, K. S. Rama Rao and G. M. Dhar, Ind. Eng. Chem. Res., 2007, 46, 4747–4754 CrossRef CAS.
- S. Badoga, K. C. Mouli, K. K. Soni, A. K. Dalai and J. Adjaye, Appl. Catal., B, 2012, 125, 67–84 CrossRef CAS.
- R. López Cordero and A. López Agudo, Appl. Catal., A, 2000, 202, 23–35 CrossRef.
- S. Damyanova, A. Spojakina and K. Jiratova, Appl. Catal., A, 1995, 125, 257–269 CrossRef CAS.
- L. Peña, D. Valencia and T. Klimova, Appl. Catal., B, 2014, 147, 879–887 CrossRef.
- M. Digne, P. Sautet, P. Raybaud, P. Euzen and H. Toulhoat, J. Catal., 2002, 211, 1–5 CrossRef CAS.
- R. Huirache-Acuña, T. A. Zepeda, E. M. Rivera-Muñoz, R. Nava, C. V. Loricera and B. Pawelec, Fuel, 2015, 149, 149–161 CrossRef.
- R. C. Wei, Q. Q. Zhu, F. Han, Q. X. Guan and W. Li, RSC Adv., 2015, 5, 38774–38782 RSC.
- H. Wu, A. Duan, Z. Zhao, T. Li, R. Prins and X. Zhou, J. Catal., 2014, 317, 303–317 CrossRef CAS.
- T. E. Klimova, D. Valencia, J. A. Mendoza-Nieto and P. Hernández-Hipólito, J. Catal., 2013, 304, 29–46 CrossRef CAS.
- J. A. Mendoza-Nieto, O. Vera-Vallejo, L. Escobar-Alarcón, D. Solís-Casados and T. Klimova, Fuel, 2013, 110, 268–277 CrossRef CAS.
- C. Liu, H. Liu, C. Yin, X. Zhao, B. Liu, X. Li, Y. Li and Y. Liu, Fuel, 2015, 154, 88–94 CrossRef CAS.
- H. Wang, Z. Yao, X. Zhan, Y. Wu and M. Li, Fuel, 2015, 158, 918–926 CrossRef CAS.
- J. B. Peri, J. Phys. Chem., 1965, 69, 220–230 CrossRef CAS.
- P. A. Nikulshin, V. A. Salnikov, A. V. Mozhaev, P. P. Minaev, V. M. Kogan and A. A. Pimerzin, J. Catal., 2014, 309, 386–396 CrossRef CAS.
- E. J. M. Hensen, P. J. Kooyman, Y. van der Meer, A. M. van der Kraan, V. H. J. de Beer, J. A. R. van Veen and R. A. van Santen, J. Catal., 2001, 199, 224–235 CrossRef CAS.
- S. Cristol, J.-F. Paul, E. Payen, D. Bougeard, F. Hutschka and S. Clémendot, J. Catal., 2004, 224, 138–147 CrossRef CAS.
- F. Bataille, J.-L. Lemberton, P. Michaud, G. Pérot, M. Vrinat, M. Lemaire, E. Schulz, M. Breysse and S. Kasztelan, J. Catal., 2000, 191, 409–422 CrossRef CAS.
- J. Kibsgaard, A. Tuxen, K. G. Knudsen, M. Brorson, H. Topsøe, E. Lægsgaard, J. V. Lauritsen and F. Besenbacher, J. Catal., 2010, 272, 195–203 CrossRef CAS.
- M. Daage and R. R. Chianelli, J. Catal., 1994, 149, 414–427 CrossRef CAS.
Footnote |
| † Electronic supplementary information (ESI) available. See DOI: 10.1039/c6ra22083e |
| This journal is © The Royal Society of Chemistry 2016 |

