The biological in vitro effect and selectivity shown by a CoII complex of 2-(2-hydroxyphenylazo)-indole-3′-acetic acid on three distinctly different cancer cells†
Durba Gangulya,
Chetan Kumar Jainbc,
Ramesh Chandra Santraa,
Susanta Roychoudhuryb,
Hemanta Kumar Majumderc and
Saurabh Das *a
*a
aDepartment of Chemistry (Inorganic Section), Jadavpur University, Kolkata – 700 032, India. E-mail: sdas@chemistry.jdvu.ac.in; Tel: +91 89 02087756 Tel: +91 33 24572148
bCancer Biology & Inflammatory Disorder Division, Indian Institute of Chemical Biology, Kolkata-700032, India
cInfectious Diseases and Immunology Division, Indian Institute of Chemical Biology, Kolkata-700032, India
First published on 6th December 2016
Abstract
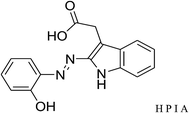
A major intention of this study was to use the modified toxicity of the azo moiety in [2-(2-hydroxyphenylazo)-1H-indol-3-yl]-acetic acid (HPIA), achieved through complex formation with CoII on some cancer cell lines. This is important because the azo functional group has not been tried in cancer chemotherapy. Keeping in mind aspects of drug resistance of some of the common anticancer drugs, a serious problem and a major clinical challenge in cancer chemotherapy, it is essential that new molecules are identified with anticancer activity. Although cytotoxicity of azo compounds is established there are not many reports that utilize them in cancer treatment. Another important aspect is to prepare compounds having preferential activity on cancer cells over normal cells so that toxic side effects are a minimum. Enzyme assay on the reductive cleavage of the azo bond showed complex formation with CoII almost completely checked the generation of cytotoxic amines implying that the complex could be less cytotoxic which was actually observed in case of normal healthy cells. Even though the complex formed less cytotoxic amines and possessed an almost similar binding ability with DNA like that of HPIA surprisingly its activity on three cancer cell lines namely human colon carcinoma HCT116 cells, acute lymphoblastic leukemia MOLT-4 cells and MCF-7 breast cancer cells was much greater than HPIA. The difference in activity between HPIA and its CoII complex on cancer cells showed no correlation with DNA binding or amine formation like that observed for normal cells. The complex probably possesses multiple modes of action whereby it is able to inhibit one or more cellular processes or functioning of different enzymes involved in the cell cycle of cancer cells for which it was found more effective.
1. Introduction
Azo dyes are an important class of chemical compounds that are widely used in industry and various chemical laboratories.1–13 Most dyes belonging to this class are toxic either causing dermatological and/or respiratory problems.12,14–20 When these compounds enter our bodies, they are metabolized to aromatic amines by intestinal micro-organisms.18,19,21–26 Reductive enzymes for example, present in the liver, catalyze the cleavage of azo bonds to aromatic amines and other products that are associated with undesirable toxicological effects.23–27 Modification of azo bond cleavage can prevent toxic effects which may be achieved through complex formation.28–30 Metal complexes of azo dyes have been the subject of current growing interest having pharmacological activity.30–33 The modified toxicity of metal–azo complexes could be utilized for beneficial activity. Although metal ions were used for medicinal purpose, potential metal based anti-cancer agents for example, have only been explored seriously since the landmark discovery of the biological activity of cisplatin.34–36 However, problems of platinum resistance and undesirable side effects are encouraging the search for alternative transition metal anticancer agents.In this work, the synthesis, characterization of a CoII complex of [2-(2-hydroxyphenylazo)-1H-indol-3-yl]-acetic acid (HPIA) is reported. Cleavage of the azo bond leading to the formation of amines was followed using cytochrome c reductase (a model azo-reductase) as well as azo-reductase obtained from bacterial cell extracts.23–27 To understand the biological implications of complex formation, DNA binding studies were performed with HPIA and the complex using fluorescence spectroscopy. Activity of the compounds was tested on three cancer cell lines ALL MOLT-4 cells, MCF-7 breast cancer cells, human colon carcinoma HCT116 cells and HEK293T normal cells.
2. Experimental
2.1 Materials
HPIA was prepared by coupling a cold (∼0 °C to 5 °C) diazotized solution of 2-aminophenol with a cold alkaline solution of indole-3-acetic acid.37 Cobalt chloride [CoCl2·6H2O] purchased from E. Merck, India was used to prepare the complex with HPIA. Stock solutions of HPIA and CoII(HPIA)2 (∼10−3 M) were either prepared in ethanol or dimethyl sulphoxide (DMSO). Phosphate buffer was prepared using sodium dihydrogen phosphate and disodium hydrogen phosphate procured from E. Merck, India. NADPH and calf thymus (c t) DNA were purchased from Sisco Research Laboratories, India. c t DNA was dissolved in phosphate buffer containing NaCl (120 mM), KCl (35 mM) and MgCl2 (15 mM) and kept overnight. Its absorbance was recorded at 260 nm and 280 nm respectively. Ratio of A260/A280 was determined and found to be in the range 1.8 < A260/A280 > 1.9 suggesting that the DNA is sufficiently free from protein. Concentration of DNA was determined in terms of nucleotide taking molar extinction coefficient at 260 nm to be 6600 M−1 cm−1. The CD spectrum of c t DNA showed a characteristic band at 260 nm. Titration of the compounds with DNA was performed in a solution containing 120 mM NaCl, 35 mM KCl, 15 mM MgCl2 and 10 mM phosphate buffer (∼pH 7.4). HEK293T and HCT116 cell lines were purchased from American Type Culture Collection (ATCC), Manassas, VA 20110 USA. MOLT-4 cells were received as a gift from Dr Chitra Mondal's laboratory at CSIR-Indian Institute of Chemical Biology, Kolkata while MCF-7 breast cancer cells were received as a gift from Dr Mrinal K. Ghosh's laboratory at CSIR-Indian Institute of Chemical Biology, Kolkata. Sodium nitrate of analytical grade (E. Merck, India) was used to maintain the ionic strength of the medium. All experiments were performed in triple distilled water.2.2 Methods
 | (1) |
L represents the complex and Kd the dissociation constant for the interaction. Eqn (2) helps to determine Kd from where the apparent binding constant (Kapp) was evaluated.39–44
 | (2) |
CD and CL denote concentration of c t DNA and the complex respectively. ΔF is the change in fluorescence of CoII(HPIA)2 at 370 nm while ΔFmax is the maximum change in fluorescence for the titration of the complex with c t DNA obtained as the inverse of the intercept of eqn (2). ΔF/ΔFmax was plotted against concentration of c t DNA and fitted to eqn (4) yielding Kd (=Kapp−1) using non-linear square fit analysis.39–44
 | (3) |
 | (4) |
A plot of ΔF/ΔFmax versus ratio of nucleotide to the complex yields “nb”, the number of nucleotide bound to each complex during interaction. The data obtained from the fluorescence titration of CoII(HPIA)2 with c t DNA was also analyzed according to Scatchard [eqn (5)] from where the intrinsic binding constant (K′) and site size (n) were evaluated.44
| r/Cf = K′(n − r) | (5) |
When concentration of free DNA is in reasonably good excess over the bound form of the compound apparent binding constant (Kapp) can also be determined with the help of another form of a double-reciprocal equation considering the equilibrium shown in eqn (1). The equilibrium constant for the interaction may then be written as
 | (6) |
If the total concentration of the compound is CL then at any point of the titration we may consider CL to be Cb + Cf that leads us to the condition
 | (7) |
This may be further modified to yield
 | (8) |
Hence K may be determined from the double reciprocal plot of  with y-intercept = 1 as the inverse of the slope.45 This binding constant K obtained using eqn (8) upon multiplication with nb also yields the overall binding constant (K′).
2.3 Equipments
Elemental analysis was carried out on 2400 SERIES II CHN Analyser, Perkin-Elmer. Infra-red spectra was recorded on Perkin Elmer RX-I spectrophotometer. UV-Vis spectra were recorded on a Jasco J-630 Spectrophotometer, JASCO, Japan. Mass spectrum was recorded on Micromass Q-T of micro™, Waters Corporation. pH was measured on an Elico LI 613 (India) pH meter.3. Results and discussion
3.1 Physicochemical studies on the formation of a CoII complex of HPIA
Mole ratio and Job's method of continuous variation performed at 510 nm demonstrates unambiguously the formation of a 1![[thin space (1/6-em)]](https://www.rsc.org/images/entities/char_2009.gif) :
:![[thin space (1/6-em)]](https://www.rsc.org/images/entities/char_2009.gif) 2 metal–ligand complex (Fig. 1S and 2S†). Stability constant was determined with the help of a pH-metric titration taking CoII and HPIA in the ratio 1
2 metal–ligand complex (Fig. 1S and 2S†). Stability constant was determined with the help of a pH-metric titration taking CoII and HPIA in the ratio 1![[thin space (1/6-em)]](https://www.rsc.org/images/entities/char_2009.gif) :
:![[thin space (1/6-em)]](https://www.rsc.org/images/entities/char_2009.gif) 2. Change in absorbance at 510 nm was followed in the pH range 3.0 to 11.0 and fitted to eqn (9) (Fig. 1).
2. Change in absorbance at 510 nm was followed in the pH range 3.0 to 11.0 and fitted to eqn (9) (Fig. 1).| Aobs = A1/(1 + 10pH−pK1 + 10pH−pK2) + A2/(1 + 10pK1−pH + 10pH−pK2) + A3/(1 + 10pK1−pH + 10pK2−pH) | (9) |
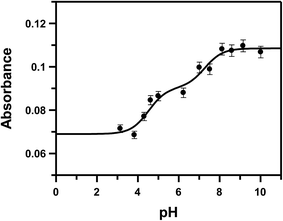 | ||
| Fig. 1 pH-metric titration of HPIA in the presence of CoII, shown by the variation in absorbance at 510 nm; [HPIA] = 450 μM, [CoII] = 225 μM, [NaNO3] = 0.1 M, temp. = 298 K. The solid line represents the fitted data according to eqn (9). | ||
If we consider HPIA to be LH2, A1, A2 and A3 denote the absorbance of LH2, LH− and L2− respectively in the presence of CoII. pK1 and pK2 values were 4.7 ± 0.15 and 7.3 ± 0.25 respectively. pK1 is the deprotonation of the carboxyl proton having a value similar to that of free HPIA thus indicating that the carboxyl group is not involved in binding the metal ion. The sharp decrease observed in case of pK2 from 10.42 for free HPIA to 7.3 indicates that the phenolic oxygen is involved in complex formation with the metal ion. Using pK2 of HPIA obtained in the absence and presence of CoII, formation constants β* and β may be described by eqn (10)–(14).39,43
| Co2+ + 2LH2 ⇌ Co(LH)2 + 2H+ | (10) |
 | (11) |
| Co2+ + 2LH− ⇌ Co(LH)2 | (12) |
 | (13) |
 | (14) |
The effective stability constant (β) of the complex was found to be 3.44 × 10¹³ (log![[thin space (1/6-em)]](https://www.rsc.org/images/entities/char_2009.gif) β = 13.53).
β = 13.53).
3.2 Characterization of the complex
![[thin space (1/6-em)]](https://www.rsc.org/images/entities/char_2009.gif) :
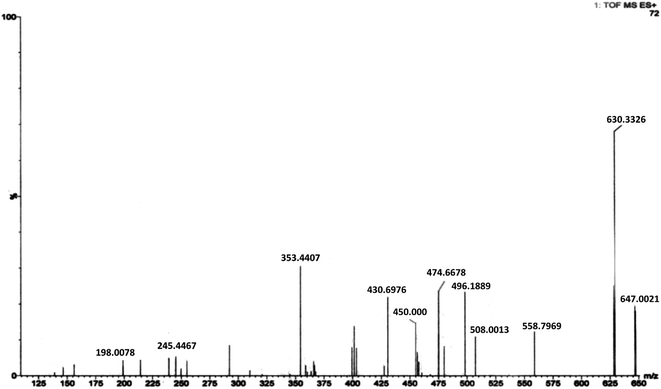
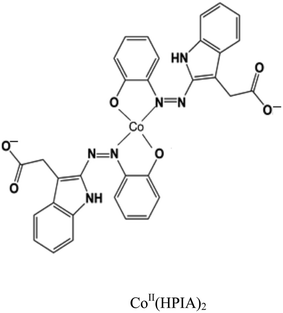
:![[thin space (1/6-em)]](https://www.rsc.org/images/entities/char_2009.gif) 2 stoichiometry [Co(LH)2] as predicted earlier from physico-chemical experiments that were performed in solution. Dissociation of an –OH group results in a peak with m/z = 630.33. Loss of the –CO2H unit from each ligand forms a species having m/z = 558.79 while loss of one ligand (HPIA) from the complex generates the 1
2 stoichiometry [Co(LH)2] as predicted earlier from physico-chemical experiments that were performed in solution. Dissociation of an –OH group results in a peak with m/z = 630.33. Loss of the –CO2H unit from each ligand forms a species having m/z = 558.79 while loss of one ligand (HPIA) from the complex generates the 1![[thin space (1/6-em)]](https://www.rsc.org/images/entities/char_2009.gif) :
:![[thin space (1/6-em)]](https://www.rsc.org/images/entities/char_2009.gif) 1 species for which the experimental peak was found at m/z = 353.44. A solvent (DMSO) molecule bound to the 1
1 species for which the experimental peak was found at m/z = 353.44. A solvent (DMSO) molecule bound to the 1![[thin space (1/6-em)]](https://www.rsc.org/images/entities/char_2009.gif) :
:![[thin space (1/6-em)]](https://www.rsc.org/images/entities/char_2009.gif) 1 species was detected at m/z = 430.69 while two solvent (DMSO) molecules bound to the same species was detected at m/z = 508.00. The mono-solvated 1
1 species was detected at m/z = 430.69 while two solvent (DMSO) molecules bound to the same species was detected at m/z = 508.00. The mono-solvated 1![[thin space (1/6-em)]](https://www.rsc.org/images/entities/char_2009.gif) :
:![[thin space (1/6-em)]](https://www.rsc.org/images/entities/char_2009.gif) 1 species when bound to Na appeared at m/z = 455.00. The peak at m/z = 474.66 corresponds to the species generated from the complex when one indole acetic acid unit breaks away from one of the ligands. This species bound to Na was detected at m/z = 498.18 (m/ztheo = 497.66).
1 species when bound to Na appeared at m/z = 455.00. The peak at m/z = 474.66 corresponds to the species generated from the complex when one indole acetic acid unit breaks away from one of the ligands. This species bound to Na was detected at m/z = 498.18 (m/ztheo = 497.66).
From the above characterizations, the CoII complex of HPIA has the structure given below
3.3 Reductive cleavage of the azo bond by enzyme assay
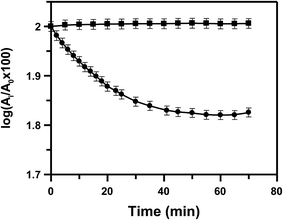 | ||
| Fig. 3 A comparison of the rate of reduction of HPIA (●) and CoII(HPIA)2 (■) in the presence of 653 μM NADPH and 12.3 U L−1 cytochrome c reductase. [HPIA] = [CoII(HPIA)2] = 250 μM. | ||
It should be mentioned here that CoII complexes of azo compounds show an interesting behavior with regard to the reduction of the azo bond i.e. there is hardly any reduction observed.28,30 CuII–azo complexes for example showed a relative decrease in the tendency of the azo bond to get reduced compared to the parent azo compound but it is never like what is seen for CoII-azo complexes, both having the same ligand.29,30
3.4 Binding of HPIA and Co(II)(HPIA)2 with c t DNA using fluorescence spectroscopy
Interaction of CoII(HPIA)2 with c t DNA was studied using fluorescence spectroscopy by exciting the solution at 280 nm and then measuring fluorescence emission at 370 nm. With gradual addition of c t DNA to a 250 μM solution of CoII(HPIA)2 a slight blue shift was observed in the emission spectra with a simultaneous decrease in intensity (Fig. 4).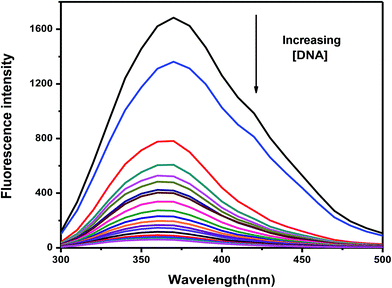 | ||
| Fig. 4 Fluorescence spectra of 250 μM CoII(HPIA)2 in 120 mM NaCl and Tris buffer in the absence and presence of increasing c t DNA concentrations; temperature = 298 K. | ||
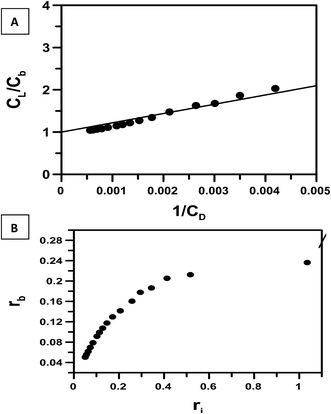
Titration of the complex with c t DNA was carried out five times. Binding isotherms were analyzed using eqn (2) (Fig. 5A), eqn (3) and (4) (Fig. 5B) and eqn (5) (Fig. 5D) considering the equilibrium in eqn (1). The calculation for binding parameters is based on the assumption that the decrease in fluorescence emission is a consequence of the interaction of the complex with c t DNA.
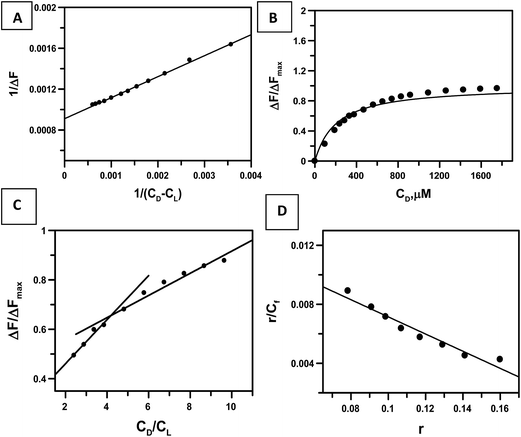 | ||
| Fig. 5 Plots showing an analysis of the interaction of CoII(HPIA)2 with calf thymus DNA that was followed with the help of UV-Vis spectroscopy. (A) is a double reciprocal plot that follows eqn (2); in case of (B) the dark line shows non-linear square fit analysis done according to eqn (4); (C) is a plot of normalized increase in fluorescence as a function of mole-ratio of calf thymus DNA to CoII(HPIA)2; (D) is the Scatchard plot for the interaction of CoII(HPIA)2 with calf thymus DNA. [CoII(HPIA)2] = 250 μM, [NaCl] = 120 mM; pH = 7.4; temperature = 298 K. | ||
Since fluorescence emission decreases it implies that the bound form of the complex has no fluorescence in this region and that the fluorescence observed with increase in DNA concentration is that due to the free form. Values for apparent and intrinsic binding constants are shown in Table 1. Overall binding constant values for the complex is almost comparable to cis and trans forms of HPIA determined earlier.37 Fig. 5C is a plot of ΔF/ΔFmax against the ratio of the concentration of nucleotide to the complex that provides a value for nb. Interestingly, this value for nb for the interaction of CoII(HPIA)2 with c t DNA is almost double that obtained for either cis or trans HPIA serving as yet another proof that the complex contains two HPIA molecules bound to CoII.39,43,48
| Compounds | Kapp obtained from double-reciprocal plot | Kapp obtained from non-linear curve fitting | nb from mole ratio plot | K′ = Kapp × nb (from double reciprocal plot) | K′ = Kapp × nb (from non-linear curve fitting) | K′ obtained from Scatchard plot | nb from Scatchard plot |
|---|---|---|---|---|---|---|---|
| cis HPIA37 | 7.12 × 10³ M−1 | 8.80 × 10³ M−1 | 2.7 | 1.92 × 10⁴ M−1 | 2.38 × 10⁴ M−1 | 2.05 × 10⁴ M−1 | 2.4 |
| trans HPIA37 | 7.45 × 10³ M−1 | 9.20 × 10³ M−1 | 2.8 | 2.09 × 10⁴ M−1 | 2.58 × 10⁴ M−1 | 2.37 × 10⁴ M−1 | 2.4 |
| Co(II)(HPIA)2 | 7.00 × 10³ M−1 | 8.93 × 10³ M−1 | 4.4 | 3.08 × 10⁴ M−1 | 3.92 × 10⁴ M−1 | 5.19 × 10⁴ M−1 | 4.5 |
The data obtained for the titration of the complex with c t DNA was also treated according to eqn (6)–(8). By plotting the data according to eqn (8) (Fig. 6A) apparent binding constant for the interaction of CoII(HPIA)2 with c t DNA was found to be 4.56 × 10³ M−1. Multiplying this value with nb, K′ was evaluated (2.05 × 10⁴ M−1). If one considers the average of all K′ values obtained for the interaction of CoII(HPIA)2 with c t DNA it can be seen that the binding of the complex with DNA is comparable to HPIA (Table 1). Fig. 6B relates to the ratio of input complex/DNA (ri) to the ratio of bound complex/DNA (rb) as derived from Scatchard calculations.44 In this plot, a 45° line indicates that the entire complex present in solution is bound to DNA.49
3.5 Cell viability studies using HPIA and CoII(HPIA)2
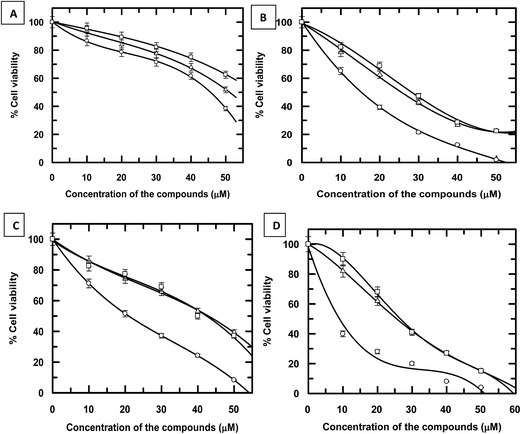
Findings of the experiments on enzyme assay suggest the complex could be less effective on cellular systems as the very cause of cytotoxicity i.e. amine formation is almost negligible for it. Besides, binding of the complex to DNA is comparable to HPIA.37 The performance of CoII(HPIA)2 as well as cis and trans forms of HPIA was investigated on three cancer cell lines (human colon carcinoma HCT116 cells, ALL MOLT-4 cells and MCF-7 breast cancer cells) that are distinctly different from each other. Activity of the complex was also checked on normal healthy HEK293T cells. The IC50 values for the complex were much less compared to cis and trans forms of HPIA in case of all three cancer cell lines.IC50 values for the three carcinoma cells were significantly lower than the chosen normal cell line. In case of normal healthy (HEK293T) cells, although the IC50 value for the complex was slightly lower than either cis or trans forms of HPIA, in case of cancer cells the difference was much greater (Fig. 7). Amongst the three cancer cells, the complex was most effective on HCT116 cells followed by MOLT-4 cells and MCF-7 breast cancer cells (Fig. 7, Table 2). The study showed that the complex exerts considerable activity on carcinoma cells particularly at low micromolar dose having S I values ranging from ∼1.898 in case of MCF-7 breast cancer cells to ∼2.873 for human colon carcinoma HCT116 cells. The difference in activity on carcinoma cells obviously requires further analysis but these preliminary results could be due to differences in compound uptake by cells and/or different mechanisms of action by the complex on the highly multiplicative cellular stages involved in cancer cells.
| Cell lines used | cis HPIA | trans HPIA | CoII(HPIA)2 | Cisplatin |
|---|---|---|---|---|
| HEK293T | 69.22 ± 5.80 | 53.98 ± 1.42 | 44.82 ± 1.45 | 2.6–8.3 (ref. 50 and 51) |
| HCT116 | 30.05 ± 3.64 | 29.94 ± 4.49 | 15.6 ± 2.08 | 5.4–7.4 (ref. 52 and 53) |
| MOLT-4 | 29.78 ± 1.10 | 24.92 ± 3.65 | 18.63 ± 1.08 | 0.3–1.3 (ref. 54 and 55) |
| MCF-7 | 37.66 ± 3.61 | 38.63 ± 4.01 | 23.61 ± 1.16 | 15.0–20.0 (ref. 56 and 57) |
Both compounds bind in an intercalative manner to DNA. However, their mechanism of action could not be fully elucidated and is being proposed based on an earlier finding of the CuII complex of the same compound (HPIA) suggesting that this complex might also possess multiple modes of action that could involve their ability to bind to DNA along with inhibition of one or more enzymes present within these cells like tyrosyl-DNA phosphodiesterase, topoisomerase, protein kinase A and polymerases that could be operating simultaneously. In another study, we found the CuII complex of HPIA inhibits topoisomerase I much more efficiently than either cis or trans HPIA (Fig. 6S†).
Since the complex contains two azo ligands bound to CoII, if we consider the observed activity of the complex with regard to the concentration of the ligand (HPIA), then IC50 due to the complex on the normal cell line (HEK293T) becomes greater than either cis or trans HPIA indicating the complex is actually far less damaging than HPIA.28 This is therefore as expected from our observations on enzyme assay and DNA binding experiments where in the complex has almost no reductive cleavage of the azo bond (i.e. no amine formation) which is essential for cytotoxicity. Hence, this ability to modulate azo-toxicity through complex formation using CoII has a huge significance in case of normal cells and may be seen as an important attribute of complex formation. Recalculating IC50 obtained for the complex with respect to HPIA for human colon carcinoma HCT116 cells, it is seen that the value is almost comparable to HPIA (cis & trans) clearly suggesting the high efficacy of the complex on this cell line. For MOLT-4 cells and MCF-7 breast cancer cells however, IC50 values for the complex recalculated with respect to HPIA are slightly greater than IC50 of either cis and trans HPIA for the two carcinoma cell lines (Fig. 7 & Table 2).
This is therefore very interesting and clearly suggests that through complex formation it is possible that the modified form of HPIA (complex) acquires an attribute to target cancer cells better than normal cells i.e. some sort of selectivity is achieved. This is not an erratic behavior as it was found on three distinctly different cancer cell lines although the extent of damage caused by the complex is different. This is expected since the origin, constitution, stability and character of the three cancer cell lines are completely different. What is also interesting is that the two forms of HPIA (cis and trans) have an almost similar behavior on all three cancer cell lines indicating that isomeric forms of HPIA do not show any preferential recognition or difference in activity. The data obtained for CoII(HPIA)2 was also compared with the performance of cisplatin on these same cell lines.50–57 As shown in Table 2, cisplatin appears to be relatively more cytotoxic than CoII(HPIA)2. Cisplatin interacts with DNA forming adducts, primarily intra-strand cross link adducts thereby activating several intracellular signaling pathways leading to cell death. Our results suggest since CoII(HPIA)2 and HPIA have similar binding parameters with DNA the difference in anti-cancer activity between HPIA and the complex has no correlation with their DNA binding property. Together, our results and published works with the four cell lines indicate that CoII(HPIA)2 has a different mode of action than cisplatin and that the complex is relatively less toxic than cisplatin.
The reason for the elevated sensitivity of the complex towards cancer cells over that of HPIA could be its ability to enter the cells better because of the presence of the metal ion i.e. there is an enhanced cellular uptake.30,34–36 Moreover, if cancer cells have an affinity for the metal ion they would allow more complex to enter the cells eventually leading to cell death.30–36,43,58–60 A direct consequence of an efficient cellular uptake of the complex by cancer cells is that the effective concentration of the complex within these cells would be much higher than either cis or trans HPIA. Normal cells not having this extra affinity for metal ions, cellular uptake should proceed at a normal rate implying a much lower effective concentration of the complex within the cells. This could be responsible for the difference in the performance of the complex in the two cell types (carcinoma and normal). A good number of metal complexes have shown the phenomenon discussed above.30,43,58,61 Like CuII, CoII an essential metal ion could be required for angiogenesis as well.30 Although nothing specific is known so far for CoII on cancer cells, this report is the second example from our laboratory where a complex of CoII with an azo ligand was found to be less toxic on normal cells than on cancer cells.28
4. Conclusion
Enzyme assay experiments on the reductive cleavage of the azo bond of a CoII complex of HPIA [CoII(HPIA)2] showed that reduction to primary amines was almost negligible in comparison to HPIA. DNA binding of HPIA and CoII(HPIA)2 was similar. These findings suggest the complex is likely to be less cytotoxic than HPIA. Experiments performed on a normal (HEK293T) cell line with CoII(HPIA)2 and the two isomeric forms of HPIA (cis and trans) actually support this. However, when the compounds were tried on three distinctly different carcinoma cell lines interestingly the complex showed a selectivity in its ability to kill human colon carcinoma HCT116 cells, ALL MOLT-4 cells and MCF-7 breast cancer cells over the two isomeric forms of HPIA. The enhanced activity of the complex was attributed to the high proliferation rate of cancer cells over normal cells and to efficient cellular uptake of the complex by cancer cells. When compared with cisplatin, in case of MCF-7 breast cancer cells the activity was comparable, otherwise cisplatin was better than CoII(HPIA)2. However, what is important is that compounds like cisplatin being in use for a long time now there is a considerable amount of drug resistance that has developed for these cells. The azo moiety not having been tried in cancer therapy such complexes could be important with regard to the aspect of resistance from cell lines. Another point worth mentioning in favour of CoII(HPIA)2 is that it is far less toxic on normal cells compared to cisplatin which is certainly an advantage.Abbreviations used
| HPIA | [2-(2-Hydroxyphenylazo)-1H-indol-3-yl]-acetic acid |
| CoII(HPIA)2 | Complex of Co(II) with HPIA |
| DMSO | Dimethyl sulphoxide |
| CD | Circular dichroism |
| Eqn | Equation |
| c t DNA | Calf thymus DNA |
Acknowledgements
This work was funded by the University Grants Commission, New Delhi in the form of a Major Research Project 39-749/2010(SR) to SD. Funding from the UGC is gratefully acknowledged. DG wish to thank UGC, New Delhi for a Project Fellowship. CKJ was supported by a Senior Research Fellowship from UGC, New Delhi which he acknowledges. RCS wishes to thank UGC, New Delhi for a Senior Research Fellowship. SD extends his gratitude to Prof. Samita Basu, Head, CSD, SINP for allowing DG to carry out fluorescence experiments in CSD, SINP. Authors wish to thank Dr Tuhinadri Sen of the Department of Pharmaceutical Technology, Jadavpur University for kindly providing bacterial cell extracts that were used in the enzyme assay experiments and Dr Shouvik Chattopadhyay for kindly providing the IR data for the complex.References
- G. A. Ibanez, A. C. Olivieri and G. M. Escandar, J. Chem. Soc., Faraday Trans., 1997, 93, 545–551 RSC.
- G. A. Ibanez and G. M. Escandar, Polyhedron, 1998, 17, 4433–4441 CrossRef CAS.
- T. H. Kim, S. H. Kim, V. le Tan, Y. J. Seo, S. Y. Park, H. Kim and J. S. Kim, Talanta, 2007, 71, 1294–1297 CrossRef CAS PubMed.
- J. Koh and A. J. Greaves, Dyes Pigm., 2001, 50, 117–126 CrossRef CAS.
- H. E. Katz, K. D. Singer, J. E. Sohn, C. W. Dirk, L. A. King and H. M. Gordon, J. Am. Chem. Soc., 1987, 109, 6561–6563 CrossRef CAS.
- T. Abe, S. Mano, Y. Yamada and A. J. Tomotake, J. Imaging Sci. Technol., 1999, 43, 339–344 CAS.
- P. Gregory, D. R. Waring and G. Hallos, The chemistry and application of dyes, Plenum Press, London, 1990 Search PubMed.
- S. Wu, W. Qian, Z. Xia, Y. Zou, S. Wang and S. Shen, Chem. Phys. Lett., 2000, 330, 535–540 CrossRef CAS.
- S. Wang, S. Shen and S. H. Xu, Dyes Pigm., 2000, 44, 195–198 CrossRef CAS.
- Y. Y. Geng, D. H. Gu and F. X. Gan, Mater. Sci. Eng., B, 2004, 110, 115–118 CrossRef.
- G. Hallas and J. H. Choi, Dyes Pigm., 1999, 40, 119–129 CrossRef CAS.
- O. J. X. Morel and R. M. Christie, Chem. Rev., 2011, 111, 2537–2561 CrossRef CAS PubMed.
- A. I. Vogel, A Text Book of Quantitative Inorganic Analysis including Elementary Instrumental Analysis, ELBS/Longman, Great Britain, 3rd edn, 1962 Search PubMed.
- K. A. Amin, H. A. Hameid and A. H. A. Elsttar, Food Chem. Toxicol., 2010, 48, 2994–2999 CrossRef CAS PubMed.
- E. Engel, H. Ulrich, R. Vasold, B. König, M. Landthaler, R. Süttinger and W. Bäumler, Dermatology, 2008, 216, 76–80 CrossRef PubMed.
- K. Lehner, F. Santarelli, R. Penning, R. Vasold, E. Engel, T. Maisch, K. Gastl, B. König, M. Landthaler and W. J. Baumler, J. Eur. Acad. Dermatol. Venereol., 2011, 25, 1340–1345 CrossRef CAS PubMed.
- G. de Aragão Umbuzeiro, H. S. Freeman, S. H. Warren, D. P. de Oliveira, Y. Terao, T. Watanabe and L. D. Claxton, Chemosphere, 2005, 60, 55–64 CrossRef PubMed.
- R. O. Alves de Lima, A. P. Bazo, D. M. Salvadori, C. M. Rech, D. de Palma Oliveira and G. de Aragao Umbuzeiro, Mutat. Res., 2007, 626, 53–60 CAS.
- S. Khan and A. Malik, in Environmental and health effects of textile industry waste water in environmental deterioration and human health, natural and anthropogenic determinants, ed. A. Malik, E. Grohmann and R. Akhtar, Springer Science, Dordrecht, 2014, ch. 4, pp. 54–68 Search PubMed.
- J. W. Daniel, Toxicol. Appl. Pharmacol., 1962, 4, 572–594 CrossRef CAS PubMed.
- M. A. Brown and S. C. de Vito, Crit. Rev. Environ. Sci. Technol., 1993, 23, 249–324 CrossRef CAS.
- C. P. Hartman, G. E. Fulk and A. W. Andrews, Mutat. Res., Genet. Toxicol., 1978, 58, 125–132 CrossRef CAS.
- F. Rafii and C. E. Cerniglia, Environ. Health Perspect., 1995, 103, 17–19 CrossRef CAS PubMed.
- H. Chen, Curr. Protein Pept. Sci., 2006, 7, 101–111 CrossRef CAS PubMed.
- P. H. Hernandez, J. R. Gillette and P. Mazel, Biochem. Pharmacol., 1997, 16, 1859–1875 CrossRef.
- G. C. Mueller and J. A. Miller, J. Biol. Chem., 1950, 185, 145–154 CAS.
- M. T. Huang, G. T. Miwa and A. Y. Lu, J. Biol. Chem., 1979, 254, 3930–3934 CAS.
- T. Deb, D. Choudhury, P. S. Guin, M. B. Saha, G. Chakrabarti and S. Das, Chem. Biol. Interface, 2011, 189, 206–214 CrossRef CAS PubMed.
- D. Ganguly, R. Sarkar, T. Deb, T. Sen and S. Das, Complex Met., 2014, 1, 13–22 CrossRef.
- T. Deb, P. K. Gopal, D. Ganguly, P. Das, M. Paul, M. B. Saha, S. Paul and S. Das, RSC Adv., 2014, 4, 18419–18430 RSC.
- M. Tuncel, H. Kahyaoglu and M. Cakir, Transition Met. Chem., 2008, 33, 605–613 CrossRef CAS.
- A. S. El-Tabl, F. A. Aly, M. M. E. Shakdofa and A. M. E. Shakdofa, J. Coord. Chem., 2010, 63, 700–712 CrossRef CAS.
- R. A. Ahmadi and S. Amani, Molecules, 2012, 17, 6434–6448 CrossRef CAS PubMed.
- M. Frezza, S. Hindo, D. Chen, A. Davenport, S. Schmitt, D. Tomco and Q. P. Dou, Curr. Pharm. Des., 2010, 16, 1813–1825 CrossRef CAS PubMed.
- S. Gómez-Ruiz, D. Maksimović-Ivanić, S. Mijatović and G. N. Kaluđerović, Bioinorg. Chem. Appl., 2012, 2012, 140284, DOI:10.1155/2012/140284.
- R. W.-Y. Sun, D.-L. Ma, E. L.-M. Wong and C.-M. Che, Dalton Trans., 2007, 4884–4892 Search PubMed.
- D. Ganguly, R. C. Santra, T. Mondal and S. Das, ChemistrySelect, 2016, 1, 970–978 CrossRef CAS.
- R. C. Santra, D. Ganguly, J. Singh, K. Mukhopadhyay and S. Das, Dalton Trans., 2015, 44, 1992–2000 RSC.
- P. S. Guin, S. Das and P. C. Mandal, J. Inorg. Biochem., 2009, 103, 1702–1710 CrossRef CAS PubMed.
- P. S. Guin, S. Das, P. C. Mandal and J. Phys, Org. Chem., 2010, 23, 477–482 CrossRef CAS.
- P. Das, P. S. Guin, P. C. Mandal, M. Paul, S. Paul and S. Das, J. Phys. Org. Chem., 2011, 24, 774–785 CAS.
- S. Mukherjee, P. Das and S. Das, J. Phys. Org. Chem., 2012, 25, 385–393 CrossRef CAS.
- P. Das, C. K. Jain, S. K. Dey, R. Saha, A. D. Chowdhury, S. Roychoudhury, S. Kumar, H. K. Majumder and S. Das, RSC Adv., 2014, 3, 59344–59357 RSC.
- G. Scatchard, Ann. N. Y. Acad. Sci., 1949, 51, 660–672 CrossRef CAS.
- F. Frezard and A. Garnier-Suillerot, Biochim. Biophys. Acta, 1990, 1036, 121–127 CrossRef CAS.
- K. Nakamoto, Infrared and Raman Spectra of Inorganic and Coordination Compounds, Wiley-Interscience, NewYork, 3rd edn, 1978 Search PubMed.
- R. T. Conley, Infrared Spectroscopy, Allyn & Bacon, Boston, MA, 1966 Search PubMed.
- P. S. Guin, P. Das, S. Das and P. C. Mandal, Int. J. Electrochem., 2012, 2012, 183745, DOI:10.1155/2012/183745.
- C. H. Huang, S. Mong and S. T. Crooke, Biochemistry, 1980, 19, 5537–5542 CrossRef CAS PubMed.
- E. Pani, L. Stojic, M. El-Shemerly, J. Jiricny and S. Ferrari, Cell Cycle, 2007, 6, 1796–1802 CrossRef CAS PubMed.
- S. V. Valcheva-Kuzmanova, A. B. Beronova and G. Tz. Momekov, Folia Medica, 2013, 55, 76–79 CrossRef CAS PubMed.
- J. Boyer, E. G. McLean, S. Aroori, P. Wilson, A. McCulla, P. D. Carey, D. B. Longley and P. G. Johnston, Clin. Cancer Res., 2004, 10, 2158–2167 CrossRef CAS PubMed.
- D. H. Shin, Y.-J. Choi and J.-W. Park, Cancer Res., 2011, 74, 298–308 CrossRef PubMed.
- M. Dabholkar, R. Parker and E. Reed, Mutat. Res., DNA Repair, 1992, 274, 45–56 CrossRef CAS.
- M. Antunovic, B. Kriznik, E. Ulukaya, V. T. Yilmaz, K. C. Mihalic, J. Madunic and I. Marijanovic, Anti-Cancer Drugs, 2015, 26, 180–186 CrossRef CAS PubMed.
- S. Tardito, C. Isella, E. Medico, L. Marchio, E. Bevilacqua, M. Hatzoglou, O. Bussolati and R. Franchi-Gazzola, J. Biol. Chem., 2009, 284, 24306–24319 CrossRef CAS PubMed.
- L. Forrest, M. Cohen and S. Cai, Intralymphatic chemotherapy drug carriers, PCT/US2009/032713, WO 2009097570 A2, Aug. 6 2009.
- R. H. Steele, J. Sabik, R. R. Benerito and S. W. O'Dea, Arch. Biochem. Biophys., 1988, 267, 125–142 CrossRef CAS PubMed.
- S. Tardito and L. Marchiò, Curr. Med. Chem., 2009, 16, 1325–1348 CrossRef CAS PubMed.
- L. Finney, S. Mandava, L. Ursos, W. Zhang, D. Rodi, S. Vogt, D. Legnini, J. Maser, F. Ikpatt, O. I. Olopade and D. Glesne, Proc. Natl. Acad. Sci. U. S. A., 2007, 104, 2247–2252 CrossRef CAS PubMed.
- S. A. Lowndes and A. L. Harris, J. Mammary Gland Biol. Neoplasia, 2005, 10, 299–310 CrossRef PubMed.
Footnote |
| † Electronic supplementary information (ESI) available. See DOI: 10.1039/c6ra23163b |
| This journal is © The Royal Society of Chemistry 2016 |

