Online monitoring and analysis for autonomous continuous flow self-optimizing reactor systems
D. C.
Fabry
,
E.
Sugiono
and
M.
Rueping
*
Institute of Organic Chemistry, RWTH Aachen, Landoltweg 1, 52074 Aachen, Germany. E-mail: magnus.rueping@rwth-aachen.de
First published on 11th November 2015
Abstract
In this review the recent progress in the field of self-optimizing reactor systems for continuous flow chemistry is presented. Particular focus is directed to the implementation of monitoring tools and realization of computer-controlled reaction optimizations without human interaction.
Introduction
Over the past centuries chemists have developed a wide range of offline analytical tools in order to characterize reaction intermediates or products. From characterization of colour, crystal form, odour, or even taste, to melting points, elemental, spectroscopic and spectrometric analyses, as well as X-ray structure characterization, a wealth of tools are now available. Off-line analytical measurements are predominantly used for detailed product characterization and elucidation of the structure.In contrast, in-line analytical tools are mostly used in batch or flow regimes to gain data regarding substrate usage, product formation, observation of intermediates or reaction parameters monitoring including temperature and pressure. Additionally, more complex kinetic parameters can be ascertained providing valuable insights into the reaction mechanism and its progress which may enable further reaction optimization.1
Over the past decades significant progress has been made in the field of process control. Today a variety of licensed or open-source software is available allowing users individual or parallel control of reactor components. Computer assistance for flow-chemistry can be of great benefit since reactor operations can be well-dosed and timed. Using standard hardware-connectivity, such as RS232, USB, or other readable/controllable ports, any hardware can theoretically be read and controlled.2
The next evolutionary step was the combination of both features resulting in software controlled analytical tools which can be implemented in computer controlled reactor systems, as recently summarized in an excellent overview.3
Thus, successively the optimization procedure of a chemical reaction in continuous flow can be given over to computer algorithms. After obtaining necessary information on the reaction proceedings, iterative or more sophisticated optimization protocols – well known in applied mathematics and informatics4 – can be run in order to find optimal parameters for a problem set.
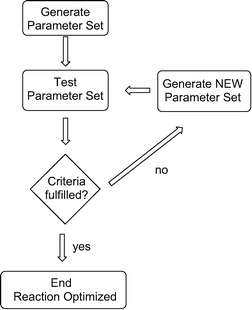
A general script for solving a problem is given in Scheme 1: initially, random parameters are chosen and tested, in our case for a chemical reaction. If a given criterion is fulfilled, e.g. full conversion of the starting material, the algorithm stops. If this criterion is not fulfilled, the algorithm creates new parameters based on certain mathematical strategies, and tests them again. This iterative process continues until the given criterion is fulfilled.
Self-optimizing reactor systems
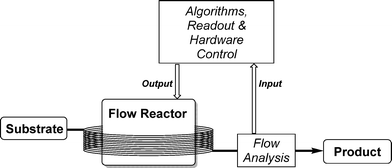
A general setup for self-optimizing reactor systems can be understood as a highly interactive combination of monitoring tools, flow reactors and a suitable optimizing algorithm. Such a general setup is displayed in Scheme 2.A substrate is pumped into a flow reactor and the reaction mixture is subsequently analyzed by a suitable online monitoring tool. The information gathered is fed to an algorithm appropriate for the reaction optimization. Software control mechanisms then give out commands to peripheries to test the next parameter sets.
In the following review different monitoring tools that were successfully used in the development of self-optimizing reactor systems will be presented.
HPLC as monitoring tool
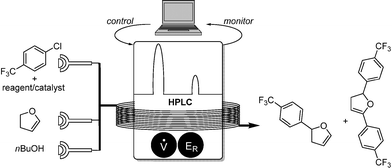
Jensen and coworkers demonstrated the power of online HPLC for monitoring a synthetically important Heck-type coupling reaction.5 By using a commercially available HPLC apparatus (Agilent 1200 SL RRLC), samples were taken from the reaction stream and the yield determined by comparison with an internal standard. Due to its sensitivity the HPLC could provide yield values with error margins of 3%. A Nelder–Mead simplex algorithm6 was implemented into the process control for the optimization procedure. Thereby, two variables were adjusted, namely the flow rate and amounts of reagent, forming triangular optimization geometry (Scheme 3).According to the illustrated optimization procedure, the optimum was identified when two yields differ by less than 3% (chosen based on a HPLC error margin of 3%).
FTIR-spectroscopy as monitoring tool
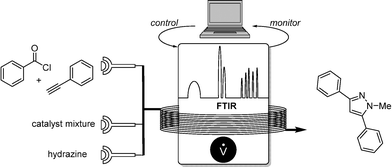
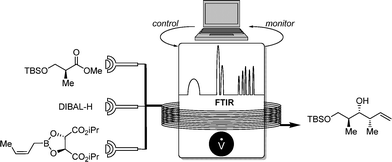
In 2011, Ley and co-workers presented a machine-assisted synthesis of pyrazoles.7 Although no algorithm-based optimization was used, the well-dosed injection of a hydrazine reagent was accurately controlled by a computer, depending on the reaction conversion monitored by IR. The overall conversion was again analyzed by a second flow-IR cell (Scheme 4).FTIR proved also to be a perfect tool for the precise substrate addition of an allylation reaction. Ley and co-workers developed a sequential addition of DIBAL-H for the reduction of a chiral carboxylic ester in which conversion was determined by flow FTIR.7 Depending on the conversion, equimolar addition of the crotyl boronate was guaranteed, providing the chiral alcohol in high yields (Scheme 5).
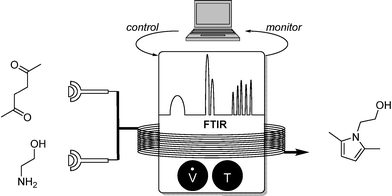
A fully self-optimizing reactor system using FTIR analysis was presented by Jensen and co-workers.8 For this purpose, a Paal–Knorr reaction was chosen for which flow rates of two reaction components, as well as the reaction temperature, were controlled by the automated system (Scheme 6). Calibration of substrate and product allowed the accurate determination of reaction yields via online FTIR. Corresponding IR signals for DMSO as a solvent were subtracted, and equilibration of reaction parameters prior to yield determination were guaranteed.
Regarding the use of algorithms, two different methods were combined for the final optimization set-up: a steepest descent and conjugate gradient algorithm determining the reactor temperature and residence time of the reaction mixture. Previously a large set of different algorithms were analyzed to identify the most suitable one for this parameter-set optimization.
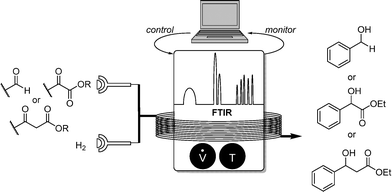
Our own contributions to this field were concerned with heterogeneously catalyzed hydrogenation reactions of pharmaceutically important carbonyl compounds (Scheme 7).9
For this substrate class, flow FTIR analysis was used also, due to its strong C![[double bond, length as m-dash]](https://www.rsc.org/images/entities/char_e001.gif) O stretch band in the area of 1700 cm−1 which can be easily monitored.
O stretch band in the area of 1700 cm−1 which can be easily monitored.
Using a H-Cube hydrogenation reactor, generating molecular hydrogen from water electrolysis, and commercially available Pd/C as heterogeneous catalyst, aromatic aldehydes, alpha- and beta-ketoesters could be efficiently reduced. A modified Nelder–Mead simplex algorithm was used for the optimization protocol in combination with Matlab hardware control.
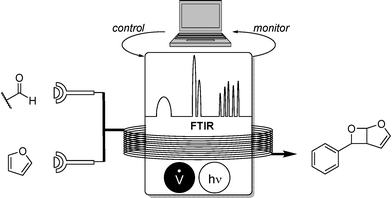
To further expand the applicability, as well as its synthetic use, pharmaceutically interesting oxetanes were synthesized from a Paterno–Büchi reaction in a self-optimising manner (Scheme 8).9 FTIR proved to be highly suitable for the monitoring of the carbonyl compound whose decrease was inversely proportional to reaction conversion.
Flow rates of the two stock solutions were parameterized while a UV-mercury lamp was used for irradiation at 254 nm. One beneficial effect of online monitoring proved to be the suppression of side-products deriving from strong UV-irradiation. High yields of a variety of fused oxetanes were obtained.
Fluorescence spectroscopy as monitoring tool
The precise synthesis of nanoparticles is still considered a challenge in synthetic chemistry.10 Size-distribution and purity are the key-challenges in this field. DeMello and co-workers presented a practicable solution to this problem by applying online fluorescence spectroscopy as a monitoring tool (Scheme 9).11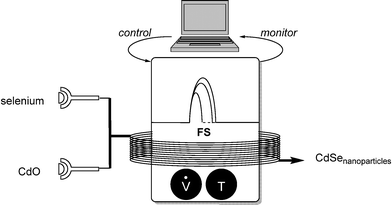 | ||
| Scheme 9 Controlled synthesis of CdSe nanoparticles using fluorescence spectroscopy (FS) as monitoring tool. | ||
The target was the uniform synthesis of cadmium selenide nanocrystals. The algorithm-controlled reaction of each component, flow-rate and temperature parameterized, led to optimal crystal growth conditions, giving information on band-edge emission and defect emission by fluorescence spectroscopy.
GLC as monitoring tool
A more complex reactor setup was realized by Poliakoff, Bourne and coworkers.12 Carbon dioxide has been suggested as an environmentally friendly solvent with unique properties under supercritical conditions (supercritical point: 304 K, 73 atm).13 Such a reactor using scCO2 was then envisioned in a self-optimising manner. This particular example is of special interest, since the dehydration of ethanol, chosen as model reaction, can form not only acetaldehyde as potential product target but also diethylether and ethylene. The implemented algorithm ultimately allowed the selective optimization of one desired product (Scheme 10).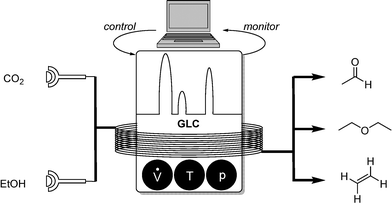 | ||
| Scheme 10 Self-optimizing reactor system for ethanol dehydration in a scCO2 reactor; monitoring with GLC. | ||
Due to the components' high volatilities gas–liquid chromatography (GLC) was used as the monitoring tool of choice. Ethanol and CO2 were injected into the reactor while the control segment dealt with the adjustment of flow rates, reaction temperature, and pressure. Online GLC samples revealed information about the reaction conversion, as well as its selectivity. Optimization algorithms plotted characteristic regions for high selectivities and conversions so that the user can choose which product is preferred. In this setup, a Nelder–Mead simplex algorithm was also used for this 3-parameter optimization.
As an extension to this self-optimizing reactor setup, dimethyl carbonate and 1-propanol were additionally introduced as reagents, allowing selective formation of methylpentyl carbonate or methylpentyl ether (Scheme 11). In the latter case, four parameters were screened. In addition to the flowrates, temperature and pressure the concentration of the reagents was also taken into account.
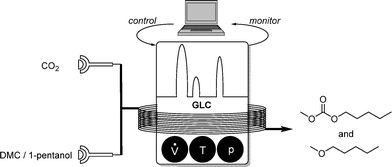 | ||
| Scheme 11 Self-optimizing reactor system for etherification and carbonate formation in scCO2 monitored by GLC analysis. | ||
NMR spectroscopy as the monitoring tool
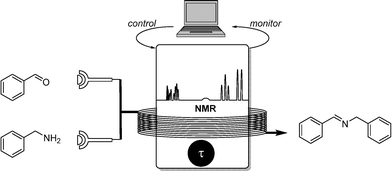
The last, and most recent example, is NMR spectroscopy as appropriate monitoring tool for self-optimizing reactor systems. This technique was previously reported as the sole monitoring tool for imine formation by Marquez and coworkers in 2014.14 However, the large size of the NMR spectrometer restricted its use as a flow analysis tool until recently. This disadvantage was eliminated in a recent publication by Cronin and coworkers who made use of a bench-size Flow-NMR.15 This handy device allowed the recording of 1H (1D, COSY), 13C (DEPT, HSQC), 19F (1D, COSY) spectra in real-time (Scheme 12).This analytic technique was used in the self-optimizing reactor setup for the imine formation of aromatic aldehydes and benzylic amines. The characteristic 1H and 19F signals for fluorinated compounds were monitored, their conversion fed to the algorithm and the reaction subsequently optimized.
Conclusions
The examples presented show that in recent years researchers have developed fully integrated optimization systems for flow chemistry comprising components that were previously thought to be stand alone tools. Due to the inter-connectivity human interaction becomes less important leading to time and cost savings. Although the construction of a self-optimizing reactor system that integrates a flow reactor, monitoring tools and software is not an easy task and needs skill and preparation time, these obstacles clearly outweigh the advantages and benefits that can be achieved. Since the age of fully integrated reactor systems seems to have just begun more examples and sophisticated setups will be developed in the future.Notes and references
- A. de la Hoz and A. Loupy, Microwaves in Organic Synthesis, 2 Volume Set, Wiley-VCH, 2013 RSC; J. Wegner, S. Ceylan and A. Kirschning, Chem. Commun., 2011, 47, 4583–4592 RSC; J. Wang, Acc. Chem. Res., 2002, 35, 811–816 CrossRef CAS PubMed; R. Puchades, A. Maqui-eira, J. Atienza and M. A. Herrero, J. Autom. Chem., 1990, 12, 163–173 CrossRef PubMed.
- R. A. Skilton, R. A. Bourne, Z. Amara, R. Horvath, J. Jin, M. J. Scully, E. Streng, S. L. Y. Tang, P. A. Summers, J. Wang, E. Pérez, N. Asfaw, G. L. P. Aydos, J. Dupont, G. Comak, M. W. George and M. Poliakoff, Nat. Chem., 2015, 7, 1–5 CrossRef CAS PubMed; S. V. Ley, R. J. Ingham, M. O'Brien and D. L. Browne, Beilstein J. Org. Chem., 2013, 9, 1051–1072 CrossRef PubMed; J. C. Pastre, D. L. Browne and S. V. Ley, Chem. Soc. Rev., 2013, 42, 8849–8869 RSC; V. Hessel, D. Kralisch, N. Kockmann, T. Noël and Q. Wang, ChemSusChem, 2013, 6, 746–789 CrossRef PubMed; T. Illg, P. Löb and V. Hessel, Bioorg. Med. Chem., 2010, 18, 3707–3719 CrossRef PubMed; D. N. Jumbam, R. A. Skilton, A. J. Parrott, R. A. Bourne and M. Poliakoff, J. Flow Chem., 2012, 2, 24–27 CrossRef; J. P. McMullen and K. F. Jensen, Annu. Rev. Anal. Chem., 2010, 3, 19–42 CrossRef PubMed; N. Kockmann, M. Gottsponer, B. Zimmermann and D. M. Roberge, Chem. – Eur. J., 2008, 14, 7470–7477 CrossRef PubMed; J. A. Schwartz, J. V. Vykoukal and P. R. C. Gascoyne, Lab Chip, 2004, 4, 11–17 RSC; F. R. P. Rocha, J. A. Nóbrega and O. F. Filho, Green Chem., 2001, 3, 216–220 RSC; S. J. Haswell, R. J. Middleton, B. O'Sullivan, V. Skelton, P. Watts and P. Styring, Chem. Commun., 2001, 391–398 RSC; H. Du, R. C. A. Fuh, J. Li, L. A. Corkan and J. S. Lindsey, Photochem. Photobiol., 1998, 68, 141–142 Search PubMed.
- S. V. Ley, D. E. Fitzpatrick, R. J. Ingham and R. M. Myers, Angew. Chem., Int. Ed., 2015, 54, 3449–3464 CrossRef CAS PubMed.
- R. M. Betz and R. C. Walker, J. Comput. Chem., 2015, 36, 79–87 CrossRef CAS PubMed; C. A. Floudas and C. E. Gounaris, J. Glob. Optim., 2009, 45, 3–38 CrossRef; G. I. Schuëller and H. A. Jensen, Comput. Methods Appl. Mech. Eng., 2008, 198, 2–13 CrossRef; M. C. Fu, F. W. Glover and J. April, Proceedings of the 2005 Winter Simulation Conference, 2005 CrossRef PubMed; D. J. Wales and H. A. Scheraga, Science, 1999, 285, 1368–1372 CrossRef PubMed; C. D. Maranas and C. A. Floudas, Comput. Chem. Eng., 1997, 21, 351–369 CrossRef.
- J. P. McMullen, M. T. Stone, S. L. Buchwald and K. F. Jensen, Angew. Chem., Int. Ed., 2010, 49, 7076–7080 CrossRef CAS PubMed.
- J. A. Nelder and R. Mead, Comput. J., 1965, 7, 308–313 CrossRef.
- H. Lange, C. F. Carter, M. D. Hopkin, A. Burke, J. G. Goode, I. R. Baxendale and S. V. Ley, Chem. Sci., 2011, 2, 765–769 RSC.
- J. S. Moore and K. F. Jensen, Org. Process Res. Dev., 2012, 16, 1409–1415 CrossRef CAS.
- See also: D. C. Fabry, E. Sugiono and M. Rueping, Isr. J. Chem., 2014, 54, 341–350 CrossRef CAS.
- H. Duan, D. Wang and Y. Li, Chem. Soc. Rev., 2015, 44, 5778–5792 RSC; R. G. Chaudhuri and S. Paria, Chem. Rev., 2011, 112, 2373–2433 CrossRef CAS PubMed; N. A. Frey, S. Peng, K. Cheng and S. Sun, Chem. Soc. Rev., 2009, 38, 2532–2542 RSC; S. Sun, Adv. Mater., 2006, 18, 393–403 CrossRef.
- S. Krishnadasan, R. J. C. Brown, A. J. deMello and J. C. deMello, Lab Chip, 2007, 7, 1434–1441 RSC.
- A. J. Parrott, R. A. Bourne, G. R. Akien, D. J. Irvine and M. Poliakoff, Angew. Chem., Int. Ed., 2011, 50, 3788–3792 CrossRef CAS PubMed.
- P. T. Anastas, W. Leitner and P. G. Jessop, Handbook of Green Chemistry, Wiley-VCH, Weinheim, 2013, vol. 4 RSC; P. G. Jessop, Green Chem., 2011, 13, 1391–1398 RSC; S. P. Nalawade, F. Picchioni and L. P. B. M. Janssen, Prog. Polym. Sci., 2006, 31, 19–43 CrossRef CAS; W. Leitner, Nature, 2003, 423, 930–931 CrossRef PubMed; W. Leitner, Acc. Chem. Res., 2002, 35, 746–756 CrossRef PubMed; A. Bösmann, G. Franciò, E. Janssen, M. Solinas, W. Leitner and P. Wasserscheid, Angew. Chem., Int. Ed., 2001, 40, 2697–2699 CrossRef.
- D. A. Foley, E. Bez, A. Codina, K. L. Colson, M. Fey, R. Krull, D. Piroli, M. T. Zell and B. L. Marquez, Anal. Chem., 2014, 86, 12008–12013 CrossRef CAS PubMed.
- V. Sans, L. Porwol, V. Dragone and L. Cronin, Chem. Sci., 2015, 6, 1258–1264 RSC.
| This journal is © The Royal Society of Chemistry 2016 |

