Selectivity engineering of the diazotization reaction in a continuous flow reactor†
C. A.
Shukla
ab,
A. A.
Kulkarni
*ab and
V. V.
Ranade
*ab
aAcademy of Scientific and Innovative Research (AcSIR), CSIR-National Chemical Laboratory (NCL) Campus, Pune-411008, India. E-mail: aa.kulkarni@ncl.res.in; vv.ranade@ncl.res.in; Tel: 91 20 25902153 Tel: 91 20 25902170
bChem. Eng. Proc. Dev. Division, CSIR-National Chemical Laboratory, Dr. Homi Bhabha Road, Pashan, Pune-411008, India
First published on 29th April 2016
Abstract
In situ generated diazonium salts are useful intermediates for the synthesis of fine chemicals and active pharmaceutical ingredients. This paper presents a methodology for selectivity engineering of the diazotization reaction in a continuous reactor. The yield of diazotization was found to depend on mixing, dispersion, reaction kinetics, operating temperature and residence time. Initially, experimental data and an isothermal axial dispersion model were used for estimating mixing time. A correlation for estimating mixing time for different flow reactors is proposed. The model predictions were compared with the experimental data. The validated axial dispersion model and Central Composite Design (CCD) were used to optimize diazotization in a straight tube reactor (1.78 mL). The model was then used for scaling-up of aniline diazotization from a straight tube reactor to a proprietary AmAR3 reactor (scale-up ratio of ∼20). The initial concentration, inlet temperature, average heat capacity of the reaction mixture, mixing, residence time (distribution) and available heat transfer area per unit volume of the reactor were found to be the key parameters for scaling-up of the diazotization reaction. The presented approach and results will be useful to practicing chemists and engineers for enhancing the selectivity of diazotization reactions in continuous reactors.
Introduction
Diazotization is an important step in several reactions viz. Sandmeyer,1–4 Pschorr,3,5 Gomberg–Bachmann,3 Balz–Schiemann,1,3,6 Meerwein arylation,1–3,7–9 Kikukawa–Matsuda,3 Suzuki-coupling,10 Heck reaction,10,11 Stille cross-coupling10etc. Several of these products find applications in the fine chemicals and pharmaceutical industry. Many synthetically useful products of fine and pharmaceutical industries viz. prosulfuron,12 thiazolidinedione derivatives (pioglitazone),13O-anisamide,14 and Calpain I inhibitors15 involve the diazotization step as one of the important steps. Mo et al.3 have reviewed the application of diazonium salts in detail. In general, diazotization reactions are exothermic (ΔH ∼ −65 to −150 kJ mol−1) and are practically instantaneous even at −10 °C.16 The diazonium salts are highly unstable and shock sensitive.8,16 Most of the diazonium salts decompose above 5 °C with a heat of decomposition ranging from −160 kJ mol−1 to −180 kJ mol−1 which can cause a runaway reaction.16,17 One of the byproducts of the decomposition reaction is nitrogen which can also build pressure inside the reactor.17 Because of these issues and the necessity of having complete conversion of the respective anilines, it is important to identify the right configuration and operating conditions for the safe operation with maximum possible yield of the diazonium salt.18–20 In order to control the temperature inside the reactor, the rate of heat generation is conventionally controlled by carrying out the reaction in a semi-batch mode. However, in the semi-batch mode, the duration for which the product remains in contact with the unreacted reactant is much longer and the product can undergo subsequent reactions resulting in lower yields. It also suffers from some of the disadvantages viz. limited production rate due to the dead time between two batches.21 Recently, several investigators have studied the multistep continuous flow reactions involving diazonium salts.4,6,8,9,22–26 Oger et al.27 have critically reviewed the literature on flow chemistry of reactions involving diazonium salts. While the results from the literature are promising, it is necessary to explore and evaluate the sensitivity of important parameters which become more relevant while scaling-up.The synthesis of diazonium salts occurs in three stages: in the first step, aniline and hydrochloric acid react to give anilinium chloride salt, which is soluble in the water available in the reaction mass along with excess hydrochloric acid. This reaction usually goes to completion in the presence of excess hydrochloric acid. In the second step, the reaction of this solution containing anilinium chloride with the aqueous sodium nitrite solution generates nitrous acid. This reacts with the anilinium chloride salt to give benzene diazonium salt. NaCl gets generated along with nitrous acid and can remain undissolved depending on the water concentration and the operating temperature. In general, diazotization is carried out under highly acidic conditions and the literature reports it to be first order with respect to aniline substrate and second order with respect to nitrous acid, making it an overall third order reaction.28,29 This implies that for the synthesis of diazonium salt with complete conversion of aniline, the reactor with lesser dispersion should be preferred. Unreacted aniline can also react with the diazonium salt to form a waste dye product. Diazonium salt decomposes above 5 °C (Scheme 2) and the decomposition reaction is first order with respect to diazonium salt.30 Nitrogen gets generated in the decomposition reaction thereby changing the nature of flow in a reactor. In the present work, we aim at maximizing the yield of diazonium salt by minimizing the decomposition reaction. Various reactions involved in this chemistry are included in the ESI.† Here we will focus on the simplified representation of reactions for further consideration (Scheme 1).
In this work, we focus on the optimization and scale-up approach for the diazotization reaction. Important parameters influencing the yield of diazonium salt are identified and quantitative data is presented. A computational model is developed to quantitatively understand the influence of mixing, dispersion and residence time on the yield of diazonium salt. The model was first validated using the experimental data and was then used for optimization and scale-up. The presented approach, experimental data and model will help in highlighting thermal effects upon scale-up and in optimization. This manuscript will be useful for process chemists as it will help to develop awareness about the range of relevant parameters that show a quantitative effect of on the yield of diazonium salt as it would eventually affect the yields of subsequent multistep reactions. The manuscript is organized as follows: the mathematical model is discussed in the following section. Subsequently, the details on experimental set-up and the experimental procedure are presented. The results based on the model predictions as well as the design of the experiment's approach are discussed and used for identifying the optimum range of operating conditions and scale-up.
Mathematical model
A continuous tubular reactor is used in this work for carrying out diazotization reactions. Considering the apparent third order nature of the reaction and possibility of further reaction of diazonium salt to produce unwanted by-products, it is desirable to use an ideal plug flow reactor (with zero axial backmixing). However, there will always be some axial backmixing in real tubular reactors. The configuration of the tubular reactor and operating flow characteristics determine the effective axial backmixing. The influence of axial backmixing on the overall performance of the diazotization reactor is modelled in this work using a classical axial dispersion model. The extent of dispersion depends on flow regime and other flow characteristics. The extent of dispersion in a tubular reactor is characterized by the Peclet number (UL/D) where U is the superficial velocity, L is the length of the tube and D is the dispersion coefficient. For a constant tube diameter, the D is proportional to the square of the axial velocity and thus enhancing velocity or operating at smaller residence time will increase D.31The kinetic parameters and order of reaction were taken from the literature.29 The rate constant at 0 °C is 342 L2 mol−2 s−1 and the activation energy is 37.68 kJ mol−1. In the present system, the diazotization reaction takes place in the aqueous medium (mole% of water is ∼94). The large excess of water allows further simplification of Scheme 1 which can be written as: A + B → C, where A, B and C represent anilinium chloride, nitrous acid and diazonium salt, respectively. For further simplification, it was assumed that the nitrous acid concentration is nearly the same as the sodium nitrite concentration. In the situation where sodium nitrite is taken in large excess, one would also need to include nitrous acid decomposition kinetics. The decomposition of nitrous acid into nitrogen dioxide was not observed for most of the experiments, except for that with a reaction temperature close to 10 °C.
Eqn ((1)–(3)) and ((4)–(6)) represent the dimensionless mass and heat balance equation for the non-isothermal dispersion model. These equations can be reduced to an isothermal case by setting dT/dZ = d2T/dZ2 = 0 in the energy balance equation. Danckwerts' (closed–closed) boundary conditions were applied to solve the model.32 The Damkohler number (Da) can be used for determining the controlling time scale.33 The current model considers the controlling rate (kinetics and mixing) of the process to predict the yield. The volumetric ratios of the two feed streams are approximately equal to 1 and hence it was not considered in the mixing rate expression. The molar ratio of reactants (ϕ = 1.2) can also be neglected in the mixing rate expression as it is a first order rate expression. The approach here is to find the controlling step by fitting the mixing Damohler number (DaM). The reaction Damkohler number (DaR) is calculated based on the initial concentration, velocity, reactor length and kinetics available from the literature. For the isothermal case, the frequency factor (k0) will be replaced by the rate constant (k) in the definition of DaR. The Peclet number (PeM) is obtained from residence time distribution experiments (discussed in a subsequent section). DaM was fitted by comparing the predicted yield with the experimental yield. The fitted DaM was further used to calculate the mixing time (tm = τ/DaM). For ideal mixing, the reaction will be controlled by kinetics alone. This condition can be obtained in the model by setting tm ∼ 10−20 s (i.e. DaM ∼ 1020).
 | (1) |
 | (2) |
 | (3) |
 | (4) |
 | (5) |
 | (6) |
The heat transfer coefficient and the friction factor were estimated using the equations given in the ESI.†34 The model equations were solved using the backward integration method.35 The bvp4c solver in MATLAB was used for this purpose. The tolerance and grid points for isothermal simulations were 10−8 and 1500 respectively, whereas those for non-isothermal simulations were 10−6 and 500 respectively. It was ensured that the simulated results were grid independent for all the cases.
On a laboratory scale, it is easier to maintain isothermal conditions. Whereas in the case of the pilot or production scale, the reactor would have non-isothermal features and hence the non-isothermal model is more appropriate for studying thermal effects upon scale-up. In the present work, initially, we have used the isothermal model with mixing as a limiting process to estimate mixing time. An appropriate correlation was developed to estimate the effective mixing time for flow reactors. The results of the isothermal model were then compared successfully with the experimental data. Afterwards, the non-isothermal model was used to study thermal effects upon scale-up. For simulations, the concentration is as per the experiments unless mentioned otherwise.
Experimental
Experiments were designed and carried out for estimating the extent of axial dispersion (by measuring residence time distribution) and the yield of diazonium salt. The information is expected to help in obtaining quantitative data on the performance of the diazotization reactor and for scale-up. These are briefly discussed in the following.Residence time distribution (RTD)
Residence time distribution (RTD) experiments were performed to quantify dispersion and corresponding parameter (Peclet number, PeM) for the axial dispersion model. Four different reactor configurations comprising a straight tube, coiled tube, pinched tube and proprietary AmAR3 design were used in this work. More information on the experimental set-up and reactor dimensions are provided in the ESI.† A salt solution of 20 mg mL−1 concentration was used as a tracer for measuring RTD. The salt solution and pure water were filled in different syringe pumps (Longer Pump, China). This salt solution was used for the input step at the inlet of a reactor and the conductivity of the solution was monitored at the outlet of the reactor using a pre-calibrated conductivity meter to get the concentration vs. time data. Initially, experiments were performed for a residence time of 5–35 s for different reactors (straight tube, coiled tube, pinched tube and AmAR3 reactor). It was observed that the mean residence time estimated from the measured RTD curve was slightly higher than that calculated from the volume of reactor and flow rate. The errors were however small (∼3%). The experimentally obtained value of Peclet numbers for different reactor configurations and operating conditions are also reported in the ESI.† Similar experiments were carried out for a residence time of 45–230 s for the straight tube reactor. Every experiment was repeated three times to ensure the reproducibility.Diazotization reactions
The overall diazotization reaction is represented by Scheme S1.† Aniline (1 equiv.) was mixed with 11.64 M HCl solution (3.25 equiv.). This results in the formation of anilinium chloride salt. Aqueous solution of anilinium chloride with molar concentrations of HCl and anilinium chloride at 3.9 M and 1.2 M, respectively, were prepared. 1.5 M NaNO2 solution was prepared by mixing NaNO2 (1.2 equiv.) in water. Both the solutions were pumped using syringe pumps (Longer Pump, China). In order to quench the reaction and stabilize the diazonium salt, the reaction mixture at the outlet of the reactor was collected in several vials containing 2 to 10 ml of aqueous solution of β-naphthol (0.45 M) and NaOH (1.5 M). The collection was done over a period of 15–30 s to meet the stoichiometric requirement and give Sudan-I dye, which is insoluble in the solution. The samples were made homogeneous by adding ethanol and subjected to analysis using a UV-vis spectrophotometer (Cary 8454 Agilent Technologies). UV-vis analysis was done multiple times to ensure reproducibility. The standard deviation in the absorbance was less than 0.0004 which is acceptable. Moreover, NMR analysis was done to confirm the dye product (Sudan I). Details of the experimental set-up and the analysis protocol can be found in the ESI.† The reaction was carried out in different flow reactors (straight tube, coiled tube, pinched tube and AmAR3 reactor) and the temperature was maintained at a specified set-point using a constant temperature bath (Julabo, Germany). Every experiment was repeated three times to ensure the reproducibility.Generally, hydrochloric acid is employed in diazotization as it mostly gives water soluble aromatic salts.36 The hydrochloric acid should be in excess such that the final pH of the diazotization solution should be less than 2.37 Excess acid also helps to avoid partial diazotization and condensation of diazonium salt with unreacted aniline to form a waste dye product. In the current study, 3.25 moles of hydrochloric acid was used for 1 mole of aniline. We have employed 20% excess of sodium nitrite to ensure complete consumption of aniline.38 Experiments were carried out for different values of temperature and residence time.
Scale-up experiment
It is important to ensure that the maximum yield of the diazonium salts obtained on a laboratory scale is maintained on larger scales to achieve a successful scale-up.39 The most important parameters for achieving a scale-up include the temperature of the reaction mixture, mixing, residence time and the extent of dispersion. A few scale-up options of flow reactors include CSTRs in series, the Advanced Flow Reactor (AFR®) by Corning, the MIPROWA system by BTS-Ehrfeld, static mixers, helical coils, the Alfa Laval Plate reactor, etc. Recently, the 3D flow reactor40,41 (also known as AmAR3 reactor, Amar Equipments Pvt. Ltd., India) has been reported as an excellent design comprising a series of converging sections that behaves similarly to CSTRs in series with excellent local three dimensional mixing. The design of AmAR3 is such that it can be a good scale-up platform. In this work, we used a bench scale AmAR3 reactor with ∼35 mL of volume (scale-up ratio of nearly 20).Aniline–HCl solution and NaNO2 solutions were prepared in a similar manner to that mentioned earlier and dosing was carried out using piston pumps. The reactor jacket was connected to a thermostat and the temperature was set to 2 °C. The solution was quenched at the outlet and analyzed using the UV-vis spectrometer as mentioned earlier. Fig. 1 shows the setup for the scale-up experiments.
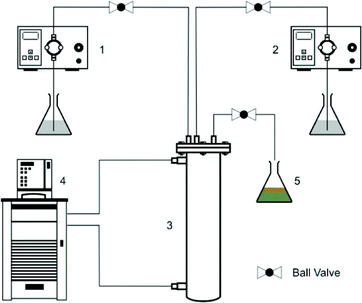 | ||
| Fig. 1 Scale-up in the AmAR3 reactor. (1) Pump for Aniline–HCl solution, (2) pump for NaNO2 solution, (3) AMaR3 reactor, (4) thermostat and (5) quenching and sample collection. | ||
Results and discussion
Laboratory experiments and model validation
The initial concentrations of aniline, NaNO2 and HCl in the reaction mixture were 0.62 M, 0.74 M and 2 M, respectively, and were maintained the same for all the experiments. Initially, experiments were carried out in a straight tube reactor (SS316 1.75 mm i.d. tube, 1.78 mL) for a residence time of 5–230 s at 1.46 °C, 5 °C and 10 °C. The experimental results in terms of yield of the diazotization reaction are shown in Fig. 2. The standard deviation in the measured yields of diazonium salt for the experiments varied over a range of 1.7% to 12.76%. In order to quantify mixing (which is the controlling step), the isothermal axial dispersion model was used and the mixing Damkohler number (DaM) was fitted to match the experimental yield of diazonium salt for 1.46 °C and 5 °C experiments. With the known PeM from the RTD experiments and known reaction kinetics, the mixing time can be calculated from the fitted value of DaM. Details about fitted parameters and different time scales are given in the ESI.†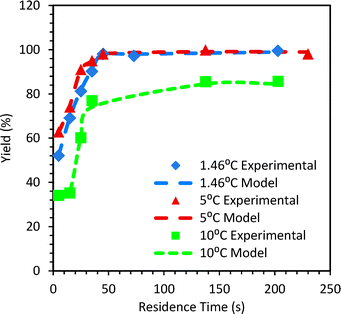 | ||
| Fig. 2 Comparison of predicted (lines) and experimental (symbols) yields of diazonium salt in a straight tube reactor. | ||
The mixing time estimated using these fitted values of (DaM) was correlated with d/u as tm = α [d/u]. The value of α was found to be 91 at τ > 35 s. At τ < 35 s, α is a strong function of τ. This observation is important as it would need the mixing time and the associated dispersion effects to be considered together for designing the reactor. Fig. 2 shows the experimental and predicted yields of diazonium salt. For T > 5 °C, the lumped decomposition Damkohler number (DaD) for the decomposition reactions was fitted. For 10 °C the values of fitted DaD were in the range of 0.8 to 2.2.
In order to verify the suitability of the model for the estimation of the yield of diazonium salt, the yield was observed as a function of temperature for various residence times in a straight tube reactor.
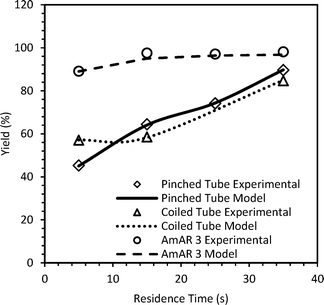
The observations are shown in Fig. S13 in the ESI.† Since the experimental yield is always lower than the yield if the reaction was kinetically controlled, it implies that the diazotization reaction is always controlled by mixing in the straight tube reactor. Similar experiments were performed at 5 °C at τ over 5 s to 35 s in the pinched tube (1.78 mL), coiled tube (1.78 mL) and smaller AmAR3 reactor (4 mL). The mixing time was estimated by a similar approach. Details of the fitted parameters and relevant time scales are given in the ESI.† For a higher residence time (τ ≥ 35 s) in the coiled reactor, the value of α is similar to that of the straight tube and hence straight tube correlation is a good approximation for predicting mixing time. Fig. 3 shows the comparison of the experimental yield and the predicted yield of the diazonium salts in different flow reactors at 5 °C. The lower yield in the pinched tube and coiled tube (at τ < 35 s) was because of incomplete mixing. The fitted DaM values for the pinched tube and coiled tube were in the range of 0.67–1.55 and 0.88–0.92 at τ < 35 s. This indicates that the residence time is not sufficient to get complete mixing. At τ = 35 s, the DaM values were 3 and 2.2 for the pinched tube and coiled tube, respectively, indicating that the residence time is at least twice the mixing time which resulted in a relatively higher yield compared to the yield obtained at τ < 35 s. However, due to high dispersion in the pinched tube (PeM = 3.8–8.6) and coiled tube (PeM = 10.6–20.2), the yield was relatively lower compared to that of the straight tube (PeM = 26.5–63.7) at 5 °C and 5 s ≤ τ ≤ 35 s (Fig. 2 and 3). The pinched tube will have a relatively higher velocity at the pinched cross-section leading to higher dispersion. The higher yield obtained in AmAR3 reactor suggested that the reaction is kinetically controlled in AmAR3 reactors. The fitted DaM values for AmAR3 at 15 s ≤ τ ≤ 35 s were in the range of 60–90 (lowest fitted value) which indicates that the residence time is at least 60–90 times more than the mixing time. However, the mixing time in the AmAR3 reactor can be much lower and the above results will only give the upper limit of the mixing time.
Fig. 4(A) shows the mixing Damkohler number (DaM = τ/tm) vs. traditional mixing Damkohler number (DaM' = tm/tR) for different flow reactors for a residence time range of 5–35 s and temperature of 5 °C. DaM' can be obtained by dividing the reaction Damkohler number (DaR) by the fitted mixing Damkohler number (DaM). Traditional mixing Damkohler number should not be confused with the mixing Damkohler number defined in the current work which is the ratio of residence time and mixing time.42 When DaM' > 1000, the reaction rate is much faster than mixing rate and hence mixing will be the controlling step. The majority of the experimental data falls in this region. When 0.001 < DaM' < 1000, the reaction and mixing are competitive and the overall rate will depend on the minimum of the mixing rate and reaction rate. Fig. 4(A) shows that the DaM for the AmAR3 reactor is orders of magnitude higher compared to the majority of other data points. This indicates that mixing is faster in the case of the AmAR3 reactor compared to other reactors for the given operating conditions. The maximum DaM' for AmAR3 is in the range of 3.8–31, indicating that the mixing and reaction are competitive. However, the actual DaM' can be much lower (∼0.001), indicating that the reaction is kinetically controlled. This was also confirmed by comparing the predicted yield (of the kinetically controlled region obtained by doing simulations for DaM = 1020 and corresponding DaR and PeM) and experimental yield. The error was less than 4.1% when comparing the yield obtained by kinetically controlled simulation and the experimental yield. For other reactors (straight tube, pinched tube and coiled tube), the DaM' ratio is in the range of 516–1701, indicating that the reaction is orders of magnitude faster than mixing for the given operating conditions and thus it is controlled by mixing. Moreover, DaM is less than 1 for some experiments (in the case of straight tube, pinched tube and coiled tube) which indicates that the residence time is less than the mixing time resulting in lower yield. Fig. 4(B) shows the yield vs. DaM which clearly indicates that a higher DaM will result in a higher yield. DaM should be at least 2.5 in order to get above 90% yield. In other words, the residence time should at least be 2.5 times the mixing time in order to get higher yield.
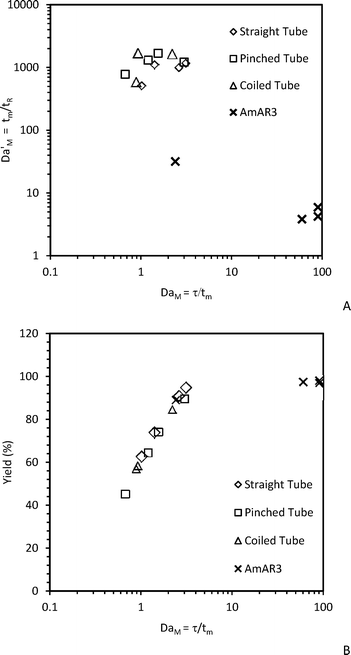 | ||
| Fig. 4 (A) DaM' = (tm/tR) vs. DaM = (τ/tm), (B) Yield of diazonium salt vs. DaM = (τ/tm) for different flow reactors at 5 s ≤ τ ≤ 35 s and 5 °C. | ||
Optimization of the diazotization reaction
Diazonium salts are coupled with different substrates in a multistep synthesis. Respective anilines being active, they too can undergo subsequent reactions (Scheme S6 in ESI†) if not converted to the diazonium salt completely. Thus, the higher the yield of the diazotization step the higher the yield of the subsequent reaction step will be. The yield of diazonium salts can therefore be set as the maximization variable. Moreover, it is practically not possible to recover or recycle unreacted aniline as it will couple with diazonium salt or react in further multistep synthesis. In that case, aniline will get completely consumed (in a multistep synthesis) and the yield and selectivity will become equivalent. The Central Composite Design (CCD) approach was used to plan further experiments and generate experimental data which was later used for model validation. The range of residence time for the reaction was varied between 45 s to 230 s while the temperature was varied over 0 to 10 °C.RTD experiments were performed for a residence time (τ) of 45–230 s to obtain model parameters (PeM) for the straight tube reactor. The E-curve and the obtained model parameters are shown in Fig. 5 (top row). The model parameters were estimated and optimized by the least square technique using ∑(Fexp − FModel)2. The model parameters are the average of three experiments. Details of the F-curves and the optimization protocol are given in the ESI.† For the majority of our experiments, PeM was above 20. For Pe > 16, the analytical solution of open–open boundary conditions (given by eqn S3 in the ESI†) provides a good approximation for a closed–closed system.43 The model F-curve was obtained through numerical integration and the corresponding Pe for closed–closed conditions was obtained using eqn S4 in the ESI.†43,44Fig. 6 shows the comparison of the experimental and predicted selectivity (or yield) of diazonium salts. The standard deviation for the yields was below 4.7%.
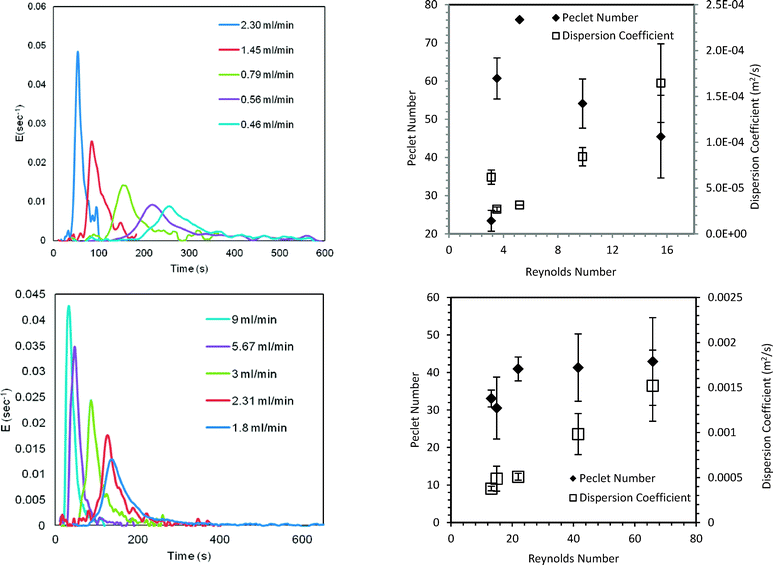 | ||
| Fig. 5 (Top row) Straight tube reactor; (bottom row) helical coil reactor. (Left) E-curves; (right) variation in the parameters at different inlet flow rates. | ||
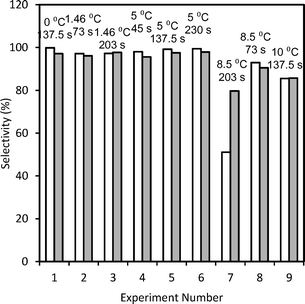 | ||
| Fig. 6 Selectivity (%) of diazonium salt (blank bars and filled bars correspond to the experimental data and predictions, respectively). | ||
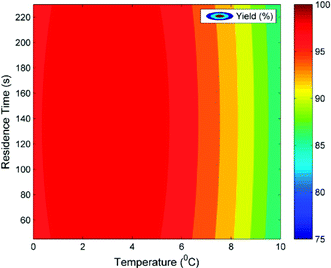
According to Scheme 2, the diazonium salt decomposes if T > 5 °C and hence the selectivity decreases depending upon the extent of dispersion. Being a 3rd order reaction, dispersion has a significant effect on the diazotization reaction while it has a lesser impact on the decomposition reaction, which is a 1st order reaction. Thus, above 5 °C, lesser dispersion (low Re) will favour the diazotization reaction. The maximum productivity obtained by the experiments was 6.79 g h−1 mL−1 with a residence time of 45 s and at 5 °C. Experimentally obtained model parameters (PeM) and calculated DaM were used in the isothermal model and the model was validated. At T > 5 °C, the values of Da for decomposition (DaD) were fitted. At 8.5 °C, the fitted DaD varied from 0.3 to 1.2. The validated isothermal model was used to generate the contour plot shown in Fig. 7. DaR and PeM were estimated as discussed before whereas the mixing time correlation was used to calculate the DaM. Simulations were performed for a residence time range of 45 s to 230 s and a temperature range of 0 °C to 10 °C. The DaM for this residence time range was in the range of 4.47–4.57. This indicates that the residence time is greater than the mixing time by a factor of 4.47–4.57 which is sufficient to get a higher yield. This can be clearly seen for the temperature range of 0 °C to 5 °C where the predicted yield was in the range of 98–99%. The convex nature of the contour lines is because of the effect of dispersion. At 137.5 s, PeM was 76 (relatively lesser effect of dispersion) whereas at 45 s and 230 s, PeM was 45 and 23, respectively (relatively higher effect of dispersion), which resulted in the convex nature of the contour lines. At temperatures above 5 °C, the DaD obtained earlier from fitting was used for simulation. At 8.54 °C and 10 °C, the values of DaD were 0.3 and 0.8, respectively. Fig. 7 can also be used to find robust operating conditions. By robust region of operating conditions we mean that variation in yield with respect to infinitesimal change in process variables should be less than 1%. This aspect is very important on a plant scale in order to get constant quality product which generally has constant fluctuations in operating parameters. Fig. 7 suggests that operating at 2–4 °C would be more beneficial. This is because slight variation in flow rate (and hence effect of axial dispersion) will not affect the performance of the reactor if the reactor is operated at 2–4 °C. If we operate at 5 °C, a slight variation in temperature on a higher side can cause a decomposition reaction resulting in a lower yield. In general, DaM should be greater than 4 (i.e. residence time should at least be four times the mixing time) in order to get ∼99% yield for temperatures of 0 °C to 5 °C.
It needs to be noted that the dispersion model being a mechanistic model (based on first principle) can be extrapolated and thus can be useful for scale-up. With the validated dispersion model, such contour plots can be generated for any type of flow reactor and any diazotization reaction once we know the model parameters (PeM, DaM and DaR) for the operating conditions under study. The contour plot and validated regression model obtained by Central Composite Design are given in the ESI.†
This validated axial dispersion model was further used to predict the yield and hence the productivity of diazonium salt for a coiled tube reactor (SS316, 1.75 mm i.d. tube, 4.5 mL). RTD experiments were initially performed and model parameters (PeM) were obtained as discussed earlier for a residence time of 30–150 s (Fig. 5, bottom row). DaM was calculated using the mixing time correlation. The diazotization reaction was performed for the given residence times at 5 °C. The predicted yield was within 1.6–3.6% of the experimental yield and is shown in Fig. 8.
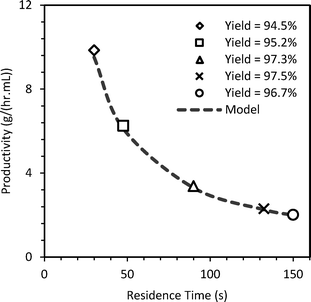 | ||
| Fig. 8 Experimental and predicted productivity (g h−1 mL−1) of diazonium salt in coiled reactor at 5 °C. | ||
Scale-up experiments
Scaling-up of the diazotization reaction was performed in the AmAR3 reactor (volume = 35 ml) using the isothermal dispersion model. The scale-up criteria was set to get about 99% yield of diazonium salts. Our objective was also to test our model with the AmAR3 reactor. The RTD experiments were performed and the E-curve for the AmAR3 reactor was analyzed to obtain the model parameter as an input for model. The relevant details are given in the ESI.† For PeM = 78 and DaR = 31![[thin space (1/6-em)]](https://www.rsc.org/images/entities/char_2009.gif) 309, the predicted yield of the diazonium salt was 99.65%. Reactions were performed several times at 2 °C and at a residence time of 6.25 min. Fig. 1 shows the experimental setup for scale-up in the AmAR3 reactor. The yield for the reaction was 99.48% with a productivity of 0.82 g h−1 mL−1 of diazonium salt. The % absolute error in the predicted yield is 0.17% which is acceptable.
309, the predicted yield of the diazonium salt was 99.65%. Reactions were performed several times at 2 °C and at a residence time of 6.25 min. Fig. 1 shows the experimental setup for scale-up in the AmAR3 reactor. The yield for the reaction was 99.48% with a productivity of 0.82 g h−1 mL−1 of diazonium salt. The % absolute error in the predicted yield is 0.17% which is acceptable.
Scale-up methodology for pilot and production scale
On a laboratory scale, it is relatively easy to maintain near isothermal conditions. The main challenge in the scale-up of diazotization is the temperature control and lower yield which is a result of decomposition or coupling with the unreacted aniline. Both of these issues can be addressed by operating strictly below 5 °C and in a lesser dispersion region. The initial concentration, physical properties like heat capacity or density and other operating conditions can strongly influence the temperature profile inside the reactor. Following three examples will demonstrate the effects of these variables on the temperature profile of a tubular reactor having a 20 mm inner diameter and 10 m length at a residence time of 45 s. Non-isothermal simulations were performed in the transition and turbulent regimes. Dispersion coefficients were estimated using correlation charts for dispersion in pipes.31 Before we discuss the observations, we bring out a few important issues related to keeping the reaction mixture homogeneous.The extent of deviation in the yield of diazonium salt is directly related to the adiabatic temperature rise in the reactor. The concentration at the inlet of the reactor can be achieved by using a fixed volume of solvent. By using different solvents in the same amount (by volume), one can achieve the same initial concentration but different average heat capacities and average densities of the reaction mixture. The model parameter values are given in the ESI.† The adiabatic temperature rise for different solvents is: 21. 6 °C for DMF, 22.5 °C for acetone, 20 °C for methanol, 20.4 °C for ethanol, 18.3 °C for DMSO , 22.5 °C for acetonitrile and 9.8 °C for water. Water has the minimum adiabatic temperature rise as compared to other organic solvents due to its higher heat capacity. The organic solvent having the least adiabatic temperature rise (DMSO, 18.26 °C) still has a temperature rise higher than that of water (9.85 °C). Hence, one should prefer to carry out diazotization in aqueous medium wherever possible.
In many practical cases, the aniline substrate may not be soluble in water. In such cases one should prefer to use a water–solvent mixture instead of using a pure organic solvent to reduce the probability of hot spots. The initial aniline concentration of 0.3 mol L−1 can be obtained by using a water–acetone mixture with a different volume percent of water and acetone. The detailed simulation results showing the concentration and temperature profile for different water–acetone mixtures are given in the ESI† (Fig. S11). Owing to the higher density and heat capacity of water than those of acetone, with increasing water concentration, the hot spot temperature decreases. The productivity of diazonium salt for 100% water and 75% water–acetone mixture is 82.74 ton per year. For other cases, the productivity will decrease due to the decomposition reaction as the temperature rises above 5 °C. It can also increase the temperature further, ultimately leading to a runaway reaction. In reality, one should do some solubility experiments to choose the appropriate mixture of water and solvent right in the beginning of the process development stage to avoid decomposition on a larger scale.
Increasing the concentrations of the substrates to increase the production rate for a fixed cooling capacity can be detrimental.19 Here we have quantified the effect of different initial concentrations of aniline on the performance of the reactor while the inlet temperature is maintained at 0 °C. The concentration and temperature profiles for different initial concentrations are given in Fig. S12 in the ESI.† It was observed that a higher concentration would lead to more conversion but it will also have a higher hot spot temperature. For a higher inlet temperature, the hot spot temperature will also be higher. Thus, for 0.3 mol L−1 of inlet concentration, the productivity will be 82.74 tons per year. Productivity can be further increased by increasing the heat transfer area even at the same residence time.
The optimal conditions for the synthesis of diazonium salt for a variety of anilines are being used for the synthesis of various hydrazines as well as monoarylacetaldehydes through flow synthesis. Details will be reported separately.
Conclusions
A modelling and scale-up approach is developed and experimentally validated for the diazotization reaction in flow reactors. Detailed analysis of the performance of four different flow reactor configurations (straight tube, coiled tube, pinched tube and AmAR3 flow reactor) was carried out through a systematic investigation of RTD and yield of the diazonium salt.The optimization of the diazotization reaction for a straight tube reactor using an isothermal dispersion model as well as the central composite design approach recommends that the synthesis of diazonium salt below 5 °C in a lesser dispersion region favours a higher yield.
Critical analysis of experimental and simulated results obtained for four different flow reactor configurations (straight tube, pinched tube, coiled tube and AmAR3 flow reactor) clearly indicate that it is desirable to operate the reactor to ensure that the residence time is much (four to five times) greater than mixing time. This will realize a yield close to 100% (see Fig. 4B) provided that the reaction temperature is maintained below 5 °C.
The extent of deviation in the yield is directly related to the adiabatic temperature rise in the reactor and selection of a suitable solvent can help to reduce the extent of temperature rise in the reactor. It is recommended to use water as a solvent as it shows the lowest adiabatic temperature rise as compared to other organic solvents. For water insoluble aniline derivatives, the use of a solvent–water mixture instead of a pure organic solvent would minimize the thermal effect upon scale-up.
Nomenclature
| A t | Cross-section area (m2) |
| A s | Surface area (m2) |
| C A | Dimensionless concentration of anilinium chloride salt |
| C A0 | Initial concentration of aniline or anilinium chloride salt (mol L−1) |
| C Pmix | Heat capacity of reaction mixture (kJ/(Kg K)) |
| d | Inner diameter (m) |
| D | Axial dispersion coefficient (m2 s−1) |
| Da | Damkohler number for desired reaction |
| DaR | Reaction Damkohler number, τ/tR |
| DaM | Mixing Damkohler number, tm/tR |
| DaD | Damkohler number for decomposition reaction(s) |
| E | Activation energy (kJ mol−1) |
| F | F-curve (normalized concentration curve) |
| f | Friction factor of smooth pipes |
| h | Heat transfer coefficient (W m−2 K−1) |
| k | Rate constant (L2 mol−2 s−1)) |
| k 0 | Pre-exponential factor or frequency factor (L2 (mol−2 s−1)) |
| L | Length of reactor (m) |
| Nu | Nussalt number, hd/λ |
| Peoo | Peclet number for open–open condition |
| Pecc | Peclet number for closed–closed condition |
| PeM | Peclet number for mass balance, UL/D |
| PeH | Peclet number for heat transfer, ULρCPmix/λ |
| Pr | Prandtl number, μCPmix/λ |
| Q | Dimensionless rate of cooling or heating, h(T − Tw)As/(UρAtCPmixT0) |
| R | Gas constant (J mol−1 K−1) |
| Re | Reynolds number, duρ/μ |
| t R | Reaction time (s) |
| t m | Mixing time (s) |
| T | Dimensionless temperature |
| T 0 | Initial temperature (K) |
| T w | Wall temperature (K) |
| U or u | Average velocity (m s−1) |
| Z | Dimensionless length |
Greek symbols
| α | Mixing time correlation constant |
| β | Thermicity factor, (−ΔH)CA0/(ρCPmixT0) |
| γ | Dimensionless activation energy, E/(RT0) |
| ΔH | Heat of reaction (kJ mol−1) |
| λ | Thermal conductivity (W/(mK)) |
| μ | Viscosity (kg m−1 s−1) |
| Θ | Dimensionless time |
| ϕ | Sodium nitrite to aniline mole ratio = (1.2) |
| ρ | Density (kg m−3) |
| τ | Residence time (s) |
Acknowledgements
CS acknowledges the CSIR for JRF/31/GATE/11(32)/2013-EMR-I fellowship. The authors acknowledge the financial support from the Indus Magic Program (CSC0123) of CSIR. The authors also acknowledge the help of Dr. R. A. Joshi of Org. Chem. Div. of NCL, Pune during the NMR analysis.References
- L. Kürti and B. Czakó, Strategic Applications of Named Reactions in Organic Synthesis: Background and Detailed Mechanisms, Elsevier Academic Press, 2005 Search PubMed.
- M. R. Heinrich, Chem. – Eur. J., 2009, 15, 820–833 CrossRef CAS PubMed.
- F. Mo, G. Dong, Y. Zhang and J. Wang, Org. Biomol. Chem., 2013, 11, 1582–1593 CAS.
- R. Fortt, R. C. Wootton and A. J. de Mello, Org. Process Res. Dev., 2003, 7, 762–768 CrossRef CAS.
- D. F. DeTar, in Organic Reactions, John Wiley & Sons, Inc., 2004, ch. 7, pp. 409–462 Search PubMed.
- Z.-Q. Yu, Y.-W. Lv, C.-M. Yu and W.-K. Su, Tetrahedron Lett., 2013, 54, 1261–1263 CrossRef CAS.
- D. P. Hari and B. Koenig, Angew. Chem., Int. Ed., 2013, 52, 4734–4743 CrossRef CAS PubMed.
- N. Chernyak and S. L. Buchwald, J. Am. Chem. Soc., 2012, 134, 12466–12469 CrossRef CAS PubMed.
- V. G. Bhaya, R. A. Joshi and A. A. Kulkarni, J. Flow Chem., 2014, 4, 211–216 CrossRef.
- A. Roglans, A. Pla-Quintana and M. Moreno-Manas, Chem. Rev., 2006, 106, 4622–4643 CrossRef CAS PubMed.
- S. Bhattacharya, S. Majee, R. Mukherjee and S. Sengupta, Synth. Commun., 1995, 25, 651–657 CrossRef CAS.
- N. Oger, M. d'Halluin, E. Le Grognec and F. O.-X. Felpin, Org. Process Res. Dev., 2014, 18, 1786–1801 CrossRef CAS.
- K. Meguro and T. Fujita, US Pat., 4687777, Takeda Chemical Industries, Ltd., 1987 Search PubMed.
- H. Satoh, M. Komuro, K. Murakami and K. Awano, US Pat., 6706763B1, Kyorin Pharmaceutical Co., Ltd., 2004 Search PubMed.
- G. J. Wells, M. Tao, K. A. Josef and R. Bihovsky, J. Med. Chem., 2001, 44, 3488–3503 CrossRef CAS PubMed.
- R. C. Wedlich, Chem. Eng. Prog., 2001, 97, 60–61 CAS.
- S. Partington and S. Waldram, Process Saf. Environ. Prot., 2002, 80, 33–39 CrossRef CAS.
- UK Chemical Reaction Hazards Forum, http://www.crhf.org.uk/incident71.html, (accessed June 2015)).
- F. Stoessel, Thermal safety of chemical processes: risk assessment and process design, John Wiley & Sons, 2008 Search PubMed.
- J. M. Sullivan, J. Chem. Educ., 1971, 48, 419 CrossRef CAS.
- R. W. Missen, R. W. Missen, C. A. Mims and B. A. Saville, Introduction to chemical reaction engineering and kinetics, Wiley, 1999 Search PubMed.
- L. Malet-Sanz, J. Madrzak, S. V. Ley and I. R. Baxendale, Org. Biomol. Chem., 2010, 8, 5324–5332 CAS.
- M. Chen and S. L. Buchwald, Angew. Chem., Int. Ed., 2013, 52, 4247–4250 CrossRef CAS PubMed.
- K. S. Nalivela, M. Tilley, M. A. McGuire and M. G. Organ, Chem. – Eur. J., 2014, 20, 6603–6607 CrossRef CAS PubMed.
- D. X. Hu, M. O'Brien and S. V. Ley, Org. Lett., 2012, 14, 4246–4249 CrossRef CAS PubMed.
- N. Zaborenko, E. R. Murphy, J. G. Kralj and K. F. Jensen, Ind. Eng. Chem. Res., 2010, 49, 4132–4139 CrossRef CAS.
- N. Oger, E. Le. Grognec and F. Felpin, Org. Chem. Front., 2015, 2, 590–614 RSC.
- M. Okano and Y. Ogata, J. Am. Chem. Soc., 1953, 75, 5175–5177 CrossRef CAS.
- L. Zolton, Ph.D. thesis, University of Arezona, 1962 Search PubMed.
- E. Moelwyn-Hughes and P. Johnson, Trans. Faraday Soc., 1940, 36, 948–956 RSC.
- O. Levenspiel, Chemical reaction engineering, Wiley, 1972 Search PubMed.
- L. T. Fan and Y. K. Ahn, Ind. Eng. Chem. Process Des. Dev., 1962, 1, 190–195 CAS.
- K. D. Nagy, B. Shen, T. F. Jamison and K. F. Jensen, Org. Process Res. Dev., 2012, 16, 976–981 CrossRef CAS.
- J. H. Lienhard, A heat transfer textbook, Courier Corporation, 2013 Search PubMed.
- S. S. Elnashaie and F. Uhlig, Numerical Techniques for Chemical and Biological Engineers Using MATLAB®: A Simple Bifurcation Approach, Springer Science & Business Media, 2007 Search PubMed.
- M. L. Kesler, US Pat., 2827449, American Cyanamid Company, 1958 Search PubMed.
- H. Zollinger, in Diazo Chemistry I: Aromatic and Heteroaromatic Compounds, 1994, ch. 2, pp. 11–37 Search PubMed.
- T. Norris, C. Bezze, S. Z. Franz and M. Stivanello, Org. Process Res. Dev., 2008, 13, 354–357 CrossRef.
- E. L. Paul, Chem. Eng. Sci., 1988, 43, 1773–1782 CrossRef CAS.
- M. Sharma, V. S. Reddy and A. A. Kulkarni, Ind. Eng. Chem. Res., 2014, 53, 1916–1923 CrossRef CAS.
- V. V. Ranade, M. K. Sharma and A. A. Kulkarni, Chem. Eng. J., 2015, 278, 454–468 CrossRef CAS.
- E. L. Paul, V. Atiemo-Obeng and S. M. Kresta, Handbook of Industrial Mixing: Science and Practice, John Wiley & Sons, 2003 Search PubMed.
- P. Mavros, Miner. Eng., 1992, 5, 1053–1060 CrossRef CAS.
- M. Ityokumbul, N. Kosaric and W. Bulani, Chem. Eng. Sci., 1988, 43, 2457–2462 CrossRef CAS.
Footnote |
| † Electronic supplementary information (ESI) available. See DOI: 10.1039/c5re00056d |
| This journal is © The Royal Society of Chemistry 2016 |


