Combining microfluidics and FT-IR spectroscopy: towards spatially resolved information on chemical processes
Adeline
Perro
*a,
Gwenaelle
Lebourdon
a,
Sarah
Henry
b,
Sophie
Lecomte
b,
Laurent
Servant
a and
Samuel
Marre
*c
aInstitut des Sciences Moléculaires, Université de Bordeaux—CNRS, 351 cours de la libération, 33405 Talence, France. E-mail: adeline.perro@enscbp.fr
bChimie et Biologie des Membranes et des Nanoobjets, Université de Bordeaux —CNRS, 2 rue Robert Escarpit, 33607 Pessac, France
cICMCB, CNRS, Univ. Bordeaux, F-33600 Pessac, France. E-mail: samuel.marre@icmcb.cnrs.fr
First published on 2nd September 2016
Abstract
This review outlines the combination of infrared spectroscopy and continuous microfluidic processes. FTIR spectroscopy gives access to the microscopic chemical composition of samples, which can be correlated with their macroscopic properties. This approach is widely used in chemistry or biology to get insights into reactive media. Meanwhile, the miniaturization of flow chemical reactors offers many advantages such as the small amount of products used or the versatility of the reactors. Coupling these two approaches creates major opportunities for the analytical field, although it raises additional challenges. Emphasis is placed on the most recent developments and limitations concerning the integration of infrared spectroscopy techniques within microfluidic devices, while current applications and future opportunities will be discussed.
Introduction
Initially devoted to fundamental fluid manipulations within networks of channels whose sizes range from tens to hundreds of micrometres, microfluidics has now become a mature and appropriate tool for chemistry, biology, soft matter investigations and materials science.1–8 This is particularly highlighted by the exponential development of microfluidic processes and architecture devices over the past 15 years. One of the main advantages in using such continuous microscale reactors integrated with heaters and fluid control elements lies in the enhancement of mass and heat transfer, the reproducibility, the potential for sensor integration for in situ reaction monitoring, the rapid screening of parameters, the low reagent consumption and eventually the ability to have feedback control on the process parameters (temperature, feed streams) during optimization.9 In addition to conventional offline characterization techniques (gas chromatography (GC), high-performance liquid chromatography (HPLC), mass spectrometry (MS), microscopy, etc.), process intensification requires adapted in situ characterization tools for monitoring in real time the evolution of the reactive fluidic medium within a microchannel (besides its temperature and pressure). In this context, various types of approaches have already been demonstrated in the literature, including for instance dynamic light scattering,10,11 X-ray scattering12 or photoluminescence.13 Nevertheless, optical spectroscopy remains by far the best option for determining concentrations of reagents and products and for probing a chemical reaction, which is the primary analytical challenge for creating automated microreactor platforms that can be used to get insights into reaction mechanisms and kinetics.14Optical spectroscopy techniques have largely benefited from the recent advances in instrumentation design: detectors, sources, coupling of spectrometers with microscopes that offer spatially resolved spectra (spatial resolution being set by the incident light wavelength). Furthermore, data processing is being developed intensively in order to provide rapid spectral resolution methods aiming at evidencing the presence of several species and – ideally – at which amount (more and more commercial packages are available for data analysis). A major issue of significance is that both microfluidics and optical micro spectroscopy share a common characteristic length (the lowest dimension for the former, the wavelength of the probing beam for the latter) that lies typically in the micrometer range: as a result, it appears worthwhile and fruitful to combine the two techniques in order to get spatially resolved insights into the processes occurring within a microchannel. Additionally, the spectra acquisition time, that is usually a core issue for investigating dynamic processes or photoreactive species using spectroscopy, is no more a critical parameter when considering continuous microfluidics platforms, as fluid flows are in a steady state regime. Each location along a channel corresponds directly to a time t (that is roughly inversely proportional to the flow velocity) counted from a given origin (e.g. reactant introduction, mixing, etc.): positioning the objective of a micro spectrometer at a given location of a channel network will result in a spectroscopic picture of the fluid at time t in the history of the flow, regardless of the acquisition time. For instance, in the case of reactive fluids, it is possible to choose the flow rates and the distances where the system is spectroscopically interrogated in order to probe reaction times in the millisecond range. All these features emphasize the power of coupling microfluidics and optical spectroscopy depending on the focus (spatial resolution, chemical selectivity, etc.). The literature abounds in papers devoted to the coupling of fluorescence,15–18 UV-vis19 and Raman20–23 spectroscopy with microfluidics: fluorescence is very sensitive, while Raman is very selective, both using incident light usually in the visible range, ensuring a spatial resolution in the micrometer range at worse. However, the use of visible light (including laser light in some cases) can possibly damage the samples. Additionally, Raman spectroscopy suffers from a lack of sensitivity, while requiring long acquisition times. The coupling with surface enhanced Raman scattering was also reported and allows the characterization of molecules at very low concentration. Nevertheless, it is specific for mainly aromatic molecules.24,25 To overcome these limitations, it could be advantageous to consider the use of infrared spectroscopy. In recent years, mid-infrared (mid-IR) spectroscopy has been proven to be a simple, reliable, relatively fast and cost-effective technique for analyzing complex media, creating unique molecular fingerprints. It is used in many research and industrial areas, from quality control to forensic analysis.26 Indeed, although the spatial resolution might somewhat decrease when considering imaging purpose compared to Raman spectroscopy, the probing will gain in selectivity and in quantitativeness. Although the use of mid-IR spectroscopy coupled to microfluidic systems has been demonstrated,27–30 it is still challenging because of issues related to the fabrication materials (transparency, chemical compatibility, etc.). Indeed, conventional materials used for the fabrication of microfluidics platforms (glass, PDMS, etc.) cannot be easily used due to their IR adsorption and new developments have to be realized in designing microchips transparent in the mid-IR wavelengths.
Last but not least, it is well known that molecules adsorbed on adapted metal film islands may give rise to an enhanced IR absorption that pushes the limits of IR sensitivity. This effect, known as surface-enhanced infrared absorption (SEIRA), is analogous (to some extent) to surface-enhanced Raman scattering (SERS) and originates from plasmonic resonance generated by assemblies of metallic nanoparticles. Interestingly, it was recently reported that arrays of plasmonic nanoantennas, with resonance in the mid-infrared and display a 104–105-fold IR signal enhancement. This demonstration paves the way for future work where such signal enhancing nanostructures could be integrated within microchannels.
The aim of this review is to present an overall picture and a view of prospects in the coupling of microfluidic platforms with infrared microprobes in order to get specific in situ information on chemical processes. Some basic concepts of microfluidics and infrared micro spectroscopy will be first introduced in order to emphasize the interest of coupling the two approaches to get spatially and temporally resolved data on the chemical phenomena hosted in microchannels. The specific constraints induced by the coupling of the two methods will then be discussed in terms of sampling and instrumentation performances through the presentation of various examples. Possible future directions for addressing the current limitations will be finally presented.
Fundamentals of IR spectroscopy
General overview
Molecules possess discrete rotational and vibrational energy levels. The transition between vibrational levels may occur following the absorption of photons with wavelengths ranging between typically 780 nm and 50 μm (12![[thin space (1/6-em)]](https://www.rsc.org/images/entities/char_2009.gif) 800–200 cm−1) if (i) their energy exactly matches the difference between two vibrational energy levels and (ii) the dipole moment of the molecule changes during the vibration (IR selection rule). Any typical molecular vibrations can be expressed as a linear combination of the so-called normal modes of vibration. A molecule containing N atoms has 3N − 6 or 3N − 5 normal modes if exhibiting nonlinear or linear geometries, respectively. These modes can be described by a simple harmonic oscillator model. The infrared activity of normal modes can be determined solely from the knowledge of the symmetry of the considered molecule. The classification of a molecule according to its symmetry elements using group theory provides a way to evidence the relationship between the molecular structure and its vibrational spectrum. The bands observed on the spectra are extremely useful for identifying the types of bonds that are present in a sample. These bands can be characterized by their vibrational wavenumber (typical of the transition energy involved, whereas shifts in wavenumber can give insights into changes in bonding and environment), by their intensity (related to the magnitude of the change in the bond dipole moment and to the sample amount and bond polar character) and by their band profile (depending on the interactions of the molecules with their environment).31 In some cases (e.g. mixtures), the similarity of components' spectra makes it difficult to differentiate the components by a simple inspection of spectra and band fitting. It then may be useful to use statistical methods (e.g. chemometrics: classical least-square (CLS) and principal least-square (PLS) methods for the statistical analysis of experimental data). A comprehensive description of these approaches is beyond the scope of this review but may be found in ref. 32. However, the improvement of computer technology made these tools already available in several commercial set-ups.
800–200 cm−1) if (i) their energy exactly matches the difference between two vibrational energy levels and (ii) the dipole moment of the molecule changes during the vibration (IR selection rule). Any typical molecular vibrations can be expressed as a linear combination of the so-called normal modes of vibration. A molecule containing N atoms has 3N − 6 or 3N − 5 normal modes if exhibiting nonlinear or linear geometries, respectively. These modes can be described by a simple harmonic oscillator model. The infrared activity of normal modes can be determined solely from the knowledge of the symmetry of the considered molecule. The classification of a molecule according to its symmetry elements using group theory provides a way to evidence the relationship between the molecular structure and its vibrational spectrum. The bands observed on the spectra are extremely useful for identifying the types of bonds that are present in a sample. These bands can be characterized by their vibrational wavenumber (typical of the transition energy involved, whereas shifts in wavenumber can give insights into changes in bonding and environment), by their intensity (related to the magnitude of the change in the bond dipole moment and to the sample amount and bond polar character) and by their band profile (depending on the interactions of the molecules with their environment).31 In some cases (e.g. mixtures), the similarity of components' spectra makes it difficult to differentiate the components by a simple inspection of spectra and band fitting. It then may be useful to use statistical methods (e.g. chemometrics: classical least-square (CLS) and principal least-square (PLS) methods for the statistical analysis of experimental data). A comprehensive description of these approaches is beyond the scope of this review but may be found in ref. 32. However, the improvement of computer technology made these tools already available in several commercial set-ups.
Instrumental issues and potentialities
The basic issue in a spectroscopy experiment is accessing a good signal intensity (high signal-to-noise ratio – SNR), taking into account (i) the properties of the light source and its treatment, (ii) the detector and (iii) the sampling conditions and spectra acquisition modes.In the case of infrared spectroscopy, the incoming beam is generally provided by means of black body sources, which are generally temperature dependent with low to average brightness (e.g. a globar). Despite some limitations, these are simple, robust and cheap light sources exhibiting broadband emission. However, more and more experiments are performed using synchrotron infrared light, providing a 100–1000 times brighter light than a thermal source. The main interest concerns the better spatial resolution that can be obtained, typically down to pixel sizes of ∼1 × 1 μm when using array detectors.33 Furthermore, the coupling of commercial infrared microscopes with a synchrotron IR light source involves only minor adaptations, although the associated accessibility cost to synchrotron facilities can be high.
Infrared detectors used in microscopes show high sensitivity and involve broadband or narrow-band mercury cadmium telluride (MCT). Others such as focal plane array (FPA) detectors consist of an array of IR detector elements, which enable acquiring spectra at various locations of the pixel array and collecting them simultaneously. Such devices have been successfully coupled to interferometers and have dramatically improved the rate at which IR images can be collected.
Concerning the sampling conditions, when FTIR is combined with microfluidic systems, the overall objective is to record spectra from reactive flows circulating within microchannels. Three types of acquisition modes are commonly considered: single point analysis, mapping and imaging. Single point analysis consists of recording a single FTIR spectrum at a particular location of the sample, thus preventing one from getting a general overview of it or studying dynamic systems. However, high spectral resolution can be achieved, which can be used for trace detection applications, for instance. Mapping refers to multiple individual point spectra acquisition and further recombination to obtain a spatial image of the interrogated sample. This approach is somewhat time-consuming but allows accessing a very high SNR for high quality spectra. FTIR imaging does not operate in the same way; indeed, the use of FPA or other array detectors allows the acquisition of thousands of spectra simultaneously. Although the SNR is generally lower, a large area can be mapped in a short time and with a good spatial resolution owing to the combination with IR microscopes. This option is therefore typically more convenient when considering flow applications.
Combining microfluidics and FTIR spectroscopy: strategies and challenges
When targeting spatially resolved information on chemical processes at the microscale, conventional FTIR equipment can be coupled with microreactors as long as a few preliminary issues are taken into account. In particular, the transparency of the microfluidic system fabrication materials in the IR wavelength range and/or the microchannel geometries (channel dimensions, spatial extension of the mixing zone, etc.) are of primary importance, depending on the absorption properties of the medium to be analyzed. Such approaches allow for reaction imaging along the entire microchannel at the micrometer scale with an IR microscope. We discuss thereafter the main strategies and challenges of this coupling.FTIR modes coupled to microreactors
There are basically two ways to perform FTIR experiments: in transmission or in reflection (specular reflection or ATR-FTIR) mode (Fig. 1).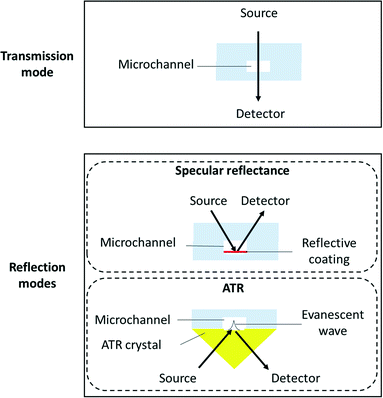 | ||
| Fig. 1 Schematic cross section view of a microreactor when considering transmission or reflection modes for FTIR spectroscopy. | ||
| ΔP = QR | (1) |
 | (2) |
 | (3) |
Such high potential pressure drop values could lead to major experimental issues of concern regarding not only the compatibility of the reactive fluid with the pressure within the channel (such pressure fields could, for instance, damage biological materials) but also the microreactor fabrication approaches and the overall pressure handling of the set-up (avoid delamination, stability injection pumps issues, packaging, etc., see the “Materials challenge” section for details).
The internal specular reflectance mode known as ATR-FTIR is certainly an approach very well adapted to microfluidic experiments. Indeed, it relies on the total internal reflection that can occur at the boundary between two media. This effect happens when IR radiation comes from an optically dense medium (refractive index n1) towards an optically rare medium (refractive index n2 < n1) with an angle of incidence θ greater than the critical angle θc (angle of incidence above which total internal reflection occurs). In this case, the beam is reflected to the dense medium and an evanescent electric field is created at the interface in the rare medium side. Its amplitude E decays exponentially as a function of the distance from the interface, as follows:
 | (4) |
 | (5) |
Note that dp is proportional to λ and depends on θ, n1 and n2. In the case of typical IR materials and incident IR wavelength light, dp is in the micrometer range. This results in ATR-FTIR appearing particularly well adapted to probe the interfacial volume adjacent to the boundary between two phases (having n1 and n2 as refractive indices). In a typical ATR-FTIR experiment, a so-called ATR crystal, acting as the dense medium (1) is in contact with a rarer medium (2) to be probed. Classical ATR-FTIR set-ups exist to investigate liquid (medium 2)–solid (medium 1) interfaces where the ATR crystal is part of a flow cell that is mounted inside the sample compartment of the spectrometer. Such designs can be easily miniaturized and extrapolated to microfluidic architecture. The strength of this approach is that the sampling volume is controlled and reproducible (through the control of the value of dp) and the signal may be amplified by increasing the number of active internal reflections at the interface. For this purpose, it is possible to play on the choice of the ATR crystal materials and/or on the value of θ and/or on the functionalization of the ATR material by considering, for example, adapted metallic nanostructures providing SEIRA effects.
Table 1 summarizes the advantages and limitations of the three possible FTIR modes coupled to microfluidic systems.
| Mode | Advantages | Limitations |
|---|---|---|
| Transmission | •Easy to implement•Good spatial resolution (∼2–5 μm) •Analysis of wide areas (up to 0.5 × 0.5 mm) |
•Requires transparent construction materials•Pressure drop generated by fluid flow for small channel depths •Thickness: needs to be sufficiently important to collect signal (≥5 μm) but should be kept at a minimum when interrogating an absorbent fluid, e.g. water (≤10 μm) |
| Specular reflectance | •Good spatial resolution (∼2–5 μm)•Requires half of the sample thickness compared to transmission | •Same as for transmission•More complicated signal analysis |
| ATR | •High spatial resolution (∼1 μm)•Reproducible sampling volume independently from the microchannel depth •Signal can be amplified by multiple reflections at the interface |
•Analysis of small thickness of fluid near the surface (<2 μm)•Pressure drop generated by fluid flow for interrogating the full sample thickness analysis •Fluid–solid (ATR crystals) interactions (deposition–sorption) might alter the signal |
Note that another classical FTIR mode is not mentioned here and has not yet been considered for microfluidics applications: diffuse reflectance infrared Fourier transform spectroscopy (DRIFTS).37 DRIFTS is a FTIR method similar to specular reflectance but devoted to the probing of rough (non-strictly flat) surfaces (by rough, we mean a surface displaying spatial inhomogeneities, irregularities whose magnitude lies typically in the micrometer range, thus causing possible scattering of the incident IR light) by surface analysis (such as powders) generating multiple reflections on the substrate.35–38 This technique is generally not used in microfluidics applications since the bottoms of microfluidic channels are mostly flat. Future opportunities linked to the use of DRIFTS in combination with microreactor applications will be discussed in more detail in the “Challenges and opportunities” section.
Materials challenge
Microfluidics involves the circulation of fluids within channel networks with typical sizes in the micrometer range. The architecture of these networks depends on the microfabrication technique performance and on the materials that can be used to design the channel platforms. The chip material plays a crucial role: it affects the possible channel shape and dimension that might be fabricated, the flow conditions (strong surface effects) that might be achieved and the chemicals which could be used. Considering the latter, the nature of the wetting materials could indeed limit the chemical compatibility of the full device. A major issue is the design of the adapted microfluidic cells that can be coupled to infrared microscopes. This imposes that the channel architectures have to be designed with materials that: (i) transmit infrared light efficiently and (ii) that can be manufactured with the use of the current microfabrication and packaging techniques.![[thin space (1/6-em)]](https://www.rsc.org/images/entities/char_2009.gif) 000 nm), where most of the organic species display absorption bands, we can see that conventional microfabrication materials such as glasses are not transparent over the full window. This strongly limits the analysis potentialities. Therefore, other materials have to be considered such as CaF2, sapphire, ZnSe or silicon. Note, however, that the two latter materials are not fully transparent in the visible range, which limits the coupling with other in situ characterization techniques. It is indeed interesting to consider materials displaying a full transparency over both the (UV) visible and the mid-IR range in order to couple FTIR with all the available [microfluidics–light] interaction tools such as conventional optical microscope observations or photo excitation means (for photochemical applications). Another limitation might arise from the considered solvent. For instance, it is well known that water displays large absorption bands in the 3000–3500 cm−1 range, which could also hinder some absorption signals from other species and add additional constraints, in particular for biological applications. The contribution of water solvent can be easily subtracted if the thickness is smaller than 10 micrometers.
000 nm), where most of the organic species display absorption bands, we can see that conventional microfabrication materials such as glasses are not transparent over the full window. This strongly limits the analysis potentialities. Therefore, other materials have to be considered such as CaF2, sapphire, ZnSe or silicon. Note, however, that the two latter materials are not fully transparent in the visible range, which limits the coupling with other in situ characterization techniques. It is indeed interesting to consider materials displaying a full transparency over both the (UV) visible and the mid-IR range in order to couple FTIR with all the available [microfluidics–light] interaction tools such as conventional optical microscope observations or photo excitation means (for photochemical applications). Another limitation might arise from the considered solvent. For instance, it is well known that water displays large absorption bands in the 3000–3500 cm−1 range, which could also hinder some absorption signals from other species and add additional constraints, in particular for biological applications. The contribution of water solvent can be easily subtracted if the thickness is smaller than 10 micrometers.
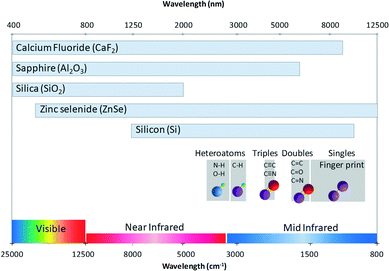 | ||
| Fig. 2 Guide for FTIR analysis in microfluidic reactors. The chart represents the transparent domain of the materials and the major region of some conventional spectra of bond stretching. | ||
Table 2 summarizes some of the materials that can be used to perform infrared experiments along with the association of FTIR mode and the selected source. The chemical stability and the mechanical properties of the fabrication materials regarding the considered reaction medium also have to be taken into account. In particular, the best combination and configuration have to be defined when considering harsh reaction conditions (high pressure or temperature, aggressive chemistry, etc.).
| Materials | IR mode | Sampling conditions | Source | Ref. |
|---|---|---|---|---|
| Silicon | Transmission | Single Point Analysis | Globar | 43 |
| Reflection | Single Point Analysis | Globar | 45, 74, 75 | |
| Mapping | Synchrotron | 78 | ||
| Silicon/CaF2 | Transmission | Single Point Analysis | Globar | 96 |
| Imaging | Globar | 68 | ||
| CaF2 | Transmission | Single Point Analysis | Globar | 27, 48, 49, 67, 97, 103 |
| Synchrotron | 53, 65, 107, 109 | |||
| Mapping | Globar | 106 | ||
| Synchrotron | 70, 110 | |||
| Imaging | Globar | 28, 42, 50 | ||
| Polymers | Transmission | Imaging | Globar | 71 |
| Diamond | Reflection | Single Point Analysis | Globar | 77, 79, 99 |
| Online | Globar | 88 | ||
| ZnSe | Reflection | Online | Globar | 98 |
| Imaging | Globar | 73, 76 | ||
| React-IR (commercially available) | Reflection | Inline | Globar | 80, 81, 85–87, 89–93 |
| Material | Mold | Sealing | References |
|---|---|---|---|
| Silicon | Etched silicon | Anodic bonding | 75 |
| Fusion bonding | 43, 45 | ||
| Silicon/CaF2 | Etched silicon | Elastomer gasket | 96 |
| Photoresist film | Chemical adhesion | 68 | |
| CaF2 | Photoresist film | Mechanical clamps | 103, 106 |
| Thermo-mechanical | 108 | ||
| Thermochemical bonding | 53, 67, 70 | ||
| Photo curing of epoxy resin | 27, 48, 49 | ||
| Chemical adhesion | 29, 46 | ||
| Paraffin/wax | Thermal bonding | 28, 42, 50 | |
| PCTFE spacer | Mechanical clamps | 30 | |
| Wet etching | Mechanical clamps | 65 | |
| PDMS | Chemical adhesion | 62 | |
| Polymers | PDMS | Chemical adhesion | 71 |
| Diamond | COP | Thermal bonding | 77, 79, 99 |
| ZnSe | PDMS | Chemical adhesion | 73, 76 |
The challenge of mixing in IR microreactors
As mentioned above, the geometry of the microchannels requires some adaptation to be able to implement FTIR spectroscopy. This is even more pronounced when considering a highly absorbent solvent in the IR wavelength range, such as water, which limits the penetration depth of the incoming light. In order to be able to interrogate systems in the full channel cross section, it is therefore necessary to have shallow channels, as described above. When considering liquid flows at the micrometer scale, the hydrodynamic regime is typically laminar, exhibiting Reynolds numbers40 smaller than 1. Mixing of chemical species is thus driven by diffusion and is consequently a slow process, as the mixing characteristic time can be estimated by: | (6) |
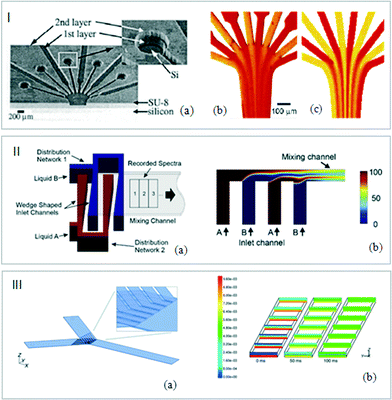 | ||
| Fig. 3 (I) (a) Snapshots of silicon channels. Experimental and CFD flow visualizations. (b) Phenol red solutions at pH 6.4 (yellow) and pH 8.0 (red). (c) Predictions of the evolution of the concentrations in the microreactor (adapted from ref. 43. Copyright 2005 American Chemical Society). (II) (a) Schematic representation of the micromixer. (b) Simulation results of a side view of the mixing channel with individual fluid layers (adapted from ref. 47. Copyright 2011 with permission from Elsevier). (III) (a) Schematic view of micromixing pattern. (b) Concentration profile of a component at different distances from the inlet (0, 0.5, 1, 1.5, 2, 2.5 and 3 mm) after stopping the flow (0, 50 and 100 ms) (adapted from ref. 49. Copyright 2001 RSC publications). | ||
Microchannels with special design configurations were also developed to increase the mixing efficiency. Lendl et al. exploited the multilamination of two liquids induced by the superimposition of microchannels (Fig. 3III). These channels were designed within a photoresist film spin-coated on CaF2 windows. In order to avoid premixing due to the superimposition of the CaF2 plates, a silver membrane was deposited in the sandwich structure constituting the device.48,49
Image optimization
Coupling microfluidics and infrared spectroscopy is very attractive for studying biological assays. Most of the IR biological analyses reported so far used CaF2 substrates due to their stability in a living medium. Nevertheless, the use of aqueous environments, the presence of parasite molecules such as nutrients or the optical distortions due to the microreactor windows lead to a decrease in the quality of the infrared spectra. To address these limitations, synchrotron facilities can be used as IR sources for FTIR analysis. However, when considering conventional sources in routine analyses at lab scale, image optimization processes are required. Chromatic aberrations appearing when the images are acquired through a thick CaF2 window can be corrected using optical devices, as reported by Kazarian et al. They have placed CaF2 lenses on the top and bottom of a microfluidic device in order to remove optical aberrations. As illustrated in Fig. 4I, the optical and FTIR images display a much better resolution using lenses. As the measured spectral region remains in focus across the whole range, a single cell was detectable only by correcting chromatic aberration.50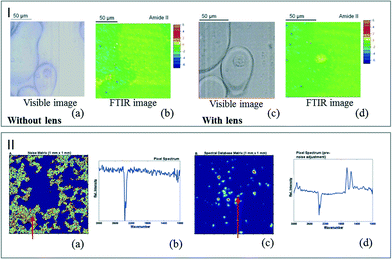 | ||
| Fig. 4 (I) Visible image of a single cell in a DPBS droplet in oil captured without the lenses (a) and with the lenses (c). FTIR image of the single cell for the amide II band without the lenses (b) and with the lenses (d) (adapted from ref. 50. Copyright 2013 RSC publications). (II) Color maps representing the noise areas (a) and the regions occupied by cells (c). (b) and (d) are examples of pixel spectra at positions indicated by the red arrows (adapted from ref. 52. Copyright 2012 RSC publications). | ||
The overcompensation created by the aqueous environment itself and the spectral distortion induced by the substrate can be corrected by image data processing. Fig. 4II illustrates the color map enhancement obtained after the image treatment. Removing the noise areas allows the observation of individual cells.51,52
Eventually, the optical efficiency of the device can also be improved, as demonstrated by Vellekoop et al. In this study, a metallic layer of titanium was deposited onto the CaF2 substrate in order to create an optical aperture allowing a better focus of the optical setup.53
Probing aqueous environments
As previously mentioned, most of the solvents – and especially water – exhibit strong absorptions in the IR wavelength. This effect constitutes a strong limitation in the development of the microfluidic devices dedicated to biological applications. The literature displays several examples exploiting the reflection processes such as the use of attenuated total reflectance (ATR) crystals coupled to open channel microdevices. In particular, ATR-FTIR spectroscopic imaging was exploited to study living human cancer cells placed onto an ATR crystal in an aqueous environment. After their growth and deposition in a single layer device, the sample was observed using an ultrabright synchrotron source. The chemical composition of the living cells was characterized by exploiting the spectral signature of different domains in the analyzed sample (Fig. 5I).54,55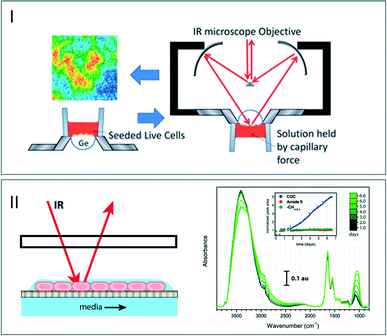 | ||
| Fig. 5 (I) Schematic view of the procedure of seeding live cells on an ATR device. FTIR images generated using the 1535 cm−1 band (adapted from ref. 54. Copyright 2013 RSC publications). (II) Left: schematic view of the microfluidic open channel device. The living cells are maintained in a thin film of fluid and nutrients are supplied from the media channel below the membrane. Right: stability of the IR measurements of cells over a week (adapted from ref. 57. Copyright 2015 RSC publications). | ||
Another advantage of using open microchannels is to ensure accessing a very thin layer of water for decreasing the path length of light through the flowing solutions without experiencing a high pressure drop (eqn (1)). This can induce the destruction of the device through delamination processes. Methods based on a free-surface fluidic device where liquid surface tension constrains a pressure-driven liquid in an open microchannel were developed.56 These approaches allow creating a continuous aqueous thin-film open to air, which can be analyzed by specular reflectance (Fig. 5II).57 The changes in the spectral intensity over seven days indicate a modification in the chemical signature of the cells. This phenomenon corresponds to the protection of the cells close to the air–liquid interface from evaporative stress. This open channel offers a controlled aqueous environment required for biological analysis, although such approaches cannot be easily extended to other applications such as flow chemical reactions, for which the flows need to be confined.
Signal enhancement
Being able to access a good IR SNR can be challenging when considering microfluidics applications since measurement efficiency and small quantities of analytes constitute two antagonist notions. In order to overcome this challenge, the use of an enhanced IR spectroscopy approach could represent major progress in the characterization steps. Surface enhanced infrared absorption (SEIRA) spectroscopy can be performed by introducing adapted aggregates of Au nanoshells with infrared resonances58 or nanoantennas.59 Yen et al. reported the fabrication of a multiband plasmonic-antenna array for intracellular bioimaging (Fig. 6I-a). They first examined a series of thin PMMA samples to demonstrate the capability of the imaging tools by comparing two vibrational signature images. These were obtained in transmission mode by following the C–O stretching signal of PMMA. Fig. 6I-a and b show the resulting images obtained by using a continuous gold film and a plasmonic antenna array, respectively. The signal resolution is clearly improved by using the plasmonic antenna allowing recognition of chemical compounds. After this demonstration step, the authors mapped human HeLa cells without the use of a labeling process or a coupler by enhancing the signal of vibrational signatures and by sensing the refractive index contrast.60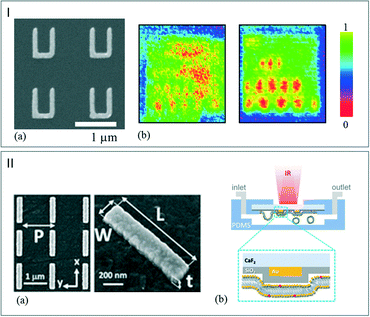 | ||
| Fig. 6 (I) (a) SEM picture of the plasmonic-antenna array. (b) Mapping of the PMMA C–O stretching mode signals. Left: continuous Au film. Right: plasmonic-antenna array (adapted from ref. 60. Copyright 2014 with permission from Elsevier). (II) (a) SEM images of gold nanoantenna array on CaF2 substrate. (b) Schematic illustration of the microreactor during the phospholipid layer deposition (adapted with permission from ref. 62. Copyright 2016 American Chemical Society). | ||
The reflection mode was exploited by Altug et al. to investigate the formation of a monolayer of biomolecules.61 In this study, gold nanoantennas (Fig. 6II-a) were deposited onto a CaF2 substrate. Then, to favor the monolayer deposition of molecules, a thin silica layer was deposited on the CaF2/gold window. The microreactor was then sealed with PDMS as illustrated in Fig. 6II-b.62 By exploiting the plasmonic field enhancement induced by the nanoantennas, the reactor is able to capture, for instance, the CH2 and amide stretching mode of the molecules with a high SNR. This provides the vibrational fingerprints of lipid molecules, which can be monitored in real time in aqueous environment during the formation of lipid membranes. This new technique allows identifying chemical components in their binding state with high sensitivity without using labeling processes.
Designing adapted microreactors for in situ FTIR probing
FTIR transmission detection
When dealing with transmission FTIR analysis coupled to microfluidics systems, silicon and calcium fluoride are generally considered as the construction materials for their transparency in the IR range. The microchannels are either etched directly in the silicon or the CaF2 wafer or designed within a photosensitive resin layer deposited on one of the two wafers before both wafers are glued to each other. The combination of these transparent materials with conventional polymers such as PDMS has also been demonstrated for transmission FTIR analysis. Some examples are given hereafter.![[thin space (1/6-em)]](https://www.rsc.org/images/entities/char_2009.gif) 000 nm, i.e. 25
000 nm, i.e. 25![[thin space (1/6-em)]](https://www.rsc.org/images/entities/char_2009.gif) 000 to 1000 cm−1, see Fig. 2). Nevertheless, this expensive material is extremely brittle and easily breakable, thus limiting the microfabrication processes.
000 to 1000 cm−1, see Fig. 2). Nevertheless, this expensive material is extremely brittle and easily breakable, thus limiting the microfabrication processes.
Direct printing of patterns on CaF2 substrates using laser or chemical etching has been demonstrated. In a typical experiment, a photoresist is used as an adhesive to bond the two substrates together.27,65 Recently, Lehmkuhl et al. have developed an etching process using soft lithography.66 However, the obvious disadvantage of this approach is that the substrate is permanently marked and therefore unsuitable for reuse.
Processes combining printed and adhesive surfaces were also developed. The idea is to create a microfluidic device built up with two structured layers deposited/engraved onto the surface of IR transparent crystals. Molten wax,28 negative epoxy photoresist67 or PDMS68,69 was used to create microfluidic devices dedicated to IR imaging and transmission measurements (Fig. 7). Nevertheless, the direct bonding of CaF2 wafers is not straightforward as noted by Grenci et al.70 In their study, the authors used a thin silica layer deposited onto the CaF2 substrate as a primer allowing improvement of the wafer adhesion. The induced limitation is that this strategy decreases the signal efficiency.
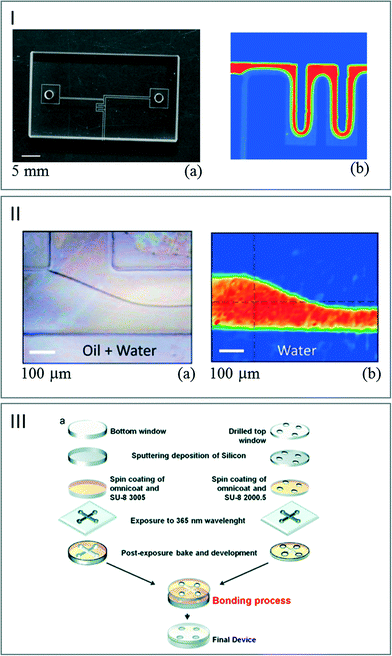 | ||
| Fig. 7 (I) (a) Photograph of a printed paraffin pattern on a CaF2 window. (b) FT-IR images of the flow pattern of water based on the absorbance of the band at 1350 cm−1 (adapted from ref. 28. Copyright 2010 RSC publications). (II) (a) Picture of the IR chip sealed with PDMS. (b) FT-IR images of the water flows generated at 3380 cm−1 (adapted from ref. 68. Copyright 2014 with permission from Elsevier). (III) (a) Scheme of the process used for sealing two CaF2 windows with SU8. (b) IR map of water flowing through the channel (adapted from ref. 70. Copyright 2014 RSC publications). | ||
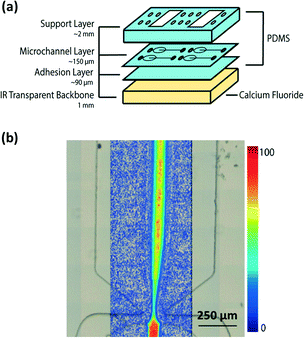 | ||
| Fig. 8 (a) Scheme of microchip PDMS assembly. (b) IR chemical mapping of a flow focusing of a 50 mM NaN3 solution in H2O by following the azide vibrational band at ν = 2040 cm−1 (adapted with permission from ref. 71. Copyright 2013 American Chemical Society). | ||
Infrared surface analysis (ATR)
When considering the ATR-FTIR mode, the infrared beam passes through an element with a high refractive index (ATR crystal) such as silicon or diamond. The internal reflection of the beam within the crystal creates evanescent waves at the interface between the ATR crystal and the medium to be analyzed. This interaction permits the detection of molecules at a distance of up to a few microns from the crystal surface. This technique is perfectly adapted to shallow microchannels probing. Therefore, its combination with microfluidics devices for imaging has been already demonstrated several times.72For instance, solutions containing (bio)molecules of interest were deposited on an infrared transparent surface. The sample holder consists of a thin layer of PDMS73 or photoresist74 coupled with CaF2 windows. The evolution of living cells or chemical reactions can be monitored through the temporal evolution of the FTIR spectra. However, such approaches were only demonstrated for stop flow studies.
Jensen et al. have described the use of a silicon based reactor coupled with FTIR.75 This pioneer work used standard microfabrication and selective etching techniques. The use of a silicon substrate offers a large range of surface functionalization possibilities leading to a plethora of applications. The geometry and the dimensions of the reactor provide ways to probe both the liquid phase and the chemicals linked to the surface.
Kazarian et al. have developed a device to perform ATR-FTIR spectroscopic imaging of continuous flow reactions. The authors have associated a PDMS top layer in which microchannels are designed and an ATR crystal allowing imaging of the sample flow into a microfluidic device.76Fig. 9a illustrates the schematic diagram of two inlets connected to a serpentine microchannel. They were able to monitor the mixing of a D2O flow with H2O in a Y-shaped contacting mixer by performing independent analyses (Fig. 9b and c). This method demonstrates for the first time the fast acquisition of a spectral signature of chemicals flowing in a microfluidic channel.
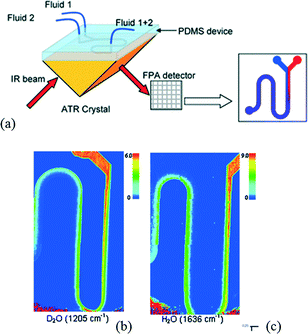 | ||
| Fig. 9 (a) Scheme of a microfluidic device coupled with ATR-FTIR imaging system. ATR-FTIR images of the microfluidic device with (b) D2O injected from the left of the Y junction and (c) water injected from the right of the Y junction (adapted from ref. 76. Copyright 2009 RSC publications). | ||
This technique was later exploited to monitor polymers or surfactants in solution. To reduce the risk of delamination of the [PDMS–ATR crystal] assembly, the use of an intermediate layer of cyclo-olefin polymer (COP) was also demonstrated to seal the channels.77
The spatial and temporal distributions of a bioreactive flow (bacteria) were also investigated using an open-channel FTIR approach.78 A 10 μm thick water layer was created by exploiting the hydrophilic character of a surface modified silicon chip. Mitomycin-C bacteria were placed in a laminar flow regime, allowing control of the aqueous environment. Coupling this original device with a synchrotron-radiation-based FTIR source led to the analysis of the formation of biofilms at the molecular level.
Advanced chemical processing techniques combining microreactors with several analytical probes constitute a convenient approach to monitor in situ chemical reactions as illustrated by Kumacheva et al. By combining an ATR crystal for FTIR analysis, a temperature probe and a pH probe, real-time information concerning the reaction kinetics of CO2 with a buffer system displaying therapeutic applications were obtained.79
Additionally, the recent development of advanced optical fibers offered the opportunity to investigate in situ chemical reactions in the mid-infrared. The Toledo Company proposed the flow cell ReactIR™ operating with an ATR technology.80 A prototype combining an ATR probing with a flow stream device was used by Gaunt et al. for real-time chemical reaction monitoring such as fluorination.81
Despite the interest in ATR technologies, these techniques suffer from a lack of global information. Indeed, only the volume close to the surface of the ATR crystal can be analyzed, reducing the efficiency of the characterization for inhomogeneous reactions. Besides, the technology is still very expensive, limiting its use as a routine technology.
Applications
Based on the recent developments of the coupling of microfluidics and FTIR technology mentioned in the previous sections, new routes for in situ characterization of microscale processes have been developed. Such approaches have provided insight into various different processes by allowing access to spatially resolved information, which can be later used for optimization and automation. We summarize in this section a few examples of microfluidic systems coupled to FTIR spectroscopy for various applications including chemical reaction monitoring, biology and pharmaceuticals.Chemistry
Microreactors are particularly useful for investigating hazardous reactions. Highly exothermic reactions such as Grignard reactions were performed in continuous modes, exploiting inline spectroscopic analysis.87 For instance, Jähnisch et al. have studied the reaction mechanism in the presence of unstable or explosive intermediates such as ozonides.88 In another example, the capability of microsystems to reach unconventional synthesis conditions was exploited by Jensen et al. by combining a high-pressure gas–liquid microreactor with an online ATR-FTIR spectroscopy technique and gas chromatography measurements to investigate the hydroformylation of 1-octadecene.89 A rapid screening of several experimental parameters provided an efficient kinetic analysis.
Another fundamental benefit of online FTIR analysis for chemistry is the ability to improve process optimization by allowing feedback control leading to fully automated approaches.90 This technology was in particular applied for the synthesis of 5-amino-4-cyano-1,2,3-triazoles.91 Similarly, the automated synthesis of oligonucleotides was performed by the introduction of real-time analysis systems.92
Eventually, scaling-up studies can largely benefit from integrated FTIR characterization techniques. This was demonstrated by Bakale et al. who reported the use of an online ReactIR system (Toledo) to improve and to scale up the heterogeneous hydrogenation of an aromatic nitro compound using the commercially available H-Cube system (Thalesnano Inc.).93
Since then, the coupling of ATR-FTIR and microfluidics has been used to monitor a total reaction. Namely, the neutralization of benzoate acid in decanol with disodium phosphate was investigated.42 This approach paves the way to the chemical reaction imaging as shown in Fig. 10.
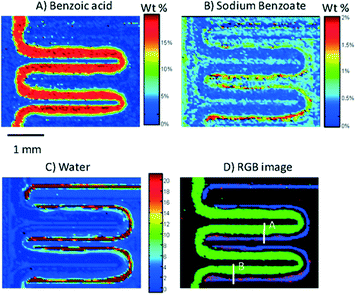 | ||
| Fig. 10 ATR-FTR image of a serpentine microchannel in which the neutralization of benzoic acid by mixing with disodium phosphate is monitored. It shows the concentration distribution of benzoic acid (A), sodium benzoate (B) and water (C) in the channel. (D) An RGB image showing the overlapped images of (A)–(C). Benzoic acid is presented in green, sodium benzoate is presented in red, and water is presented in blue (adapted from ref. 42. Copyright 2012, American Chemical Society). | ||
Biology
The high sensitivity towards analyte concentration offered by in situ FTIR analysis was exploited to study living entities99 or chemical tracers' migration. As an illustration, the detection of traces of sucrose liberated by enzymes was detected.100 The diagnosis metabolic profiling was also characterized.101
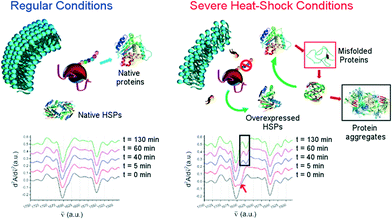 | ||
| Fig. 11 Top: illustration of a sudden heat-shock response in cell lines. Bottom: second derivatives at different sampled times within the 2 h of HS application in the spectral region 1750 and 1480 cm−1 (adapted with permission from ref. 110. Copyright 2015 American Chemical Society). | ||
Pharmaceutical drug investigations
Besides applications in chemical engineering and biology, the ultra-fast growth of microfluidics in pharmaceutical applications such as “drug-on-demand” could largely benefit from the implementation of FTIR spectroscopy techniques in microfluidic-based processes for drug synthesis monitoring,111 pharmaceutical formulation112 and drug release studies.113 As an example, Ewing et al. have recently combined ATR-FTIR imaging with a [ZnSe ATR crystal–PDMS microfluidic device] assembly (Fig. 12-I) to investigate drug release and crystallization from pharmaceutical formulations under flow conditions.114 Specifically, the authors investigated ibuprofen release and further crystallization from a polyethylene glycol (PEG)–sodium ibuprofen formulation in an aqueous medium at various pH.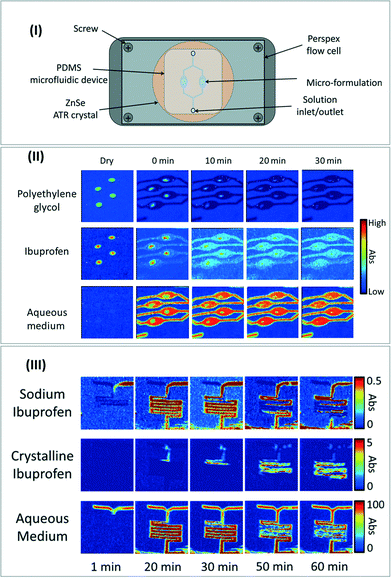 | ||
| Fig. 12 (I) Schematic of the experimental set-up for the coupling of microfluidic reactor with ATR-FTIR spectroscopic imaging measurement. (II) ATR-FTIR spectroscopic images showing the simultaneous dissolution of ibuprofen/PEG formulations in neutral solution. (III) ATR-FTIR spectroscopic images showing the precipitation of ibuprofen crystals in a microreactor with a pH of 1. All images adapted from ref. 114 with the permission of AIP Publishing. | ||
Owing to ATR-FTIR imaging in real time and to the specific absorption bands of water, ibuprofen and PEG, it was possible to follow the qualitative concentrations of each of these three components along the microreactor depending on the operating conditions. These experiments allow accessing the release mechanisms as a function of time and of pH (Fig. 12-II). Another interesting feature lies in the specific crystal structure of sodium ibuprofen, which exhibits a different IR spectrum compared to the dissolved ibuprofen. Taking advantage of this peculiarity, the authors were able to spatially image the crystallization of ibuprofen inside the microchannel following the mixing of an ibuprofen solution with an aqueous solution at pH = 1 (Fig. 12-III) to get insight into the crystallization process depending on pH conditions, time and location in the microreactor.
Challenges and opportunities
Microfluidic reactors coupled with FTIR spectroscopy present promising new tools for analytical sciences. Nevertheless, challenges still remain in the conception of the microsystems or the measurement efficiency. The following sections consider the future challenges and opportunities for (i) the microfabrication materials, (ii) the on-chip integrated light sources and sensors for developing compact systems, (iii) and the on-chip and potential applications of DRIFTS for catalytic reaction monitoring.Novel microfabrication materials and approaches
Concerning microfabrication approaches, lithography/etching techniques have already been adapted to several IR transparent materials such as CaF2.27,66,115 Nevertheless, the sealing/bonding of such materials remains complicated and generally required either intermediate material layers or high temperature (above 1000 °C) processing. Additionally, these materials are extremely brittle and fragile and are not therefore fully compatible with a wide range of applications. Therefore, new types of microfabrication materials with extended infrared transparency are needed and the particular case of specialty glasses based on chalcogenides,116 fluorides,117 phosphates118 or sulfides119 could constitute promising candidates as their composition can be widely modified to fit specifications, including UV-vis to IR transparency and chemical compatibility. Such glasses can be etched using dry or wet approaches. Further conventional bonding processes (glass–glass fusion/diffusion bonding or anodic bonding of glass to IR transparent silicon) could lead to robust FTIR compatible microdevices. Note that additional challenges might arise from these new types of materials so the mechanical properties should be carefully designed (thermal expansion coefficient, mechanical strength, etc.).Besides conventional top-down approaches based on photolithography–etching–bonding, another exciting area of development concerns 3D printing methods for microreactors.
The advantages of these new microfabrication facilities have been recently reviewed,120 and although most of the progress has been made using polymer materials, extension to glass or ceramics is currently under investigation.121 Such glass/ceramic 3D printers could largely benefit FTIR applications at small scales for addressing the current microfabrication process limitations mentioned above, while offering flexible 3D design opportunities. Note, however, that the resolution of such equipment is still too large for microfluidic applications (typically >100 μm) and developments have to be made in this direction to realize the promise of this new technology.
Integrated sources and sensors on chip
In this review, we focus attention on imaging or mapping with conventional external IR sources and spectrometers. Nevertheless, another strategy to interrogate a microflow aims at integrating miniaturized probes (optical fibers or waveguides) directly within the chip to access information at a single point with high precision.122 Although this strategy does not require the construction materials of the microreactor itself to be adapted, it is limited to single point analysis within the chip. This means that in order to obtain multiple information channels, arrays of probes have to be integrated. These in situ technological solutions for mid-IR spectroscopy on chip are based on the use of passive or doped fibers123–126 (also commercially available127) or waveguide128–130 sensors, which can be integrated directly within microreactors. The integrated probes are generally made from chalcogenide glasses,123,126,128,130–133 germanium,134 gallium arsenide or silver halides.135,136 Such strategies are of great interest for miniaturizing devices in order to provide compact detection sensing tools.For instance, V. Singh et al. have developed a microfluidic platform (Fig. 13a) equipped with a pedestal Si waveguide (Fig. 13b), an integrated light source and chalcogenide PbTe planar resonator sensors for mid-IR (λ >4.5 μm) chip sensing applications.137 Similarly, Chang et al. have developed a mid-IR germanium waveguide on a silicon substrate integrated in a microfluidic chip for cocaine detection at concentrations down to 100 μg mL−1 (Fig. 13c). The authors used an external light source and detector but the cocaine sensing is realized due to the presence of an integrated Ge waveguide directly within the microchannel where the fluid is flowing (Fig. 13d).138
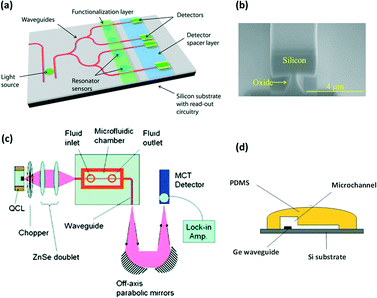 | ||
| Fig. 13 (a) Example of integrated waveguide, source and resonator sensor on chip. (b) SEM pictures of the pedestal Si waveguide developed for the chemical sensing of various molecules (adapted from ref. 137). (c) FTIR integrated microfluidic platform for cocaine detection in flow with (d) an integrated Ge waveguide positioned directly within a PDMS microchannel (adapted from ref. 138. Copyright 2012, RSC publications). | ||
Overall, the development of commercial fibers with integrated ATR crystal illustrates the promise of this technique. In situ characterizations constitute a key parameter in scaling up processes. The large progress in the development of optical fibers and their introduction into reactive media offers a new vision of industrial production.
Concerning microfluidics applications, in order to address the requirements for miniaturization and integration, another strategy consists of replacing the external excitation sources by rare earth (RE) ion-doped glass fibers generating light from UV to mid-IR, which provide low cost mid-IR sources. Such characteristics improve the ease of use and compactness.139 These RE fibre sources also meet the concerns of miniaturization and mechanical and chemical stability for integration into microreactors.140
DRIFTS for catalytic reaction monitoring
As mentioned in the previous section, DRIFTS, which is another FTIR mode - mostly used for powder characterization, has not yet been reported for microfluidic applications, given that the optical scattering phenomena taking place in DRIFT generally never occur in the conventional flat bottom microchannels.141 However, continuous (photo)catalytic reactions requiring a fixed packed bed on chip142,143 could possibly benefit from this approach in order to in situ monitor chemical transformations. Under flow conditions, a recent review has pointed out the advantages of this approach at larger scale,144 which could be easily adapted to heterogeneous microflow catalysis.Outlook
FTIR spectroscopy appears as a powerful non-invasive technique for in situ analysis in microreactors. This approach has proven its ability to address issues in various domains including chemistry, physics and biology from fundamental approaches to applied processes. The examples given above highlight the main interests and the scientific obstacles that still need to be overcome. Some strategies have been demonstrated to address part of the current limitations. For instance, the use of open channels or ATR-FTIR technologies allows addressing the water absorption problems in biological applications but cannot be extended to a wide range of continuous processes. Therefore, efforts have to be focused on the development of new materials constituting the microreactors for developing FTIR transmission modes. Meanwhile, the recent progress in the IR signal enhancement strategies (e.g. SEIRA) paves the road for a promising new tool in the field of microfluidics. Indeed, the introduction of plasmonic nanoantennas demonstrates their ability to increase the technique efficiency. However, the effective cost of integrated FTIR technology is still high due to the use of expensive materials for the device conception (CaF2, Al2O3, etc.) and the IR sources when considering synchrotron facilities. Nevertheless, we can expect that the field of FTIR-microfluidics analytical chemistry will be developed and expanded towards all-in-one labs on chip.Among other approaches, the coupling of FTIR analysis in microsystems with other in situ characterization techniques is very promising. Only rare examples exist in the literature given the complexity of multiple analytical technique implementation inside microdevices. However, it was demonstrated that multiple analysis of flow reaction and/or materials characterization can be highly beneficial, in particular in the case of multiphase reaction monitoring. For instance, besides the study of Ewing et al. (see previous section114), another recent example of Gross et al. demonstrates that it is possible to associate in situ FTIR analysis with X-ray microspectroscopy to analyze simultaneously the composition of the liquid phase (solvent, reagents, products) and of the catalyst in a multistep transformation inside a microflow process.145 Nevertheless, coupling FTIR with other techniques is not trivial, as the construction materials of the experimental cells hosting chemical phenomena and the spectra recording methods must be compatible and versatile. This remains a challenging field that may impact the development of microfluidic approaches (e.g. for synthesis approaches) in the future. However, in the case of vibrational techniques, it is worth the effort as IR spectroscopy is a highly selective analytical method that can efficiently probe chemical phenomena.
Acknowledgements
The authors acknowledge the French space agency CNES for “aide à la recherche” and the French Agence Nationale pour la Recherche (ANR) under Grant CGSμLAb No. ANR-12-SEED-0001. The financial support of the European Union is also acknowledged through the Photo4Future project, which has received funding from the European Union's Horizon 2020 research and innovation program under the Marie Sklodowska-Curie grant agreement No. 641861. The authors thank Fanny Oukhemanou and Thierry Tassaing for fruitful discussions.References
- P. J. Viskari and J. P. Landers, Electrophoresis, 2006, 27, 1797 CrossRef CAS PubMed
.
- R. L. Hartman and K. F. Jensen, Lab Chip, 2009, 9, 2495 RSC
.
- A. Abou-Hassan, O. Sandre and V. Cabuil, Angew. Chem., Int. Ed., 2010, 49, 6268 CrossRef CAS PubMed
.
- C. Rivet, H. Lee, A. Hirsch, S. Hamilton and H. Lu, Chem. Eng. Sci., 2011, 66, 1490 CrossRef CAS
.
- J. Wu and M. Gu, J. Biomed. Opt., 2011, 16, 080901 CrossRef PubMed
.
- P. M. Valencia, O. C. Farokhzad, R. Karnik and R. Langer, Nat. Nanotechnol., 2012, 7, 623 CrossRef CAS PubMed
.
- M. J. Baker, J. Trevisan, P. Bassan, R. Bhargava, H. J. Butler, K. M. Dorling, P. R. Fielden, S. W. Fogarty, N. J. Fullwood, K. A. Heys, C. Hughes, P. Lasch, P. L. Martin-Hirsch, B. Obinaju, G. D. Sockalingum, J. Sulé-Suso, R. J. Strong, M. J. Walsh, B. R. Wood, P. Gardner and F. L. Martin, Nat. Protoc., 2014, 9, 1771 CrossRef CAS PubMed
.
- K. F. Jensen, B. J. Reizman and S. G. Newman, Lab Chip, 2014, 14, 3206 RSC
.
-
T. Noël, Y. Su and V. Hessel, in Organometallic Flow Chemistry, ed. T. Noël, Springer International Publishing, Cham, 2016, pp. 1–41 Search PubMed
.
- T. Q. Chastek, K. Iida, E. J. Amis, M. J. Fasolka and K. L. Beers, Lab Chip, 2008, 8, 950 RSC
.
- F. Destremaut, J.-B. Salmon, L. Qi and J.-P. Chapel, Lab Chip, 2009, 9, 3289 RSC
.
- T. Beuvier, P. Kwasniesky, S. Marre, C. Lecoutre, Y. Garrabos, C. Aymonier, B. Calvignac and A. Gibaud, Lab Chip, 2015, 15, 2002 RSC
.
- G. Reithmaier, S. Lichtmannecker, T. Reichert, P. Hasch, K. Müller, M. Bichler, R. Gross and J. J. Finley, Sci. Rep., 2013, 3, 1901 CAS
.
- J. P. McMullen and K. F. Jensen, Org. Process Res. Dev., 2011, 15, 398 CrossRef CAS
.
- G. Ryu, J. Huang, O. Hofmann, C. A. Walshe, J. Y. Y. Sze, G. D. McClean, A. Mosley, S. J. Rattle, J. C. deMello, A. J. deMello and D. D. C. Bradley, Lab Chip, 2011, 11, 1664 RSC
.
- J. Yue, J. C. Schouten and T. A. Nijhuis, Ind. Eng. Chem. Res., 2012, 51, 14583 CrossRef CAS
.
- J. W. Parks, M. A. Olson, J. Kim, D. Ozcelik, H. Cai, R. Carrion Jr., J. L. Patterson, R. A. Mathies, A. R. Hawkins and H. Schmidt, Biomicrofluidics, 2014, 8, 054111 CrossRef CAS PubMed
.
- F. Lefèvre, P. Juneau and R. Izquierdo, Sens. Actuators, B, 2015, 221, 1314 CrossRef
.
- J. Yue, F. H. Falke, J. C. Schouten and T. A. Nijhuis, Lab Chip, 2013, 13, 4855 RSC
.
- L. Chen and J. Choo, Electrophoresis, 2008, 29, 1815 CrossRef CAS PubMed
.
- A. März, T. Henkel, D. Cialla, M. Schmitt and J. Popp, Lab Chip, 2011, 11, 3584 RSC
.
- N. Liu, C. Aymonier, C. Lecoutre, Y. Garrabos and S. Marre, Chem. Phys. Lett., 2012, 551, 139 CrossRef CAS
.
- S. Dochow, M. Becker, R. Spittel, C. Beleites, S. Stanca, I. Latka, K. Schuster, J. Kobelke, S. Unger, T. Henkel, G. Mayer, J. Albert, M. Rothhardt, C. Krafft and J. Popp, Lab Chip, 2013, 13, 1109 RSC
.
- C. Delhaye, J. L. Bruneel, D. Talaga, M. Guirardel, S. Lecomte and L. Servant, J. Phys. Chem. C, 2012, 116, 5327 CAS
.
- E. Prado, A. Colin, L. Servant and S. Lecomte, J. Phys. Chem. C, 2014, 118, 13965 CAS
.
- J. Haas and B. Mizaikoff, Annu. Rev. Anal. Chem., 2016, 9, 45–68 CrossRef PubMed
.
- T. Pan, R. T. Kelly, M. C. Asplund and A. T. Woolley, J. Chromatogr. A, 2004, 1027, 231 CrossRef CAS PubMed
.
- K. L. A. Chan, X. Niu, A. J. de Mello and S. G. Kazarian, Lab Chip, 2010, 10, 2170 RSC
.
- C. Wagner, W. Buchegger, M. Vellekoop, M. Kraft and B. Lendl, Anal. Bioanal. Chem., 2011, 400, 2487 CrossRef CAS PubMed
.
- D. P. Kise, D. Magana, M. J. Reddish and R. B. Dyer, Lab Chip, 2014, 14, 584 RSC
.
- C. Berthomieu and R. Hienerwadel, Photosynth. Res., 2009, 101, 157 CrossRef CAS PubMed
.
- R. G. Brereton, Analyst, 1987, 112, 1635–1657 RSC
.
- G. B. K. Loutherback, L. Chen and H.-Y. N. Holman, Protein Pept. Lett., 2016, 23, 273 CrossRef PubMed
.
- M. J. Fuerstman, A. Lai, M. E. Thurlow, S. S. Shevkoplyas, H. A. Stone and G. M. Whitesides, Lab Chip, 2007, 7, 1479 RSC
.
- D. M. Roessler, Br. J. Appl. Phys., 1965, 16, 1119 CrossRef CAS
.
- K. Yamamoto, A. Masui and H. Ishida, Appl. Opt., 1994, 33, 6285 CrossRef CAS PubMed
.
-
P. R. Griffiths, Diffuse Reflectance Spectroscopy, in Handbook of Vibrational Spectroscopy (Volume 2), ed. J. M. Chalmers and P. R. Griffiths, Wiley, Chichester, England, 2002 Search PubMed
.
- M. B. Mitchell, in Structure–Property Relations in Polymers, American Chemical Society, 1993, ch. 13, vol. 236, pp. 351–375 Search PubMed.
- S. Marre, A. Adamo, S. Basak, C. Aymonier and K. F. Jensen, Ind. Eng. Chem. Res., 2010, 49, 11310 CrossRef CAS
.
- The Reynolds number is defined as the ratio of inertial forces to viscous forces and consequently quantifies the relative importance of these two types of forces for given flow conditions. It is defined by
 , where ρ is the fluid density (kg m−3), v is the fluid velocity (m s−1), d is the typical dimension of the channel (m) and η is the fluid viscosity (Pa s).
 - N. Nam-Trung and W. Zhigang, J. Micromech. Microeng., 2005, 15, R1 CrossRef
.
- K. L. A. Chan and S. G. Kazarian, Anal. Chem., 2012, 84, 4052 CrossRef CAS PubMed
.
- T. M. Floyd, M. A. Schmidt and K. F. Jensen, Ind. Eng. Chem. Res., 2005, 44, 2351 CrossRef CAS
.
- S. Lepinay, A. Staff, A. IIanoul and J. Albert, Biosens. Bioelectron., 2014, 52, 337 CrossRef CAS PubMed
.
- R. Keoschkerjan, M. Richter, D. Boskovic, F. Schnürer and S. Löbbecke, Chem. Eng. J., 2004, 101, 469 CrossRef CAS
.
- W. Buchegger, C. Wagner, B. Lendl, M. Kraft and M. J. Vellekoop, Microfluid. Nanofluid., 2011, 10, 889 CrossRef CAS
.
- W. Buchegger, C. Wagner, P. Svasek, B. Lendl, M. Kraft and M. J. Vellekoop, Sens. Actuators, B, 2011, 159, 336 CrossRef CAS
.
- P. Hinsmann, M. Haberkorn, J. Frank, P. Svasek, M. Harasek and B. Lendl, Appl. Spectrosc., 2001, 55, 241 CrossRef CAS
.
- P. Hinsmann, J. Frank, P. Svasek, M. Harasek and B. Lendl, Lab Chip, 2001, 1, 16 RSC
.
- K. L. A. Chan and S. G. Kazarian, Analyst, 2013, 138, 4040 RSC
.
- E. J. Marcsisin, C. M. Uttero, M. Miljkovi and M. Diem, Analyst, 2010, 135, 3227 RSC
.
- E. J. Marcsisin, C. M. Uttero, A. I. Mazur, M. Miljkovi, B. Bird and M. Diem, Analyst, 2012, 137, 2958 RSC
.
- P. Svasek, E. Svasek, B. Lendl and M. Vellekoop, Sens. Actuators, A, 2004, 115, 591 CrossRef CAS
.
- S. G. Kazarian and K. L. A. Chan, Analyst, 2013, 138, 1940 RSC
.
- M. K. Kuimova, K. L. A. Chan and S. G. Kazarian, Appl. Spectrosc., 2009, 63, 164 CrossRef CAS PubMed
.
- B. D. Piorek, S. Joon Lee, J. G. Santiago, M. Moskovit, S. Banerjee and C. D. Meinhart, Proc. Natl. Acad. Sci. U. S. A., 2007, 104, 18898 CrossRef CAS PubMed
.
- K. Loutherback, L. Chen and H.-Y. N. Holman, Anal. Chem., 2015, 87, 4601 CrossRef CAS PubMed
.
- S. Lal, N. K. Grady, J. Kundu, C. S. Levin, J. B. Lassiter and N. J. Halas, Chem. Soc. Rev., 2008, 37, 898 RSC
.
- E. Li, X. Chong, F. Ren and A. X. Wang, Opt. Lett., 2016, 41, 1913 CrossRef PubMed
.
- C.-K. Chen, M.-H. Chang, H.-T. Wu, Y.-C. Lee and T.-J. Yen, Biosens. Bioelectron., 2014, 60, 343 CrossRef CAS PubMed
.
- R. Adato and H. Altug, Nat. Commun., 2013, 4, 2154 Search PubMed
.
- O. Limaj, D. Etezadi, N. J. Wittenberg, D. Rodrigo, D. Yoo, S.-H. Oh and H. Altug, Nano Lett., 2016, 16, 1502 CrossRef CAS PubMed
.
- R. J. Jackman, T. M. Floyd, M. A. Schmidt and K. F. Jensen, Micro Total Analysis Systems, 2000, p. 155 Search PubMed.
- K. F. Jensen, MRS Bull., 2006, 31, 101 CrossRef CAS
.
- G. Birarda, G. Grenci, L. Businaro, B. Marmiroli, S. Pacor and L. Vaccari, Microelectron. Eng., 2010, 87, 806 CrossRef CAS
.
- B. Lehmkuhl, S. D. Noblitt, A. T. Krummel and C. S. Henry, Lab Chip, 2015, 15, 4364 RSC
.
- S. Kulka, N. Kaun, J. R. Baena, J. Frank, P. Svasek, D. Moss, M. J. Vellekoop and B. Lendl, Anal. Bioanal. Chem., 2004, 378, 1735 CrossRef CAS PubMed
.
- E. Polshin, B. Verbruggen, D. Witters, B. Sels, D. De Vos, B. Nicolaï and J. Lammertyn, Sens. Actuators, B, 2014, 196, 175 CrossRef CAS
.
- B. J. Lehmkuhl, S. D. Noblitt, A. T. Krummel and C. S. Henry, 18th International conference on miniaturized systems for chemistry and life sciences, Micro Total Analysis Systems, 2014, pp. 2318–2320 Search PubMed.
- E. Mitri, G. Birarda, L. Vaccari, S. Kenig, M. Tormena and G. Grenci, Lab Chip, 2014, 14, 210 RSC
.
- M. V. Barich and A. T. Krummel, Anal. Chem., 2013, 85, 10000 CrossRef CAS PubMed
.
- E. Karabudak, Electrophoresis, 2014, 35, 236 CrossRef CAS PubMed
.
- S. G. Kazarian, Anal. Bioanal. Chem., 2007, 388, 529 CrossRef CAS PubMed
.
- R.-T. Yamaguchi, A. Hirano-Iwata, Y. Kimura, M. Niwano, K. Miyamoto, H. Isoda and H. Miyazaki, J. Appl. Physiol., 2009, 105, 024701 CrossRef
.
- R. Herzig-Marx, K. T. Queeney, R. J. Jackman, M. A. Schmidt and K. F. Jensen, Anal. Chem., 2004, 76, 6476 CrossRef CAS PubMed
.
- K. L. A. Chan, S. Gulati, J. B. Edel, A. J. de Mello and S. G. Kazarian, Lab Chip, 2009, 9, 2909 RSC
.
- J. Greener, B. Abbasi and E. Kumacheva, Lab Chip, 2010, 10, 1561 RSC
.
- H.-Y. N. Holman, R. Miles, Z. Hao, E. Wozei, L. M. Anderson and H. Yang, Anal. Chem., 2009, 81, 8564 CrossRef CAS PubMed
.
- J. Greener, E. Tumarkin, M. Debono, C.-H. Kwan, M. Abolhasani, A. Guenther and E. Kumacheva, Analyst, 2012, 137, 444 RSC
.
-
http://us.mt.com/us/en/home.html- access on July 2016
.
- C. F. Carter, H. Lange, S. V. Ley, I. R. Baxendale, B. Wittkamp, J. G. Goode and N. L. Gaunt, Org. Process Res. Dev., 2010, 14, 393 CrossRef CAS
.
- D. Webb and T. F. Jamison, Chem. Sci., 2010, 1, 675 RSC
.
- D. T. McQuade and P. H. Seeberger, J. Org. Chem., 2013, 78, 6384 CrossRef CAS PubMed
.
- W. Ferstl, T. Klahn, W. Schweikert, G. Billeb, M. Schwarzer and S. Loebbecke, Chem. Eng. Technol., 2007, 30, 370 CrossRef CAS
.
- Z. Qian, I. R. Baxendale and S. V. Ley, Chem. – Eur. J., 2010, 16, 12342 CrossRef CAS PubMed
.
- M. Rueping, T. Bootwicha and E. Sugiono, J. Org. Chem., 2012, 8, 300 CAS
.
- T. Brodmann, P. Koos, A. Metzger, P. Knochel and S. V. Ley, Org. Process Res. Dev., 2012, 16, 1102 CrossRef CAS
.
- N. Steinfeldt, U. Bentrup and K. Jähnisch, Ind. Eng. Chem. Res., 2010, 49, 72 CrossRef CAS
.
- J. Keybl and K. F. Jensen, Ind. Eng. Chem. Res., 2011, 50, 11013 CrossRef CAS
.
- H. Lange, C. F. Carter, M. D. Hopkin, A. Burke, J. G. Goode, I. R. Baxendale and S. V. Ley, Chem. Sci., 2011, 2, 765 RSC
.
- C. J. Smith, N. Nikbin, S. V. Ley, H. Lange and I. R. Baxendale, Org. Biomol. Chem., 2011, 9, 1938 CAS
.
- J. W. Rydzak, D. E. White, C. Y. Airiau, J. T. Sterbenz, B. D. York, D. J. Clancy and Q. Dai, Org. Process Res. Dev., 2015, 19, 203 CrossRef CAS
.
- J. Chen, K. Przyuski, R. Roemmele and R. P. Bakale, Org. Process Res. Dev., 2014, 18, 1427 CrossRef CAS
.
- T. Tuercke, W. Schweikert, D. Boškovic, H. Krause and S. Loebbecke, Micro Total Analysis Systems, 2001, p. 581 Search PubMed.
- J. Antes, D. Boskovic, H. Krause, S. Loebbecke, N. Lutz, T. Tuerck and W. Schweikert, Trans. IChemE, 2003, 81, 760 CrossRef CAS
.
- E. Kauffmann, N. C. Darnton, R. H. Austin, C. Batt and K. Gerwert, Proc. Natl. Acad. Sci. U. S. A., 2001, 98, 6646 CrossRef CAS PubMed
.
- M. Kakuta, P. Hinsmann, A. Manz and B. Lendl, Lab Chip, 2003, 3, 82 RSC
.
- D. Prim, S. Crelier and J.-M. Segura, Chimia, 2011, 65, 815 CrossRef CAS PubMed
.
- Z. Wang, D. Voicu, L. Tang, W. Li and E. Kumacheva, Lab Chip, 2015, 15, 2110 RSC
.
- B. Lendl, R. Schindler, J. Frank, R. Kellner, J. Drott and T. Laurell, Anal. Chem., 1997, 69, 2877 CrossRef CAS PubMed
.
- C. D. Mansfield, A. Man and R. A. Shaw, IEE Proc.: Nanobiotechnol., 2006, 153, 74 CrossRef CAS PubMed
.
- H.-Y. N. Holman, H. A. Bechtel, Z. Hao and M. C. Martin, Anal. Chem., 2010, 82, 8757 CrossRef CAS PubMed
.
- M. J. Tobin, L. Puskar, R. L. Barber, E. C. Harvey, P. Heraud, B. R. Wood, K. R. Bambery, C. T. Dillon and K. L. Munro, Vib. Spectrosc., 2010, 53, 34 CrossRef CAS
.
- L. Vaccari, G. Birarda, G. Grenci, S. Pacor and L. Businaro, J. Phys.: Conf. Ser., 2012, 359, 012007 CrossRef
.
- K. Loutherback, G. Birarda, L. Chen and H.-Y. N. Holman, Protein Pept. Lett., 2016, 23, 273 CrossRef CAS PubMed
.
- G. Birarda, G. Grenci, L. Businaro, B. Marmiroli, S. Pacor, F. Piccirilli and L. Vaccari, Vib. Spectrosc., 2010, 53, 6 CrossRef CAS
.
- G. Birarda, G. Grenci and L. Vaccari, Microscopy: Science, Technology, Applications and Education, 2010, vol. 422 Search PubMed.
- L. Vaccari, G. Birarda, L. Businaro, S. Pacor and G. Grenci, Anal. Chem., 2012, 84, 4768 CrossRef CAS PubMed
.
- G. Birarda, D. E. Bedolla, E. Mitri, S. Pacor, G. Grenci and L. Vaccari, Analyst, 2014, 139, 3097 RSC
.
- E. Mitri, S. Kenig, G. Coceano, D. E. Bedolla, M. Tormen, G. Grenci and L. Vaccari, Anal. Chem., 2015, 87, 3670 CrossRef CAS PubMed
.
- S. Mascia, P. L. Heider, H. Zhang, R. Lakerveld, B. Benyahia, P. I. Barton, R. D. Braatz, C. L. Cooney, J. M. B. Evans, T. F. Jamison, K. F. Jensen, A. S. Myerson and B. L. Trout, Angew. Chem., Int. Ed., 2013, 52, 12359 CrossRef CAS PubMed
.
- J. Thiele, M. Windbergs, A. R. Abate, M. Trebbin, H. C. Shum, S. Forster and D. A. Weitz, Lab Chip, 2011, 11, 2362 RSC
.
- B. Herranz-Blanco, L. R. Arriaga, E. Makila, A. Correia, N. Shrestha, S. Mirza, D. A. Weitz, J. Salonen, J. Hirvonen and H. A. Santos, Lab Chip, 2014, 14, 1083 RSC
.
- A. V. Ewing, G. S. Clarke and S. G. Kazarian, Biomicrofluidics, 2016, 10, 024125 CrossRef PubMed
.
- P. Lorenz, M. Ehrhardt and K. Zimmer, Appl. Surf. Sci., 2013, 265, 648 CrossRef CAS
.
- A. R. Hilton, Appl. Opt., 1966, 5, 1877 CrossRef CAS PubMed
.
- M. Robinson, R. C. Pastor, R. R. Turk, D. P. Devor, M. Braunstein and R. Braunstein, Mater. Res. Bull., 1980, 15, 735 CrossRef CAS
.
- R. Stępień, M. Franczyk, D. Pysz, I. Kujawa, M. Klimczak and R. Buczyński, Materials, 2014, 7, 4723 CrossRef
.
- C. M. Bledt, J. E. Melzer and J. A. Harrington, Opt. Mater. Express, 2013, 3, 1397 CrossRef
.
- N. Bhattacharjee, A. Urrios, S. Kanga and A. Folch, Lab Chip, 2016, 16, 1720 RSC
.
- https://www.technologyreview.com/s/540926/3-d-printing-breaks-the-glass-barrier/- access on July 2016.
- K. Choi, J. M. Mudrik and A. R. Wheeler, Anal. Bioanal. Chem., 2015, 407, 7467 CrossRef CAS PubMed
.
- J. S. Sanghera, L. B. Shaw and I. D. Aggarwal, IEEE J. Sel. Top. Quantum Electron., 2009, 15, 114 CrossRef CAS
.
- B. Bureau, C. Boussard, S. Cui, R. Chahal, M. L. Anne, V. Nazabal, O. Sire, O. Loreal, P. Lucas, V. Monbet, J. L. Doualan, P. Camy, H. Tariel, F. Charpentier, L. Quetel, J. L. Adam and J. Lucas, Opt. Eng., 2014, 53, 7 CrossRef
.
- R. Lu, W. W. Li, A. Katzir, Y. Raichlin, H. Q. Yu and B. Mizaikoff, Analyst, 2015, 140, 765 RSC
.
- R. Chahal, F. Starecki, C. Boussard-Plédel, J.-L. Doualan, K. Michel, L. Brilland, A. Braud, P. Camy, B. Bureau and V. Nazabal, Sens. Actuators, B, 2016, 229, 209 CrossRef CAS
.
- http://www.diafir.com/- access on July 2016.
- J. Charrier, M. L. Brandily, H. Lhermite, K. Michel, B. Bureau, F. Verger and V. Nazabal, Sens. Actuators, B, 2012, 173, 468 CrossRef CAS
.
- V. Singh, P. T. Lin, N. Patel, H. T. Lin, L. Li, Y. Zou, F. Deng, C. Y. Ni, J. J. Hu, J. Giammarco, A. P. Soliani, B. Zdyrko, I. Luzinov, S. Novak, J. Novak, P. Wachtel, S. Danto, J. D. Musgraves, K. Richardson, L. C. Kimerling and A. M. Agarwal, Sci. Technol. Adv. Mater., 2014, 15, 014603 CrossRef
.
- P. Ma, D.-Y. Choi, Y. Yu, Z. Yang, K. Vu, N. Thach, A. Mitchell, B. Luther-Davies and S. Madden, Opt. Express, 2015, 23, 19969 CrossRef PubMed
.
- A. Ganjoo, H. Jain, C. Yu, J. Irudayaraj and C. G. Pantano, J. Non-Cryst. Solids, 2008, 354, 2757 CrossRef CAS
.
- M. L. Anne, J. Keirsse, V. Nazabal, K. Hyodo, S. Inoue, C. Boussard-Pledel, H. Lhermite, J. Charrier, K. Yanakata, O. Loreal, J. Le Person, F. Colas, C. Compere and B. Bureau, Sensors, 2009, 9, 7398 CrossRef CAS PubMed
.
- F. Starecki, F. Charpentier, J. L. Doualan, L. Quetel, K. Michel, R. Chahal, J. Troles, B. Bureau, A. Braud, P. Camy, V. Moizan and V. Nazabal, Sens. Actuators, B, 2015, 207, 518 CrossRef CAS
.
- Y.-C. Chang, P. Wagli, V. Paeder, A. Homsy, L. Hvozdara, P. van der Wal, J. Di Francesco, N. F. de Rooij and H. Peter Herzig, Lab Chip, 2012, 12, 3020 RSC
.
- O. Eyal, V. Scharf, S. Shalem and A. Katzir, Opt. Lett., 1996, 21, 1147 CrossRef CAS PubMed
.
- C. Charlton, A. Katzir and B. Mizaikoff, Anal. Chem., 2005, 77, 4398 CrossRef CAS PubMed
.
- P. Tai Lin, V. Singh, J. Wang, H. Lin, J. Hu, K. Richardson, J. D. Musgraves, I. Luzinov, J. Hensley, L. C. Kimerling and A. Agarwal, Opt. Mater. Express, 2013, 3, 1474 CrossRef
.
- Y.-C. Chang, P. Wagli, V. Paeder, A. Homsy, L. Hvozdara, P. van der Wal, J. Di Francesco, N. F. de Rooij and H. Peter Herzig, Lab Chip, 2012, 12, 3020–3023 RSC
.
- I. Kubat, C. Rosenberg Petersen, U. V. Møller, A. Seddon, T. Benson, L. Brilland, D. Méchin, P. M. Moselund and O. Bang, Opt. Express, 2014, 22, 3959 CrossRef CAS PubMed
.
- F. Starecki, S. Morais, R. Chahal, C. Boussard-Plédel, B. Bureau, F. Palencia, C. Lecoutre, Y. Garrabos, S. Marre and V. Nazabal, Int. J. Greenhouse Gas Control, 2016 Search PubMed
, Submitted.
-
C.-P. Sherman Hsu, Handbook of Instrumental Techniques for Analytical Chemistry, Prentice-Hall, New Jersey, 1997, vol. 262 Search PubMed
.
- M. W. Losey, M. A. Schmidt and K. F. Jensen, Ind. Eng. Chem. Res., 2001, 40, 2555–2562 CrossRef CAS
.
- E. Cao, G. Brett, P. J. Miedziak, J. M. Douthwaite, S. Barrass, P. F. McMillan, G. J. Hutchings and A. Gavriilidis, Catal. Today, 2016 DOI:10.1016/j.cattod.2016.06.007
.
- F. C. Meunier, React. Chem. Eng., 2016, 1, 134 CAS
.
- E. Gross, X.-Z. Shu, S. Alayoglu, H. A. Bechtel, M. C. Martin, F. D. Toste and G. A. Somorjai, J. Am. Chem. Soc., 2014, 136, 3624–3629 CrossRef CAS PubMed
.
| This journal is © The Royal Society of Chemistry 2016 |


