 Open Access Article
A flexible iron(II) complex in which zero-field splitting is resistant to structural variation†
Joseph M.
Zadrozny
a,
Samuel M.
Greer
bc,
Stephen
Hill
cd and
Danna E.
Freedman
*a
aDepartment of Chemistry, Northwestern University, Evanston, IL 60208, USA. E-mail: danna.freedman@northwestern.edu
bDepartment of Chemistry and Biochemistry, Florida State University, Tallahassee, FL 32306, USA
cNational High Magnetic Field Laboratory, Tallahassee, FL 32310, USA
dDepartment of Physics, Florida State University, Tallahassee, FL 32306, USA
First published on 19th October 2015
Abstract
The relationship between electronic structure and zero-field splitting dictates key design parameters for magnetic molecules. In particular, to enable the directed synthesis of new electronic spin based qubits, developing complexes where zero-field splitting energies are invariant to structural changes is a critical challenge. Toward those ends, we report three salts of a new compound, a four-coordinate iron(II) complex [Fe(C3S5)2]2− ([(18-crown-6)K]+ (1), Ph4P+ (2), Bu4N+ (3)) with a continuous structural variation in a single parameter, the dihedral angle (θd) between the two C3S52− ligands, as a function of counterion (θd = 89.98(4)° for 1 to 72.41(2)° for 3). Electron paramagnetic resonance data for 1–3 reveal zero-field splitting parameters that are unusually robust to the structural variation. Mössbauer spectroscopic measurements indicate that the structural variation in θd primarily affects the highest-energy 3d-orbitals (dxz and dyz) of the iron(II) ion. These orbitals have the smallest impact on the zero-field splitting parameters, thus the distortion has a minor effect on D and E. These results represent the first part of a directed effort to understand how spin state energies may be fortified against structural distortions for future applications of qubits in non-crystalline environments.
Introduction
The facile tunability of the magnetic properties of coordination complexes enables their future use for a number of applications, most prominently, quantum information processing (QIP).1 In QIP, the quantum properties of a species are harnessed for vital scientific challenges, including accurate simulation of quantum phenomena2 and the prediction of the folded conformations of proteins.3 Electronic spins show tremendous promise as qubits, the smallest units of a QIP system.4 Owing to their structural and electronic tunability, molecular electronic spins, particularly those of mononuclear transition metal complexes5 offer great potential.6,7Within the class of magnetic molecules, high-spin complexes provide an additional advantage, whereby the manifold of low-energy magnetic levels (MS levels), may allow for multiple transitions within a single molecule to serve as qubits.8 Electron paramagnetic resonance (EPR) techniques can be harnessed to create qubits from pairs of MS levels in transition metal complexes. In this context, high-spin species with S(2S + 1) potential MS pairs available as candidate qubits offer the greatest promise. Here, the uniqueness of transition energies between pairs of MS levels is vital to individual qubit manipulation. The zero-field splitting parameters D and E split the energies of the MS levels at zero applied magnetic field according to the magnitude of |MS| for each level. Thus, D and E ensure the singularity of each energy gap between MS levels under a nonzero magnetic field.
The magnitudes and signs of D and E are dependent on the ligand field, and therefore are easily tunable by coordination geometry. For example, distortions of homoleptic S = 3/2 four-coordinate cobalt(II) complexes from idealized Td to D2d, S4, or lower point-group symmetries generate a range of D values spanning nearly 100 cm−1 and rhombicity indices (E/D) over the entire allowed range of 0 to 0.33.9 Note, this sensitivity is not restricted to Kramers, or half integer systems; it also applies to non-Kramers or integer spin states. One clear illustration of this structure-function relationship is evident in the trigonal pyramidal S = 2 iron(II) complexes [(TPAR)Fe]− where small changes in the ligand field create a 40 cm−1 range in D and 6 cm−1 range in E.10
The tunability of zero-field splitting offers promise for the design of molecules with transitions of the desired energy and identity. Yet, considering the potential application of magnetic molecules for qubits, designing systems where subtle structural variations will maintain chemical uniformity is critical. Application of high-spin complexes to QIP will likely employ them in starkly different environments than well-characterized crystal structures. It is therefore of prime importance to locate spin and structure combinations with MS levels that do not appreciably change even with rather dramatic structural variation, as these will be most amenable to magnetic resonance-based QIP. Indeed, some implementations of QIP require surface isolation, where structural fluxionality is significant.11 Several notable species, including polynuclear Mn and Fe coordination clusters12 and mononuclear Tb complexes,13 display structural variation upon surfaces that significantly impact their MS and MJ levels. Unintended changes in values of MS (or MJ) and zero-field splitting shift the field and frequency required for manipulation. Further, the changes may impact the lifetimes of qubits formed from the MS (or MJ) pairs in addition to the time required for individual computational operations. In this context, the utility of structurally robust species, such as [Fe4(L)2(dpm)6],14 is noted. Here, variation in the molecular geometries at the surface are minimal and of little consequence to the magnetic properties.
Herein, we offer an alternative approach to overcoming this limitation: the development of design strategies for high-spin qubits that are electronically robust. In such a system, the allowed structural variations have little impact on the zero-field splitting parameters due to electronic rather than steric fortification. First and foremost, the formulation of such design principles requires building a comprehensive understanding of the impact of particular distortions on a given MS level manifold.
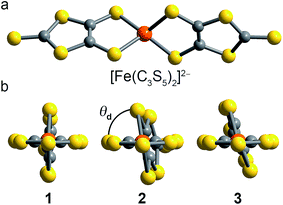
Toward that end, we focused our efforts on homoleptic pseudotetrahedral complexes featuring two planar, bidentate ligands. The dihedral angle between the two ligands can be singularly varied as a function of counterion, thereby allowing the study of the influence of structural variation on both D and E. In particular iron(II), with its anticipated S = 2 spin state, was selected to serve as an ideal spectroscopic handle to track the impact of the geometric changes on both the zero-field splitting and electronic environment. Iron offers the additional key advantage of Mössbauer activity, which enables complimentary electronic insight. We prepared and investigated three salts of the new complex [Fe(C3S5)2]2−: [(18c6)K]2[Fe(C3S5)2] (1), (Ph4P)2[Fe(C3S5)2] (2), and (Bu4N)2[Fe(C3S5)2] (3) (see Fig. 1). Magnetic and spectroscopic investigations of this series reveal unexpectedly resilient zero-field splitting values despite a substantial change to the coordination geometry of the iron(II) ion. These results represent a first step forward in the development of high spin species with zero-field splitting values stable to structural distortions.
Results and discussion
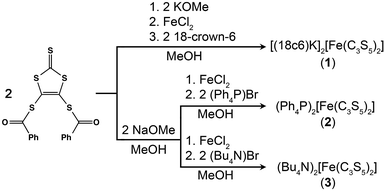
The syntheses of the new complexes 1–3 proceeded via salt metatheses of the sodium or potassium salts of 4,5-dimercapto-1,3-dithiole-2-thionate15 (C3S52−) with iron dichloride in organic solvents, as depicted in Scheme 1. Subsequent addition of 18-crown-6 (18c6), (Ph4P)Br, or (Bu4N)Br to the product enabled the isolation of 1–3 as dark red powders or microcrystalline solids which were readily purified by recrystallization. Single crystal X-ray diffraction studies revealed the structures depicted in Fig. 1, S1, and S2.† All [Fe(C3S5)2]2− complexes are four-coordinate with tetragonal elongations away from idealized tetrahedral geometry; specific structural metrics are provided in Table 1 and the ESI.† The Fe–S bond distances in 1–3 are extremely similar across the series and consistent with the mean Fe–S distance (2.31(7) Å) for reported mononuclear [FeIIS4] complexes of iron(II) in the Crystal Structure Database (CSD).16,17 The bite angles of the C3S52− ligands, as well as the Fe–S–Cα angles, are similarly invariant. In contrast, the variation in crystal packing forces from 1–3 induces a twist-like distortion of the C3S52− ligands (see Fig. 1). The dihedral angle (θd) between the C3S52− ligands ranges from 89.98(4)° in 1 to 81.38(2)° in 2 to 72.41(2)° in 3. Such singular modulation of a structural feature in the coordination environment of a series of transition metal complexes is uncommon. We attribute the demonstrated structural flexibility of the [Fe(C3S5)2]2− molecules to the low-coordinate nature of the iron(II) center and the planar bidentate ligands, which direct the system toward an idealized D2d symmetry. Note, while the structural variation alters the ligand field geometry, the ligand set remains constant. Thus, this series of structures enables a clean, controlled investigation of electronic and magnetic properties as a function of the dihedral angle.| 1 | 2 | 3 | |||||||||||||||||||||||||||||||||||||||||||||||||||||||||||||||||||||||||||||||||||||||||||||||||
|---|---|---|---|---|---|---|---|---|---|---|---|---|---|---|---|---|---|---|---|---|---|---|---|---|---|---|---|---|---|---|---|---|---|---|---|---|---|---|---|---|---|---|---|---|---|---|---|---|---|---|---|---|---|---|---|---|---|---|---|---|---|---|---|---|---|---|---|---|---|---|---|---|---|---|---|---|---|---|---|---|---|---|---|---|---|---|---|---|---|---|---|---|---|---|---|---|---|---|---|
| a Between sulphur atoms of differing C3S52− ligands. b Bite angle for C3S52− ligand. c Dihedral angle graphically depicted in Fig. 1. The planes constructed for the calculation contained the central iron atom and coordinated sulphur atoms. d Closest intermolecular distance; occurs as end-on interactions between terminal thione groups of the C3S52− ligands for 1–3. e Closest intermolecular distance. | |||||||||||||||||||||||||||||||||||||||||||||||||||||||||||||||||||||||||||||||||||||||||||||||||||
| Fe–Save (Å) | 2.350(1) | 2.340(8) | 2.347(8) | ||||||||||||||||||||||||||||||||||||||||||||||||||||||||||||||||||||||||||||||||||||||||||||||||
| S–Fe–S (°) | 121.60(5)a | 122.924(19)a | 134.00(2)a | ||||||||||||||||||||||||||||||||||||||||||||||||||||||||||||||||||||||||||||||||||||||||||||||||
| 119.61(6)a | 122.838(19)a | 124.75(2)a | |||||||||||||||||||||||||||||||||||||||||||||||||||||||||||||||||||||||||||||||||||||||||||||||||
| 116.53(6)a | 112.284(19)a | 109.45(2)a | |||||||||||||||||||||||||||||||||||||||||||||||||||||||||||||||||||||||||||||||||||||||||||||||||
| 114.95(5)a | 112.588(19)a | 106.50(2)a | |||||||||||||||||||||||||||||||||||||||||||||||||||||||||||||||||||||||||||||||||||||||||||||||||
| 93.19(6)b | 94.547(18)b | 93.18(2)b | |||||||||||||||||||||||||||||||||||||||||||||||||||||||||||||||||||||||||||||||||||||||||||||||||
| 92.96(6)b | 94.105(18)b | 92.93(2)b | |||||||||||||||||||||||||||||||||||||||||||||||||||||||||||||||||||||||||||||||||||||||||||||||||
| Fe–S–Cα (°) | 97.38(3) | 96.2(6) | 97.5(3) | ||||||||||||||||||||||||||||||||||||||||||||||||||||||||||||||||||||||||||||||||||||||||||||||||
| θ d (°) | 89.98(4) | 81.38(2) | 72.41(2) | ||||||||||||||||||||||||||||||||||||||||||||||||||||||||||||||||||||||||||||||||||||||||||||||||
| S⋯Sd (Å) | 4.148(3) | 4.127(2) | 4.152(4) | ||||||||||||||||||||||||||||||||||||||||||||||||||||||||||||||||||||||||||||||||||||||||||||||||
| Fe⋯Fee (Å) | 9.666(5) | 8.740(6) | 8.573(5) | ||||||||||||||||||||||||||||||||||||||||||||||||||||||||||||||||||||||||||||||||||||||||||||||||
We probed the magnetostructural correlation in 1–3 by concerted magnetometric and spectroscopic studies. Variable-field, variable-temperature magnetic susceptibility data collected on ground polycrystalline samples at Hdc = 1000 Oe of 1–3 yield room temperature χMT values of 3.12, 3.22, and 3.34 cm3 K mol−1 for 1, 2, and 3, respectively. These values are in accordance with S = 2 iron(II) ions with isotropic giso factors of 2.04, 2.07, and 2.11 for 1, 2, and 3 respectively (see Fig. S3†). The value of χMT remains constant with decreasing temperature, eventually dropping significantly below 40 K. The temperature dependence of χMT for a spin with nonzero D and E reflects the temperature-variant populations of the zero-field split MS levels. Accordingly, we employed the program DAVE 2.0 (ref. 18) to model the low-temperature downturn as a consequence of zero-field splitting (see Fig. S3†). We applied the following spin Hamiltonian to model the zero-field energies of the MS levels for 1–3, assuming a ground state spin of 2: Ĥ = DŜz2 + E(Ŝx2 − Ŝy2) + μ0μBg![[H with combining right harpoon above (vector)]](https://www.rsc.org/images/entities/b_i_char_0048_20d1.gif) ·Ŝ. Here, the zero-field splitting is parameterized in terms of axial (D) and transverse (E) zero-field splitting terms with Ŝ and Ŝi2 (i = x, y, and z) the spin operators, where μ0 is the vacuum permittivity, μB is the Bohr magnetron,
·Ŝ. Here, the zero-field splitting is parameterized in terms of axial (D) and transverse (E) zero-field splitting terms with Ŝ and Ŝi2 (i = x, y, and z) the spin operators, where μ0 is the vacuum permittivity, μB is the Bohr magnetron, ![[H with combining right harpoon above (vector)]](https://www.rsc.org/images/entities/b_i_char_0048_20d1.gif) the applied dc magnetic field, and g the isotropic g-factor. The best fits, averaged over data sets collected at 0.1, 0.5, and 1 T applied dc fields, provided g, D, and |E| values (Table 2). The parameters we obtained through this fit were extremely uniform across 1–3, with g values close to 2.05, D of ca. +5.8 cm−1 and nonzero |E| values of ca. 0.6 cm−1. The alternate explanation of the downturn, intermolecular coupling, is unlikely due to the combination of the long S⋯S and Fe⋯Fe distances observed in the single crystal structures, as well as the lack of significant intermolecular contacts between [Fe(C3S5)2]2− moieties (see Table 1).
the applied dc magnetic field, and g the isotropic g-factor. The best fits, averaged over data sets collected at 0.1, 0.5, and 1 T applied dc fields, provided g, D, and |E| values (Table 2). The parameters we obtained through this fit were extremely uniform across 1–3, with g values close to 2.05, D of ca. +5.8 cm−1 and nonzero |E| values of ca. 0.6 cm−1. The alternate explanation of the downturn, intermolecular coupling, is unlikely due to the combination of the long S⋯S and Fe⋯Fe distances observed in the single crystal structures, as well as the lack of significant intermolecular contacts between [Fe(C3S5)2]2− moieties (see Table 1).
| 1 | 2 | 3 | |||||||||||||||||||||||||||||||||||||||||||||||||||||||||||||||||||||||||||||||||||||||||||||||||
|---|---|---|---|---|---|---|---|---|---|---|---|---|---|---|---|---|---|---|---|---|---|---|---|---|---|---|---|---|---|---|---|---|---|---|---|---|---|---|---|---|---|---|---|---|---|---|---|---|---|---|---|---|---|---|---|---|---|---|---|---|---|---|---|---|---|---|---|---|---|---|---|---|---|---|---|---|---|---|---|---|---|---|---|---|---|---|---|---|---|---|---|---|---|---|---|---|---|---|---|
| a Reported errors in EPR parameters were estimated by variance in quality of the simulation of the 406.4 GHz spectrum and the resonant field vs. frequency plot as a function of parameter variance. b Determined by EPR. c Obtained from value of χMT at 300 K. d Determined by fits of variable-temperature, variable-field χMT data. Errors determined by averaging over the fits to data sets collected at 0.1, 0.5, and 1 T dc applied fields. | |||||||||||||||||||||||||||||||||||||||||||||||||||||||||||||||||||||||||||||||||||||||||||||||||||
| g x | 2.00(1) | 2.00(3) | 2.00(1) | ||||||||||||||||||||||||||||||||||||||||||||||||||||||||||||||||||||||||||||||||||||||||||||||||
| g y | 2.02(1) | 2.07(1) | 2.04(1) | ||||||||||||||||||||||||||||||||||||||||||||||||||||||||||||||||||||||||||||||||||||||||||||||||
| g z | 2.10(4) | 2.10(3) | 2.08(3) | ||||||||||||||||||||||||||||||||||||||||||||||||||||||||||||||||||||||||||||||||||||||||||||||||
| D (cm−1) | 5.21(3) | 5.35(5) | 5.61(9) | ||||||||||||||||||||||||||||||||||||||||||||||||||||||||||||||||||||||||||||||||||||||||||||||||
| E (cm−1) | 0.59(2) | 0.60(2) | 0.59(2) | ||||||||||||||||||||||||||||||||||||||||||||||||||||||||||||||||||||||||||||||||||||||||||||||||
| E/Db | 0.11 | 0.11 | 0.10 | ||||||||||||||||||||||||||||||||||||||||||||||||||||||||||||||||||||||||||||||||||||||||||||||||
| g iso | 2.04 | 2.07 | 2.11 | ||||||||||||||||||||||||||||||||||||||||||||||||||||||||||||||||||||||||||||||||||||||||||||||||
| g iso | 2.04(1) | 2.08(2) | 2.07(1) | ||||||||||||||||||||||||||||||||||||||||||||||||||||||||||||||||||||||||||||||||||||||||||||||||
| D (cm−1) | 5.6(1) | 6.5(3) | 5.5(2) | ||||||||||||||||||||||||||||||||||||||||||||||||||||||||||||||||||||||||||||||||||||||||||||||||
| |E|d (cm−1) | 0.5(3) | 0.7(2) | 0.7(1) | ||||||||||||||||||||||||||||||||||||||||||||||||||||||||||||||||||||||||||||||||||||||||||||||||
| δ (mm s−1) | 0.680(1) | 0.663(1) | 0.677(1) | ||||||||||||||||||||||||||||||||||||||||||||||||||||||||||||||||||||||||||||||||||||||||||||||||
| ΔEQ (mm s−1) | 4.326(2) | 4.283(1) | 4.330(1) | ||||||||||||||||||||||||||||||||||||||||||||||||||||||||||||||||||||||||||||||||||||||||||||||||
To better quantify the zero-field splitting across the structural range, we probed the molecules by high-field variable-frequency EPR spectroscopy.19 Spectra were acquired at 5 K on 1–3 at frequencies ranging from 50 to 419.2 GHz (see Fig. 2 and S4†). The spectra display a multitude of resonances that change position and intensity as a function of irradiating microwave frequency. The MS levels involved, and their separation at zero-field, govern the frequency and field at which a given resonance is observed. Note that EPR transitions are split by nonzero D and E terms into three separate transitions (x- y- and z-components), which are further impacted by anisotropy of the g factor. For an S = 2 system, these factors lead to complex spectra, as seen for 1–3. Thus, variable frequency analyses were crucial for accurate quantification of g, D, and E.
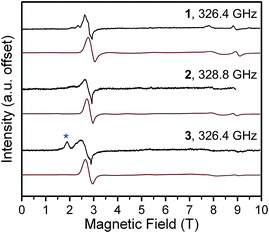 | ||
| Fig. 2 Select high-frequency, high-field EPR spectra for 1–3 at 5 K. Black lines correspond to experimental data collected at the frequencies listed on the graph. Red lines are simulations with parameters given in the main text and Table 2. The blue asterisk in the spectrum of 3 indicates a peak attributed to an impurity. | ||
To collect and analyze all of the different spectra, we created plots of resonance field vs. excitation frequency and incorporated the transitions from sixteen, thirteen, and ten different frequencies for 1, 2, and 3, respectively (see Fig. 3 and S5†). Each black diamond in these figures represents a field/frequency combination where a transition occurred, as determined through inspection of the raw data. The frequency dependences of the observed resonances were modeled for an S = 2 system with the same Hamiltonian used for the interpretation of the magnetic susceptibility data, except here we account for anisotropy in g with the g-tensor,  : Ĥ = DŜz2 + E(Ŝx2 − Ŝy2) + μ0μB
![[H with combining right harpoon above (vector)]](https://www.rsc.org/images/entities/b_i_char_0048_20d1.gif) ·
· ·Ŝ. The best models of the frequency dependences for 1–3 yielded positive D, nonzero E, and gx ≠ gy ≠ gz values (see Fig. 2, 3, S4, S5† and Table 2) similar to those obtained from magnetic susceptibility measurements. Further, these values are within the range of reported magnitudes by other high-frequency EPR studies of [FeIIS4] complexes.20
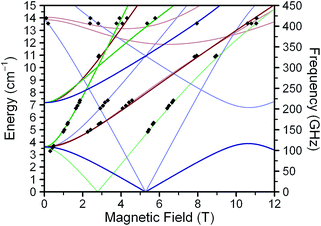 | ||
| Fig. 3 Resonance field vs. microwave frequency for 1 constructed from data (♦) obtained at 5 K. Solid lines represent fits to the data, with parameters as given in Table 2. Red, green, and blue lines represent x-, y-, and z-transitions, respectively. Bold lines represent ground-state MS = 0 → MS = ±1 transitions.21 Faded lines depict excited state transitions; those stemming from ca. 3.6 cm−1 correspond to excitations within the MS = ±1 doublet. Excited state transitions are shown if they correspond to observed signals. See ESI† for discussion of z-transitions (blue). | ||
The D and E parameters obtained from the foregoing analyses designate 1–3 as S = 2 species with ground MS = 0 levels, with the MS = ±1 levels ca. 5 cm−1 higher in energy and MS = ±2 levels at ca. 21 cm−1 (see Fig. S6†).21 The nonzero E terms in 1–3 mix the MS = ±1 levels, which causes them to split by 6E (ca. 3.6 cm−1) at zero field. The MS = ±2 levels are relatively less sensitive to E and split by ca. 3E2/D at zero field, which is ca. 0.2 cm−1 for 1–3. The applied frequencies of our investigations span excitations up to 14 cm−1 in energy. At the low temperatures of our measurements, the spectra are therefore predominantly indicative of the frequency dependences of the x-, y-, and z-components of the MS = 0 → MS = ±1 and intra-doublet MS = ±1 transitions. As we incorporated the resonances most sensitive to E in our fits, we expect very little uncertainty in our fit of E. We note that the simulated frequency dependences of the x-, y-, and z-transitions match the observed transitions closely, as do simulated spectra (Fig. 2, S4 and S5†). Further, variable-temperature spectra corroborate the positive D in our fitted model, as signals attributed to the lowest-energy MS = 0 level fade with increasing temperature while the MS = ±1 intra-doublet excited-state resonances intensify (see Fig. 4, S6†). We note that low temperature magnetization data collected on 1–3 are well-modeled by the g, D, and E values of the foregoing spectroscopic analyses (see Fig. S7†). Together, these observations lend confidence in the values obtained for 1–3. It is important to note that the level of analysis here is permitted solely by the use of high frequency EPR, as the evaluation of D and E from powder samples is difficult by magnetic susceptibility analysis. Indeed, this difficulty is evident in the large uncertainties of the parameters determined by the χMT fits. Further, our own attempts to obtain E from low-temperature magnetization data fits yielded no appreciable difference in fit quality for |E| values ranging from ≈1.4 to less than 0.01 cm−1. Thus, the foregoing analyses contrast the relative utility of high-frequency EPR vs. magnetization data in the fine-tuning of the MS levels of high-spin qubits.
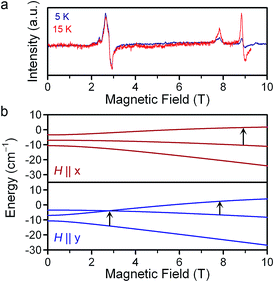 | ||
| Fig. 4 (a) Variable-temperature EPR spectra of 1 at 326.4 GHz applied microwave frequency. The intensities are normalized to that of the 3 T resonance. (b) Zeeman energy diagrams for the MS = 0, ±1 (ref. 21) levels with the applied dc field aligned with the x- and y-axes. Solid black arrows indicate the parentage of the observed resonances in (a). Full Zeeman diagrams are in Fig. S6.† | ||
To correlate the magnetic properties with electronic structure changes, we employed Mössbauer spectroscopy, which displays a marked sensitivity to electron density around a 57Fe nucleus.19b,22 In particular, we sought a deeper understanding of the robust zero-field splitting parameters as a function of the structural changes depicted in Fig. 1. All complexes feature well-resolved doublets at 80 K, with isomer shifts (δ) for 1–3 of 0.680(1), 0.663(1), and 0.677(1) mm s−1 (see Fig. 5 and Table 2). These values are similar to other four-coordinate iron(II) complexes of thiolate ligands,17b–d,23 and reflect a relatively covalent, electron-rich environment for the 57Fe nucleus. The quadrupole splittings, |ΔEQ|, for 1–3 are 4.326(1), 4.283(1), and 4.330(1) mm s−1 respectively, magnitudes which are appropriate for high-spin iron(II) complexes.23,24 This parameter is especially sensitive to asymmetry in the electron density around the 57Fe nucleus in high-spin iron(II) compounds, where the sixth d-electron is essentially superimposed on a spherical, half-filled d5 shell. Thus, ΔEQ readily detects distortions that shift the sixth electron between different orbitals, as can be the case in tetrahedral complexes.25 Importantly, however, we find only a minor change in both δ and ΔEQ from 1–3 and neither parameter trends with the variance in θd.
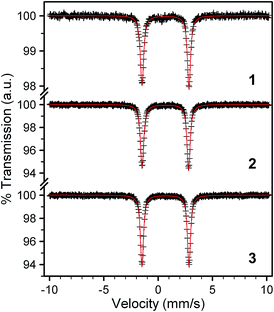 | ||
| Fig. 5 Mössbauer spectra for powder samples of 1–3 collected at 80 K. Black crosses represent experimental data while red lines represent the best fits to the spectra. The parameters for these fits are given in Table 2. | ||
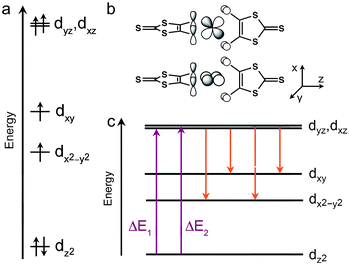
The similarity across 1–3 of both the Mössbauer and the zero-field splitting parameters can be understood through a simple molecular orbital (MO) picture. Derivation of such a model on the basis of experimental electronic absorption spectroscopy is complicated by the broad and intense absorptions of the C3S52− ligands.26 Fortuitously, we note the similarity of the coordination geometries of 1–3 to molecular models of the [FeII(S-Cys)4]2− sites in certain rubredoxin proteins.9,17b,c,f,23 Thus, we can construct a qualitative model for the purposes of discussion by connecting previously computed MOs for C3S52− (see Fig. 6)27 and experimental results for model complexes.23c,27 We pay particular attention to the sign of D, which here indicates that dz2 is the lowest energy d-orbital.20a The simplest starting point occurs for θd = 90°, as in 1. Here, the lowest energy dz2 orbital is followed by the dx2−y2 and dxy orbitals then the (dxz, dyz) pair. The dxz and dyz orbitals show appreciable overlap with the π-systems of the ligands (see Fig. 6b), in contrast to the dz2, dxy, and dx2−y2 orbitals, which interact indirectly with lone-pairs of the thiolate donor atoms.20a,23c Thus, we hypothesize that the change in θd from 1 to 3 most directly impacts the energies of the dxz and dyz orbitals.
The magnitude of ΔEQ increases in concert with rising anisotropy of the 57Fe 3d-electron density. High-spin iron(II), with 6 valence 3d-electrons, displays the spherical electron density of a half-filled d-shell overlaid with the contribution of one extra electron. Since each of the d-orbitals has its own inherent directionality, ΔEQ is sensitive to factors that affect the ground state orbital occupied by the 6th electron. The lack of an appreciable change in ΔEQ with θd therefore suggests that the distortion does not drastically affect the lower energy d orbitals in 1–3. Indeed, this hypothesis is consistent with the MO diagram in Fig. 6, where the variation in θd from 1 to 3 appears most influential to the highest-energy dxz and dyz orbitals due to appreciable overlap with the ligand π-system. A series of high spin iron(II) complexes bound to two planar, tridentate terpyridine-like ligands forms a nice counterexample.28 Here, a 30° change in θd induces a shift in ΔEQ from 0.75 to 3.58 mm s−1, nearly a factor of 60 greater range than in 1–3. The large change in ΔEQ for the former species versus1–3 likely stems from virtually degenerate dxz, dyz, and dxy orbitals imparted by a nearly octahedral geometry. In turn, small geometric changes adjust the orbital occupied by the 6th 3d electron and induce an electron density sensitive to small structural distortions. In contrast, ΔEQ is constant in 1–3 due to a structural change that exerts its maximal impact on higher energy orbitals.
The magnitudes and signs of D and E are crucially dependent on the energies of d–d excited states. Typically, three interactions dictate D and E (see Fig. 6c): the spin–orbit coupling between the ground electronic state and spin-allowed d–d excited states, then the spin–orbit coupling between the ground state and spin-forbidden d–d excited states, and finally spin–spin coupling between the unpaired 3d electrons. A contribution from a given excited state is stronger at lower energy, therefore contributions from spin-allowed transitions are generally taken to be more significant than the spin-forbidden transitions. Consideration of the spin-allowed transitions reveals contributions to D and E from only the excited states of dz2 → dxz and dz2 → dyz parentage (see ESI† for more details). Each contribution to D is equal and positive in magnitude. In the process of the twist distortion, the ground dz2 orbital is relatively unaffected while one of the dxz/dyz orbitals drops in energy and the other rises. Consequently, there is minimal change to the total spin-allowed contributions to D, in general agreement with our EPR data.
In contrast, the contribution to E from the dz2 → dxz state opposes that from the dz2 → dyz state. Therefore, where the dxz and dyz orbitals are degenerate, as expected for θd = 90°, E should be zero, as opposed to the results of our EPR analysis. An increase in θd would cause inequality in the π-interactions, leading to a splitting of the energies of the dxz and dyz orbitals. Thus, a steady increase in E would be expected due to incomplete cancelation of the two spin-allowed contributions, again in contrast with experimental data. These discrepancies highlight a more complex origin for E in 1–3 than spin-allowed contributions. The lack of dependence of E on the θd twist may suggest that spin-forbidden excited states and spin–spin coupling are the primary sources of rhombicity in 1–3. Interestingly, the Tanabe–Sugano diagram for tetrahedral d6 ions reveals low-lying triplet transition energies that are insensitive to modest changes in ligand field strength.29 This invariance may explain some of the insensitivity of D and E to the changes in the ligand field for 1–3 if spin-forbidden excitations are important therein. Indeed, targeting species where excited states are stable to changes in the ligand field strength may offer a path to the rational design of qubits where zero-field splitting is resistant to distortion. Ultimately, however, the origins of the nonzero E and the resilience of D and E to changes in θd remain perplexing questions that theory can hopefully address. The foregoing observations underline the importance of spin-forbidden and spin–spin contributions to D and E not only in [FeIIS4] moieties, but also systems for which there is no primary low-lying transition that dominates D and E.20a,23b,30
Together, the Mössbauer and EPR data suggest that the twist affects primarily higher-lying 3d orbitals. This scenario is fortuitous for the design of stable zero field splitting parameters, as the associated d–d transition states are of suppressed relevance in determining D and E. The 20° range in θd exhibited in 1–3 does not completely track the twist progression from the D2d geometry of 1 to the square planar D2h geometry corresponding to θd = 180°. Thus, upon initial inspection, the degree to which 1–3 survey the sensitivity of D and E to the twist distortion may appear truncated. However, considerable analysis of the stability of the S = 2 state as a function of structural variation in pseudotetrahedral iron(II) species revealed the stability of the S = 1 state in the D2h geometry.31 Indeed, magnetic analysis of the lone example in the CSD of a square planar iron(II) complex of bidentate dithiolate ligands revealed a S = 1 spin state.32 Here, the square planar geometry yields S = 1 state through strong dxy-thiolate interactions, which render the dxy orbital energetically inaccessible. A close inspection of the CSD entries for mononuclear, pseudotetrahedral high-spin [FeIIS4] complexes with bidentate ligands reveals θd angles between 84 and 90°. Thus, the range of θd which we are afforded in [Fe(C3S5)2]2− is likely limited by the stability of the S = 2 state, suggesting this series constitutes the representative range of accessible dihedral angles.
Outlook
Employing high spin molecules for quantum information processing may require isolation of the species in environments that differ from well-studied crystalline structures, for example, on surfaces,11 or in solution,33 where fluxionality is almost certain. For many complexes, such distortions unpredictably impact D and E, therefore hindering the viability of the system for QIP. Thus, the development of high spin molecules with robust zero-field splitting parameters would be of significant utility. The foregoing investigation represents the first such effort to find structural distortions that only weakly impact the zero-field splitting of a complex. Beyond the tremendous impact of this research on the rational design of molecules for QIP, developing an improved understanding of these structure/function relationships informs any structural EPR study. For example, the field of bioinorganic chemistry has achieved substantial insight via comparative analyses of EPR spectra of paramagnetic active sites and synthetic molecular mimics.34 Future research efforts will focus on distortions in other metal ions and oxidation states that affect predominantly the highest-energy d-orbitals. Of immediate interest are four-coordinate complexes of cobalt(II).35Acknowledgements
We thank Dr Johan Van Tol, Dr Andrew Ozarowski, Prof. T. David Harris, Prof. John Anderson, Ms Lakshmi Bhaskaran, and Ms Audrey Gallagher for insightful discussions and experimental assistance. We also thank Profs. Martin Kirk and James McCusker for invaluable and thoughtful ligand field discussion. We acknowledge support from Northwestern University, the International Institute for Nanotechnology, the State of Illinois (DCEO Award no. 10-203031), the United States Air Force (AOARD award no. 134031), and the National Science Foundation through award DMR-1309463 and a graduate research fellowship (S. M. G.; DGE-1449440). A portion of this work was performed at the National High Magnetic Field Laboratory, which is supported by an NSF Cooperative Agreement (DMR-1157490) and the state of Florida.Notes and references
- (a) M. A. Nielsen and I. L. Chuang, Quantum Computation and Quantum Information, Cambridge University Press, Cambridge, 10th anniversary edn, 2010 Search PubMed; (b) J. Stolze and D. Suter, Quantum Computing: A Short Course from Theory to Experiment, Wiley-VCH, Weinheim, 2nd edn, 2008 Search PubMed.
- (a) R. P. Feynman, Int. J. Theor. Phys., 1982, 21, 467–488 CrossRef; (b) S. Lloyd, Science, 1993, 273, 1073–1078 Search PubMed; (c) A. Aspuru-Guzik, A. D. Dutoi, P. J. Love and M. Head-Gordon, Science, 2005, 309, 1704–1707 CrossRef CAS PubMed.
- A. Perdomo-Ortiz, N. Dickson, M. Drew-Brook, G. Rose and A. Aspuru-Guzik, Sci. Rep, 2012, 2, 571 Search PubMed.
- (a) T. D. Ladd, F. Jelezko, R. Laflamme, Y. Nakamura, C. Monroe and J. L. O'Brien, Nature, 2010, 464, 45–53 CrossRef CAS PubMed; (b) J. J. L. Morton, D. R. McCamey, M. A. Eriksson and S. A. Lyon, Nature, 2011, 479, 345–353 CrossRef CAS PubMed; (c) D. D. Awschalom, L. C. Bassett, A. S. Dzurak, E. L. Hu and J. R. Petta, Science, 2013, 339, 1174–1179 CrossRef CAS PubMed; (d) R. J. Warburton, Nat. Mater., 2013, 12, 483–493 CrossRef CAS PubMed; (e) G. W. Morley, Electron Paramagn. Reson., 2015, 24, 62–76 CAS.
- (a) M. Warner, S. Din, I. S. Tupitsyn, G. W. Morley, A. M. Stoneham, J. A. Gardener, Z. Wu, A. J. Fisher, S. Heutz, C. W. M. Kay and G. Aeppli, Nature, 2013, 503, 504–508 CrossRef CAS PubMed; (b) M. J. Graham, J. M. Zadrozny, M. Shiddiq, J. S. Anderson, M. S. Fataftah, S. Hill and D. E. Freedman, J. Am. Chem. Soc., 2014, 136, 7623–7626 CrossRef CAS PubMed; (c) K. Bader, D. Dengler, S. Lenz, B. Endeward, S.-D. Jiang, P. Neugebauer and J. van Slageren, Nat. Commun., 2014, 5, 5304 CrossRef CAS PubMed; (d) J. M. Zadrozny, J. Niklas, O. Poluektov and D. E. Freedman, J. Am. Chem. Soc., 2014, 136, 15841–15844 CrossRef CAS PubMed.
- (a) M. Affronte, F. Troiani, A. Ghirri, A. Condini, M. Evangelisti, V. Corradini, S. Carretta, P. Santini, G. Amoretti, F. Tuna, G. Timco and R. E. P. Winpenny, J. Phys. D: Appl. Phys., 2007, 40, 2999–3004 CrossRef CAS; (b) G. Aromí, D. Aguilà, P. Gamez, F. Luis and O. Roubeau, Chem. Soc. Rev., 2012, 41, 537–546 RSC; (c) F. Troiani and M. Affronte, Chem. Soc. Rev., 2010, 40, 3119–3129 RSC.
- (a) S. C. Benjamin, A. Ardavan, G. A. D. Briggs, D. A. Britz, D. Gunlycke, J. Jefferson, M. A. G. Jones, D. F. Leigh, B. W. Lovett, A. N. Khlobystov, S. A. Lyon, J. J. L. Morton, K. Porfyrakis, M. R. Sambrook and A. M. Tyryshkin, J. Phys.: Condens. Matter, 2006, 18, S867–S883 CrossRef CAS; (b) K. Sato, S. Nakazawa, S. Nishida, R. D. Rahimi, T. Yoshino, Y. Morita, K. Toyota, D. Shiomi, M. Kitagawa and T. Takui, EPR of Free Radicals in Solids II, ed. A. Lund and M. Shiotani, Springer, 2nd edn, 2012, ch. 4, pp. 177–204 Search PubMed.
- M. Leuenberger and D. Loss, Nature, 2001, 410, 789–793 CrossRef CAS PubMed.
- (a) K. Fukui, H. Ohya-Nishiguchi and N. Hirota, Bull. Chem. Soc. Jpn., 1991, 64, 1205–1212 CrossRef CAS; (b) K. Fukui, N. Kojima, H. Ohya-Nishiguchi and N. Hirota, Inorg. Chem., 1992, 31, 1338–1344 CrossRef CAS; (c) K. Fukui, H. Masuda, H. Ohya-Nishiguchi and H. Kamada, Inorg. Chim. Acta, 1995, 238, 73–81 CrossRef CAS; (d) D. Maganas, S. Milikisyants, J. M. A. Rijnbeek, S. Sottini, N. Levesanos, P. Kyritsis and E. J. J. Groenen, Inorg. Chem., 2010, 49, 595–605 CrossRef CAS PubMed; (e) D. Maganas, S. Sottini, P. Kyritsis, E. J. J. Groenen and F. Neese, Inorg. Chem., 2011, 50, 8741–8754 CrossRef CAS PubMed; (f) J. M. Zadrozny, J. Telser and J. R. Long, Polyhedron, 2013, 64, 209–217 CrossRef CAS.
- (a) W. H. Harman, T. D. Harris, D. E. Freedman, H. Fong, A. Chang, J. D. Rinehart, A. Ozarowski, M. T. Sougrati, F. Grandjean, G. J. Long, J. R. Long and C. J. Chang, J. Am. Chem. Soc., 2010, 132, 18115–18126 CrossRef CAS PubMed; (b) E. Cremades and E. Ruiz, Inorg. Chem., 2011, 50, 4016–4020 CrossRef CAS PubMed; (c) M. Atanasov, D. Ganyushin, D. A. Pantazis, K. Sivalingam and F. Neese, Inorg. Chem., 2011, 50, 7460–7477 CrossRef CAS PubMed.
- A. Cornia, M. Mannini, P. Sainctavit and R. Sessoli, Chem. Soc. Rev., 2011, 40, 3076–3091 RSC.
- (a) F. Moro, V. Corradini, M. Evangeslisti, R. Biagi, V. de Renzi, U. del Pennino, J. C. Cezar, R. Inglis, C. J. Milios and E. K. Brechin, Nanoscale, 2010, 2, 2698–2703 RSC; (b) J. A. J. Burgess, L. Malavolti, V. Lanzilotto, M. Mannini, S. Yan, S. Ninova, F. Totti, S. Rolf-Pissarczyk, A. Cornia, R. Sessoli and S. Loth, Nat. Commun., 2015, 6, 8216, DOI:10.1038/ncomms9216.
- (a) M. Mannini, P. Sainctavit, R. Sessoli, C. Cartier dit Moulin, F. Pineider, M.-A. Arrio, A. Cornia and D. Gatteschi, Chem.–Eur. J., 2008, 14, 7530–7535 CrossRef CAS PubMed; (b) L. Margheriti, D. Chiappe, M. Mannini, P.-E. Car, P. Sainctavit, M.-A. Arrio, F. B. de Mongeot, J. C. Cezar, F. M. Piras, A. Magnani, E. Otero, A. Caneschi and R. Sessoli, Adv. Mater., 2010, 22(48), 5488–5493 CrossRef CAS PubMed.
- H3L = 11-(acetylthio)-2,2-bis(hydroxymethyl)undecan-1-ol; Hdpm = dipivaloylmethane; (a) M. Mannini, F. Pineider, P. Sainctavit, C. Danieli, E. Otero, C. Sciancalepore, A. M. Talarico, M.-A. Arrio, A. Cornia, D. Gatteschi and R. Sessoli, Nat. Mater., 2009, 8, 194–197 CrossRef CAS PubMed; (b) M. Mannini, F. Pineider, C. Danieli, F. Totti, L. Sorace, P. Sainctavit, M.-A. Arrio, E. Otero, L. Joly, J. C. Cezar, A. Cornia and R. Sessoli, Nature, 2010, 468, 417–421 CrossRef CAS PubMed.
- K. S. Varma, A. Bury, N. J. Harris and A. E. Underhill, Synthesis, 1987, 837 CrossRef CAS.
- F. H. Allen, Acta Crystallogr., 2002, B58, 380–388 CAS.
- (a) M. Churchill and J. Wormald, Inorg. Chem., 1971, 10, 1778–1782 CrossRef CAS; (b) R. Lane, J. A. Ibers, R. B. Frankel, G. C. Papefthymiou and R. H. Holm, J. Am. Chem. Soc., 1977, 99, 84–98 CrossRef CAS PubMed; (c) D. Coucouvanis, D. Swenson, N. C. Baenziger, C. Murphy, D. G. Holah, N. Sfarnas, A. Simopoulos and A. Kostikas, J. Am. Chem. Soc., 1981, 103, 3350–3362 CrossRef CAS; (d) D. Coucouvanis, P. Stremple, E. D. Simhon, D. Swenson, N. C. Baenziger, M. Draganjac, L. T. Chan, A. Simopoulos, V. Papaefthymiou, A. Kostikas and V. Petrouleas, Inorg. Chem., 1983, 22, 293–308 CrossRef CAS; (e) J. A. Kovacs, J. K. Bashkin and R. H. Holm, Polyhedron, 1987, 6, 1445–1456 CrossRef CAS; (f) A. Silver, S. A. Koch and M. Millar, Inorg. Chim. Acta, 1993, 205, 9–14 CrossRef CAS; (g) X.-Y. Yu, G.-X. Jin and L.-H. Weng, Chem. Commun., 2004, 1542–1543 RSC.
- R. T. Azuah, L. R. Kneller, Y. Qiu, P. L. W. Tregenna-Piggot, C. M. Brown, J. R. D. Copley and R. M. Dimeo, J. Res. Natl. Inst. Stand. Technol., 2009, 114, 341–358 CrossRef CAS.
- (a) A. Abragam and B. Bleaney, Electron Paramagnetic Resonance of Transition Ions, Dover Publications, Inc., New York, 1986 Search PubMed; (b) R. Drago, Physical Methods for Chemists, Saunders College Publishing, Philadelphia, 2nd edn, 1992 Search PubMed; (c) J. Krzystek, A. Ozarowski and J. Telser, Coord. Chem. Rev., 2006, 250, 2308–2324 CrossRef CAS.
- (a) M. J. Knapp, J. Krzystek, L. C. Brunel and D. N. Hendrickson, Inorg. Chem., 2000, 39, 281–288 CrossRef CAS PubMed; (b) A. L. Barra, A. K. Hassan, A. Janoschka, C. L. Schmidt and V. Schünemann, Appl. Magn. Reson., 2006, 30, 385–397 CrossRef CAS; (c) G. Mathies, S. D. Chatziefthimiou, D. Maganas, Y. Sanakis, S. Sottini, K. Kyritsis and E. J. J. Groenen, J. Magn. Reson., 2012, 224, 94–100 CrossRef CAS PubMed.
- At the fields/frequencies of this study the MS levels are highly mixed, especially the MS = ±1 levels. For simplicity, we employ labels corresponding to the high-field limit, where the MS levels are pure.
- Mössbauer Spectroscopy Applied to Inorganic Chemistry, ed. G. J. Long and F. Grandjean, Plenum Press, New York, 1984 Search PubMed.
- (a) A. Kostikas, V. Petrouleas, A. Simopolous, D. Coucouvanis and D. G. Holah, Chem. Phys. Lett., 1976, 38, 582–584 CrossRef CAS; (b) M. T. Werth, D. M. Kurtz, B. D. Howes and H. H. Boi, Inorg. Chem., 1989, 28, 1357–1361 CrossRef; (c) V. V. Vrajmasu, E. L. Bominaar, J. Meyer and E. Münck, Inorg. Chem., 2002, 41, 6358–6371 CrossRef CAS PubMed; (d) A. Jacques, M. Clémancey, G. Blondin, V. Fourmond, J.-M. Latour and O. Sénèque, Chem. Commun., 2013, 49, 2915–2917 RSC.
- Our measurements do not afford definitive evidence for the sign of ΔEQ, though there is considerable literature evidence that it is negative for iron(II) in the coordination environments of 1–3; see ref. 23c.
- P. R. Edwards, C. E. Johnson and R. J. P. Williams, J. Chem. Phys., 1967, 47, 2074–2082 CrossRef CAS.
- G. B. Ferreira, E. Hollauer, N. M. Comerlato and J. L. Wardell, Inorg. Chim. Acta, 2006, 359, 1239–1247 CrossRef CAS.
- M. S. Gebhard, S. A. Koch, M. Millar, F. J. Devlin, P. J. Stephens and E. I. Solomon, J. Am. Chem. Soc., 1991, 113, 1640–1649 CrossRef CAS.
- J. Elhaïk, D. J. Evans, C. A. Kilner and M. A. Halcrow, Dalton Trans., 2003, 1693–1700 Search PubMed.
- B. N. Figgis and M. A. Hitchman, Ligand Field Theory and its Applications, Wiley-VCH, New York, 1999 Search PubMed.
- F. Neese, J. Am. Chem. Soc., 2008, 128, 10213–10222 CrossRef PubMed.
- (a) J. Cirera, E. Ruiz and S. Alvarez, Chem.–Eur. J., 2006, 12, 3162–3167 CrossRef CAS PubMed; (b) J. Cirera, E. Ruiz and S. Alvarez, Inorg. Chem., 2008, 47, 2871–2889 CrossRef CAS PubMed.
- K. Ray, A. Begum, T. Weyhermüller, S. Piligkos, J. van Slageren, F. Neese and K. Wieghardt, J. Am. Chem. Soc., 2005, 127, 4403–4415 CrossRef CAS PubMed.
- N. A. Gershenfeld and I. L. Chuang, Science, 1997, 275, 350–356 CrossRef CAS PubMed.
- J. Telser, J. Krzystek and A. Ozarowski, JBIC, J. Biol. Inorg. Chem., 2014, 19, 297–318 CrossRef CAS PubMed.
- M. S. Fataftah, J. M. Zadrozny, D. M. Rogers and D. E. Freedman, Inorg. Chem., 2014, 53, 10716–10721 CrossRef CAS PubMed.
Footnote |
| † Electronic supplementary information (ESI) available: Methods and additional characterization and discussion. CCDC 1064089–1064091. For ESI and crystallographic data in CIF or other electronic format see DOI: 10.1039/c5sc02477c |
| This journal is © The Royal Society of Chemistry 2016 |

