 Open Access Article
Creative Commons Attribution 3.0 Unported Licence
Tuning cell surface charge in E. coli with conjugated oligoelectrolytes†
Chelsea
Catania‡
a,
Alexander W.
Thomas‡
b and
Guillermo C.
Bazan
*ab
aMaterials Department, University of California, Santa Barbara, CA 93106, USA
bCenter for Polymers and Organic Solids, Department of Chemistry and Biochemistry, University of California, Santa Barbara, CA 93106, USA. E-mail: bazan@chem.ucsb.edu
First published on 3rd December 2015
Abstract
Cationic conjugated oligoelectrolytes (COEs) varying in length and structural features are compared with respect to their association with E. coli and their effect on cell surface charge as determined by zeta potential measurements. Regardless of structural features, at high staining concentrations COEs with longer molecular dimensions associate less, but neutralize the negative surface charge of E. coli to a greater degree than shorter COEs.
Introduction
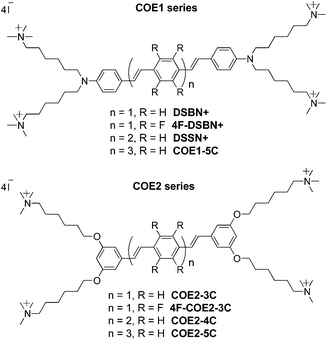
Although the manipulation of microbial cell properties offers the potential for harnessing and tuning the abilities of microorganisms, it remains a significant challenge due to the aqueous environment and overall structural complexity and diversity.1 Genetic engineering, while effective, is limited to materials the cell itself is capable of producing. Synthetic materials and molecular systems offer possible functionalities that are not encountered in nature. With this in mind, conjugated oligoelectrolytes (COEs) are synthetic molecules generally characterized by 3–5 π-conjugated repeat units (RUs) equipped with pendant ionic groups to impart solubility in polar media. COEs are related to conjugated polyelectrolytes used in optoelectronics,2–5 biosensing1,6–8 and bioimaging.2–5,9,10 COEs thus share attractive photophysical properties similar to those of their polymeric analogs, but have much smaller length scales, on par with biological architectures like proteins11,12 and lipid membranes.13–17 As such, a variety of COEs have found utility in bioimaging18–24 and biological detection schemes25–30 of their own.A distinct subset of COEs, and that used in this contribution, is distinguished by ionic functionalities tethered at the two terminal ends of a phenylenevinylene sequence. These bolaamphiphilic structures, in particular DSBN+ and DSSN+ (Chart 1), have been shown to spontaneously intercalate into lipid bilayers with a concomitant increase in fluorescence quantum yield.14 Polarized confocal microscopy has been used to demonstrate a preferential alignment of the COE's molecular long axis relative to the membrane plane. They have also been implicated in boosting the performance of a variety of microbial electronic devices31,32 employing organisms ranging from yeast,14 to E. coli33,34 and Shewanella,35,36 and even naturally occurring bacteria in wastewater.37 Although the exact mechanism of their action is still unclear,36,38,39 it is thought that the COEs' ability to intercalate into microbial membranes is paramount for linking intracellular metabolism to extracellular electrodes in these devices.40
While the lipid membrane intercalation of COEs is well-documented, other biological interactions of COEs and their consequences have not yet been studied. Previously we showed that an anionic COE analogous to DSSN+ was prevented from incorporating into E. coli membranes most likely due to electrostatic repulsion from the innate negative surface charge of the cells.40 These negative charges occur mostly as ionized carboxyl and phosphate groups that are part of lipopolysaccharide (LPS) macromolecules composing the outer leaflet of most Gram-negative bacteria.41,42 Thus, electrostatic attraction between cationic COEs and these anionic sugars in the outermost extensions of E. coli are reasonable and should allow modulation of the overall surface charge of the cells.43–45 Furthermore, in studies concerning the effects of COEs on biological systems, COE concentrations are chosen in the low micromolar regime with no consideration given to the total number of cells; the amount of COE that associates with each cell and that which is left in solution remains to be quantified. With this purpose, we compare 8 COEs varying in molecular length and core substitutions for their association with E. coli and effect on cell zeta potential, finding a remarkable length dependence on these properties.
Results and discussion
Chemical structures
The chemical structures of the COEs used in this study are shown in Chart 1; their syntheses have been described in the literature.14,34,46 Their basic structure can be described by 3–5 phenylenevinylene repeat units (RUs) flanked on both ends by either an amine (COE1 series) or two meta-positioned alkoxy (COE2 series) linkages carrying trimethylammonium iodide terminated hexyl chains. Tetrafluorine substitution of the center phenylene ring of the 3-RU molecules offers variance of the central hydrophobic core to determine its role, if any, in cell association and cell surface charge.Confocal microscopy
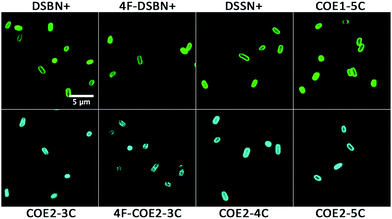
In order to first visualize how each COE interacts with E. coli, we exploited the photoluminescent π-conjugated core of the molecules for fluorescence microscopy. Cells were stained with 10 μM solutions of COE for 1 hour and imaged with a laser scanning confocal microscope, the results of which are shown in Fig. 1 (bright field images are shown in Fig. S1†). As anticipated based on the bolaamphiphilic structure shared by the molecules, all COEs display an emission pattern around the edges of cells consistent with membrane intercalation. In this regard, the substitution of alkoxy pendant linkages for amine or the addition of 4 fluorine atoms to the center phenyl ring of the 3-RU COEs provides no discernable difference in terms of observable cell localization in E. coli.Cell association studies
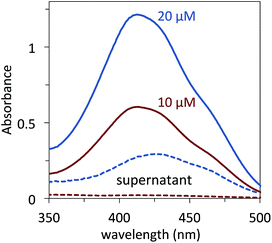
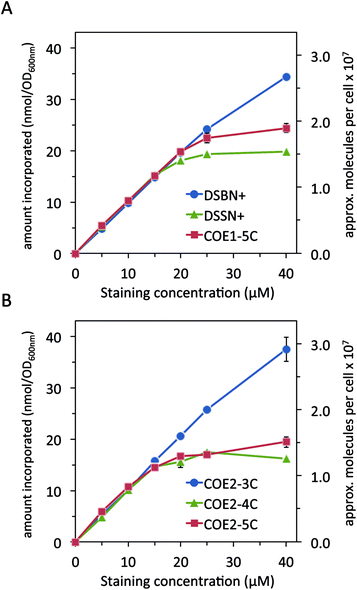
Taking advantage of the strong visible light absorbing properties provided by the conjugated core of the molecules,14 the amount of each COE that associates with E. coli in solution was quantified. Full experimental details are given in the Experimental section. Briefly, cells (OD600 nm = 1.0) were stained in different concentrations of COE ranging from 1–40 μM for 1 hour in 50 mM phosphate buffered saline (PBS) solutions. All concentrations of COE used in this study were less than the critical aggregation concentration (CAC) reported for DSBN+, which is at 0.51 mM.47 A staining time of 1 hour was found sufficient to establish equilibrium within these experimental conditions (Fig. S2†). The cells were then centrifuged and the supernatant analysed by UV-vis absorption to determine the amount of COE left in solution (i.e. not associated with the pelleted cells). This method is illustrated in Fig. 2 for 10 μM and 20 μM DSSN+. Comparing the control spectra of the solutions containing just DSSN+ in PBS (solid lines) to the spectra of the supernatants resulting from cell staining, one observes that at 10 μM, no discernable DSSN+ is left in solution, meaning that all COE has associated with the cells. In contrast, at 20 μM a significant absorption is observed indicating that some DSSN+ remains in the solution and did not associate with the E. coli.In subsequent experiments, the amount of COE associated with cells using the UV-vis absorption method was quantified by subtracting the absorbance of the supernatant of stained and centrifuged E. coli at a wavelength of 420 nm (COE1 series) or 380 nm (COE2 series) from control samples that did not contain cells. Fig. 3 shows the trends in COE/cell association for the unfluorinated COEs at different staining concentrations normalized to 1 OD600 nm of cells. Interestingly, at concentrations between 1–15 μM for all 6 COEs, 100% association is observed resulting in a linear increase in COE association with increasing staining concentration, reaching ∼15 nmol/OD600 nm associated at 15 μM staining concentration. Looking at the COE1 series in Fig. 3A, at concentrations >15 μM the 4- and 5-RU COEs, DSSN+ and COE1-5C, reach a maximum association of ∼20 ± 0.4 nmol/OD600 nm and ∼25 ± 1.0 nmol/OD600 nm respectively. In contrast, the 3 RU COE, DSBN+, does not reach a plateau and attains a maximum association of 34 ± 0.2 nmol/OD600 nm at 40 μM staining concentration. It should be noted that for COEs with minimum inhibitory concentration (MIC) data published (DSBN+ and DSSN+), the MICs (normalized to cell count) required to reduce growth of E. coli are 2 orders of magnitude higher than the concentrations used in this study.13,48 Moreover, it is pointed out in another study, where cytotoxicity tests on E. coli with 20 μM of all COE1 series, that no toxicity phenomena is observed in colony forming units (CFUs).34
A similar trend is observed for the COE2 series in Fig. 3B with maximum associations of 37 ± 2.4, 18 ± 0.5 20 ± 1.1 nmol/OD600 nm for the 3-, 4- and 5- RU COEs, respectively. When comparing the two series of COEs, the 3- RU COE2 series shows slightly greater maximum association than the 3-RU COE1 series DSBN+, suggesting that the structural modification afforded by the alkoxy pendant linkages provide a modest advantage in this respect. However, the comparison between the 4- and 5-RU COEs shows a slightly higher maximum association in the COE1 series than the COE2 series. Interestingly, previous cytotoxicity tests on E. coli with 20 μM of all COE2 series showed no toxicity for COE2-3C, while COE2-4C and COE2-5C have demonstrated a ∼30% loss in CFUs than controls.34 Regardless of series type, there is a clear dependence of COE association with E. coli on molecular length: the amount able to associate with cells for the 4-RU and 5-RU COEs plateaus within the concentration range tested, while the 3-RU COEs do not.
On the secondary y-axes in Fig. 3 are the estimated number of COE molecules associated per cell at each staining concentration, with 1 OD600 nm corresponding to a concentration of 109 cells per mL.49 With this estimate, it can be seen that maximum COE associations observed in these experiments are greater than 107 molecules per cell for 4- and 5-RU COEs and greater than 2 × 10⁷ for both 3-RU COEs. When comparing these numbers to an estimate of the number of lipids per E. coli cell50 of ∼2.2 × 10⁷ one can see that the 4- and 5-RU COEs would approach a 1![[thin space (1/6-em)]](https://www.rsc.org/images/entities/char_2009.gif) :
:![[thin space (1/6-em)]](https://www.rsc.org/images/entities/char_2009.gif) 1 lipid
1 lipid![[thin space (1/6-em)]](https://www.rsc.org/images/entities/char_2009.gif) :
:![[thin space (1/6-em)]](https://www.rsc.org/images/entities/char_2009.gif) COE ratio in cells and the 3-RU COEs surpass this threshold at the 40 μM staining concentration. As discussed in the Introduction, much evidence has been presented that COEs intercalate into microbial membranes, and up until this point, this has been the only interaction considered. With ratios at or above 1
COE ratio in cells and the 3-RU COEs surpass this threshold at the 40 μM staining concentration. As discussed in the Introduction, much evidence has been presented that COEs intercalate into microbial membranes, and up until this point, this has been the only interaction considered. With ratios at or above 1![[thin space (1/6-em)]](https://www.rsc.org/images/entities/char_2009.gif) :
:![[thin space (1/6-em)]](https://www.rsc.org/images/entities/char_2009.gif) 1 lipid
1 lipid![[thin space (1/6-em)]](https://www.rsc.org/images/entities/char_2009.gif) :
:![[thin space (1/6-em)]](https://www.rsc.org/images/entities/char_2009.gif) COE per cell, which would be morphologically impossible, it is obvious that not all of the associated COE is intercalating into lipid bilayers. A plausible hypothesis is that some COE is associating with the outside of the E. coli, which, with its net negative charge,51 is a likely candidate for electrostatic interaction with positively charged molecules.45,52,53
COE per cell, which would be morphologically impossible, it is obvious that not all of the associated COE is intercalating into lipid bilayers. A plausible hypothesis is that some COE is associating with the outside of the E. coli, which, with its net negative charge,51 is a likely candidate for electrostatic interaction with positively charged molecules.45,52,53
Zeta potential measurements
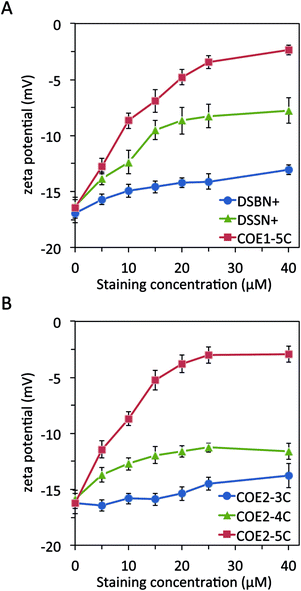
In order to determine the effect of COE association on cell surface charge, stained E. coli cells from the previous experiment were washed and resuspended in PBS buffer for zeta potential measurements,51 the results of which are shown in Fig. 4. Unstained cells were found to have an average zeta potential of about −16 mV under these conditions, indicating a net negative charge, as expected.52 The cells stained with COE1 series follow a trend of increasing zeta potential to more positive values as the staining concentration increases. Maximum zeta potential values of −13.1 ± 0.4, −7.8 ± 1.1, and −2.4 ± 0.4 mV are reached for the 3-, 4-, and 5-RU COEs, respectively, trending more positive with increasing molecular length. In addition, zeta potential values reflect the association trends observed in Fig. 3A, in that the 4- and 5-RU COEs reach a plateau at a staining concentration around the same concentration that the cell association for these COEs plateaus. Despite having the highest maximum cell association of the COE1 series, the 3-RU COE causes the least change in zeta potential but reflects the association trend in Fig. 3A in that the zeta potential does not appear to plateau in the concentration range tested.The effect on E. coli zeta potential of the COE2 series is shown in Fig. 4B. The COE2 series displays a similar length dependence with maximum zeta potential values for E. coli of −13.8 ± 1.1, −11.3 ± 0.6, and −2.9 ± 0.7, observed for COE2-3C, COE2-4C and COE2-5C, respectively. Cells stained by the 3-and 4-RU COE2 molecules display noticeably less positive zeta potential values than their COE1 counterparts but ultimately a similar trend follows in that cells stained by longer COEs result in more positive zeta potential values. Ultimately the change from amine to alkoxy linked pendant groups has only a minor influence on the COE zeta potential effects as a whole.
Rather than observing charge reversal towards high positive values as is seen with cells being coated with positively charged polyelectrolytes,43,44,52 the trend towards charge neutralization in this experiment suggests that not many of the COE positive charges are extending beyond the LPS. COEs are much smaller in size than polyelectrolytes and easily intercalate into lipid membranes and perhaps also ‘interdigitate’ with the oligomeric sugars that form the core of LPS rather than coating the outside cells. In fact, this non-lipid portion of LPS in E. coli K12 is estimated to be ∼2.1 nm in length.54,55 This length is slightly longer than the 3-RU phenylenevinylene core and slightly shorter than the 4-RU conjugated core, which are estimated to be 1.8 nm and 2.4 nm respectively. With the 5-RU core estimated to be around 3 nm, one can begin to rationalize the length scales with the zeta potential results. More specifically, the 4- and 5-RU COEs have a greater chance of spanning the full length or even extending past the outermost LPS units than do the 3-RU COEs, possibly explaining the molecular length dependence of the zeta potential results.
Fluorinated derivatives
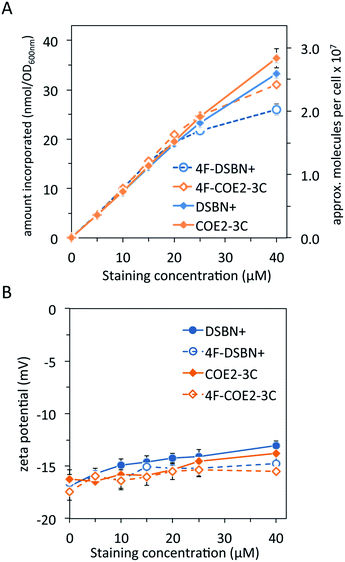
Lastly, cell association and zeta potential experiments were carried out with the fluorine-substituted 3-RU COEs (4FCOEs), the results of which are plotted with the unsubstituted counterparts for comparison and are shown in Fig. 5. Cell association for the 4FCOEs (Fig. 5A) is largely indistinguishable from their unsubstituted counterparts until staining concentrations of ∼25–40 μM, at which point the 4FCOEs associate slightly less. At the highest staining concentration tested (40 μM), there were approximately 2.0 (±0.06) × 107 and 2.4 (±0.02) × 107 molecules associated per cell for 4F-DSBN+ and 4F-COE2-3C, respectively. These values are 23% and 15% less than for DSBN+ and COE2-3C, respectively. A possible explanation for this deviation at higher staining concentrations is the polar-hydrophobic nature of fluorinated compounds,56 making these molecules less likely to aggregate in the lipid membrane due to interactions between the cationic pendant groups and the fluorinated core.13 Being less likely to aggregate or pack closely would result in less overall cell association. It is worth noting, however, that aggregation of COEs in a lipid membrane has yet to be experimentally proven.The zeta potential of E. coli stained with the 4FCOEs (Fig. 5B) follows the same trend as the unfluorinated COEs, in that a gradual increase in zeta potential is observed as staining concentration increases. Cells stained with 4F-DSBN+ reach a more positive maximum (−14.8 ± 0.6 mV) than those stained with 4F-COE2-3C (−15.4 ± 0.6 mV), with both maxima being slightly less positive than the corresponding unfluorinated COEs at −13.1 ± 0.4 mV and −13.8 ± 1.1 mV, respectively. Ultimately, fluorine substitution of the center ring of 3-RU COEs has minimal influence on cell association and zeta potential of stained E. coli.
Conclusions
In conclusion, 8 COEs varying in length and substitutions to the aromatic core have been compared in terms of their association with E. coli and their effect on cell zeta potential. Confocal microscopy showed patterns consistent with lipid membrane association for all COEs. At low staining concentrations (<20 μM) nearly 100% of COE in solution associates with cells, leaving none remaining in the supernatant of centrifuged samples. At higher concentrations, 3-RU COEs continue to associate while 4- and 5-RU COEs plateau, reaching a maximum association that cannot be overcome by adding more COE to the staining solution. The 3-RU COEs associate past a 1![[thin space (1/6-em)]](https://www.rsc.org/images/entities/char_2009.gif) :
:![[thin space (1/6-em)]](https://www.rsc.org/images/entities/char_2009.gif) 1 lipid
1 lipid![[thin space (1/6-em)]](https://www.rsc.org/images/entities/char_2009.gif) :
:![[thin space (1/6-em)]](https://www.rsc.org/images/entities/char_2009.gif) COE ratio while the 4- and 5-RU COEs approach it, which is morphologically impossible and indicative of cellular association not exclusive to membrane intercalation. Cells stained with COEs generally showed more positive zeta potential values with increasing staining concentration, indicating a neutralization of anionic charges of the LPS by the cationic charges of the COEs. Additionally, more positive zeta potential values were observed for longer COEs suggesting that they are able to extend beyond the negatively charged molecular constructs of the E. coli LPS. The other structural variations presented here, namely amine vs. alkoxy pendant linkages and fluorination of the aromatic core, proved less important than molecular length, as they had minimal effects on cell association and zeta potential, when compared to analogues with the same number of repeat units. These changes alter the photophysical properties of the molecules and thus increase the number of COEs available for applications in bioimaging19,20,57–59 and optoelectronics.60,61 Most importantly, that the zeta potential of bacteria can be tuned by COE length and concentration has implications for technologies such as microbial electronics, wastewater treatment, and others that rely on bacterial aggregation, adhesion and biofilm formation.62–68
COE ratio while the 4- and 5-RU COEs approach it, which is morphologically impossible and indicative of cellular association not exclusive to membrane intercalation. Cells stained with COEs generally showed more positive zeta potential values with increasing staining concentration, indicating a neutralization of anionic charges of the LPS by the cationic charges of the COEs. Additionally, more positive zeta potential values were observed for longer COEs suggesting that they are able to extend beyond the negatively charged molecular constructs of the E. coli LPS. The other structural variations presented here, namely amine vs. alkoxy pendant linkages and fluorination of the aromatic core, proved less important than molecular length, as they had minimal effects on cell association and zeta potential, when compared to analogues with the same number of repeat units. These changes alter the photophysical properties of the molecules and thus increase the number of COEs available for applications in bioimaging19,20,57–59 and optoelectronics.60,61 Most importantly, that the zeta potential of bacteria can be tuned by COE length and concentration has implications for technologies such as microbial electronics, wastewater treatment, and others that rely on bacterial aggregation, adhesion and biofilm formation.62–68
Experimental
Materials
All materials were used as received and purchased from Sigma-Aldrich or Fisher Scientific unless otherwise noted.Cell culture
Escherichia coli K-12 (ATCC 10798) was grown aerobically in Luria Broth (10 g L−1 bacto tryptone, 5 g L−1 yeast extract, 10 g L−1 NaCl) overnight at 37 °C with shaking.Cell staining for microscopy
Before staining, E. coli was rinsed twice from the growth medium with phosphate buffered saline (PBS) containing the following: 45.7 mM NaCl, 0.9 mM KCl, 3.3 mM Na2HPO4 and 0.6 mM KH2PO4 at pH 7.4. 0.5 mL of OD600 = 0.9 cells were stained with 10 μM COE for 1 hour in the dark at room temperature before rinsing twice. Samples were then resuspended in 100 μL of PBS and 5 μL were dropped onto a clean glass slide and a cover slip placed on top. Cover slips were sealed with clear nail polish and all samples were imaged within 2 hours.Confocal microscopy
All images were obtained via laser scanning confocal microscopy using an Olympus FluoView 1000S spectral scanning microscope equipped with a 60 × 1.30 silicon oil immersion lens. A 405 nm laser was used as the excitation source. For the COE1 series, emission was collected from 480 nm–580 nm. For the COE2 series, emission was collected from 410 nm–510 nm. All images were processed using ImageJ.COE cell association experiments
E. coli cells at OD600 nm = 1.0 were stained in clear 96-well plates (BD Biosciences, San Jose, CA) at 20 °C for 1 hour in the dark with shaking. Total volume of each sample was 200 μL and samples were measured in triplicate. After centrifugation of the plate (3500 rpm, 4 minutes), 100 μL of supernatant was transferred to a clean well for UV-vis absorption with a Tecan M220 Infinite Pro plate reader (Tecan, Männedorf, Switzerland). Absorbance was measured at 420 nm for COE1 series and 380 nm for COE2 series molecules. Control samples with no cells were treated the same and their absorbance values represented the total COE from which the supernatant values were subtracted to give the amount associated with cells.Zeta potential measurements
Stained, twice-rinsed cells were resuspended in PBS to their original OD600 nm = 1.0. 100 μL of each sample was diluted into 900 μL PBS for zeta potential measurements on a Malvern Zetasizer Nano ZS (Malvern Instruments, Malvern, U.K.) at 20 °C. Data points given are an average of 4 biological replicates with 3 measurements each.Acknowledgements
This work was supported by the Institute for Collaborative Biotechnologies through grant W911NF-09-0001 from the U.S. Army Research Office. The authors acknowledge the use of the Biological Nanostructures Laboratory within the California NanoSystems Institute, supported by UCSB and the UC Office of the President. The authors acknowledge the use of the NRI-MCDB Microscopy Facility supported by the Office of The Director, NIH under award #S10OD010610. This material is based upon work supported by the National Science Foundation Graduate Research Fellowship under Grant No. DGE 1144085.References
- R. F. Fakhrullin and Y. M. Lvov, ACS Nano, 2012, 6, 4557–4564 CrossRef CAS PubMed.
- Conjugated Polyelectrolytes: Fundamentals and Applications, ed. B. Liu and G. C. Bazan, Wiley-VCH, Weinheim, 2013 Search PubMed.
- A. Duarte, K. Y. Pu, B. Liu and G. C. Bazan, Chem. Mater., 2011, 23, 501–515 CrossRef CAS.
- H. Jiang, P. Taranekar, J. R. Reynolds and K. S. Schanze, Angew. Chem., Int. Ed., 2009, 48, 4300–4316 CrossRef CAS PubMed.
- W. Lee, J. H. Seo and H. Y. Woo, Polymer, 2013, 54, 5104–5121 CrossRef CAS.
- F. Feng, F. He, L. An, S. Wang, Y. Li and D. Zhu, Adv. Mater., 2008, 20, 2959–2964 CrossRef CAS.
- R. Zhan and B. Liu, Macromol. Chem. Phys., 2015, 216, 131–144 CrossRef CAS.
- K. P. R. Nilsson and P. Hammarström, Adv. Mater., 2008, 20, 2639–2645 CrossRef CAS.
- G. Feng, D. Ding and B. Liu, Nanoscale, 2012, 4, 6150 RSC.
- T. Klingstedt and K. P. R. Nilsson, Biochim. Biophys. Acta, Gen. Subj., 2011, 1810, 286–296 CrossRef CAS PubMed.
- A. Herland, P. Björk, K. P. R. Nilsson, J. D. M. Olsson, P. Åsberg, P. Konradsson, P. Hammarström and O. Inganäs, Adv. Mater., 2005, 17, 1466–1471 CrossRef CAS.
- T. Klingstedt, A. Aslund, R. A. Simon, L. B. G. Johansson, J. J. Mason, S. Nyström, P. Hammarström and K. P. R. Nilsson, Org. Biomol. Chem., 2011, 9, 8356–8370 CAS.
- J. Hinks, Y. Wang, W. H. Poh, B. C. Donose, A. W. Thomas, S. Wuertz, S. C. J. Loo, G. C. Bazan, S. Kjelleberg, Y. Mu and T. Seviour, Langmuir, 2014, 30, 2429–2440 CrossRef CAS PubMed.
- L. E. Garner, J. Park, S. M. Dyar, A. Chworos, J. J. Sumner and G. C. Bazan, J. Am. Chem. Soc., 2010, 132, 10042–10052 CrossRef CAS PubMed.
- N. Sakai, D. Gerard and S. Matile, J. Am. Chem. Soc., 2001, 123, 2517–2524 CrossRef CAS PubMed.
- Y. Wang, E. M. Jones, Y. Tang, E. Ji, G. P. Lopez, E. Y. Chi, K. S. Schanze and D. G. Whitten, Langmuir, 2011, 27, 10770–10775 CrossRef CAS PubMed.
- E. H. Hill, K. Stratton, D. G. Whitten and D. G. Evans, Langmuir, 2012, 28, 14849–14854 CrossRef CAS PubMed.
- P. Yan, A. Xie, M. Wei and L. M. Loew, J. Org. Chem., 2008, 73, 6587–6594 CrossRef CAS PubMed.
- A. W. Thomas, Z. B. Henson, J. Du, C. A. Vandenberg and G. C. Bazan, J. Am. Chem. Soc., 2014, 136, 3736–3739 CrossRef CAS PubMed.
- P. Gwozdzinska, R. Pawlowska, J. Milczarek, L. E. Garner, A. W. Thomas, G. C. Bazan and A. Chworos, Chem. Commun., 2014, 50, 14859–14861 RSC.
- A. Cieślar-Pobuda, M. Bäck, K. Magnusson, M. V. Jain, M. Rafat, S. Ghavami, K. P. R. Nilsson and M. J. Łos, Cytometry, Part A, 2014, 85, 628–635 CrossRef PubMed.
- S. Schmid, E. M. Schneider, E. Brier and P. Bäuerle, J. Mater. Chem. B, 2014, 2, 7861–7865 RSC.
- M. Dal Molin, Q. Verolet, A. Colom, R. Letrun, E. Derivery, M. Gonzalez-Gaitan, E. Vauthey, A. Roux, N. Sakai and S. Matile, J. Am. Chem. Soc., 2015, 137, 568–571 CrossRef CAS PubMed.
- I. Palamà, F. Di Maria, I. Viola, E. Fabiano, G. Gigli, C. Bettini and G. Barbarella, J. Am. Chem. Soc., 2011, 133, 17777–17785 CrossRef PubMed.
- T. Klingstedt, H. Shirani, K. O. A. Åslund, N. J. Cairns, C. J. Sigurdson, M. Goedert and K. P. R. Nilsson, Chem.–Eur. J., 2013, 19, 10179–10192 CrossRef CAS PubMed.
- J. Wigenius, G. Persson, J. Widengren and O. Inganäs, Macromol. Biosci., 2011, 11, 1120–1127 CrossRef CAS PubMed.
- A. Herland, K. P. R. Nilsson, J. D. M. Olsson, P. Hammarström, P. Konradsson and O. Inganäs, J. Am. Chem. Soc., 2005, 127, 2317–2323 CrossRef CAS PubMed.
- A. Duarte, A. Chworos, S. F. Flagan, G. Hanrahan and G. C. Bazan, J. Am. Chem. Soc., 2010, 132, 12562–12564 CrossRef CAS PubMed.
- H. Li and G. C. Bazan, Adv. Mater., 2009, 21, 964–967 CrossRef CAS.
- L. Cai, R. Zhan, K.-Y. Pu, X. Qi, H. Zhang, W. Huang and B. Liu, Anal. Chem., 2011, 83, 7849–7855 CrossRef CAS PubMed.
- H. Yan, C. Catania and G. C. Bazan, Adv. Mater., 2015, 27, 2958–2973 CrossRef CAS PubMed.
- J. Du, C. Catania and G. C. Bazan, Chem. Mater., 2014, 26, 686–697 CrossRef CAS.
- V. B. Wang, J. Du, X. Chen, A. W. Thomas, N. D. Kirchhofer, L. E. Garner, M. T. Maw, W. H. Poh, J. Hinks, S. Wuertz, S. Kjelleberg, Q. Zhang, J. S. C. Loo and G. C. Bazan, Phys. Chem. Chem. Phys., 2013, 15, 5867–5872 RSC.
- H. Hou, X. Chen, A. W. Thomas, C. Catania, N. D. Kirchhofer, L. E. Garner, A. Han and G. C. Bazan, Adv. Mater., 2013, 25, 1593–1597 CrossRef CAS PubMed.
- A. W. Thomas, L. E. Garner, K. P. Nevin, T. L. Woodard, A. E. Franks, D. R. Lovley, J. J. Sumner, C. J. Sund and G. C. Bazan, Energy Environ. Sci., 2013, 6, 1761–1765 CAS.
- N. D. Kirchhofer, X. Chen, E. Marsili, J. J. Sumner, F. W. Dahlquist and G. C. Bazan, Phys. Chem. Chem. Phys., 2014, 16, 20436–20443 RSC.
- L. E. Garner, A. W. Thomas, J. J. Sumner, S. P. Harvey and G. C. Bazan, Energy Environ. Sci., 2012, 5, 9449–9452 CAS.
- K. Sivakumar, V. B. Wang, X. Chen, G. C. Bazan, S. Kjelleberg, S. C. J. Loo and B. Cao, Appl. Microbiol. Biotechnol., 2014, 98, 9021–9031 CrossRef CAS PubMed.
- J. Du, A. W. Thomas, X. Chen, L. E. Garner, C. A. Vandenberg and G. C. Bazan, Chem. Commun., 2013, 49, 9624–9626 RSC.
- A. W. Thomas, C. Catania, L. E. Garner and G. C. Bazan, Chem. Commun., 2015, 51, 9294–9297 RSC.
- L. P. Kotra, D. Golemi, N. A. Amro, G.-Y. Liu and S. Mobashery, J. Am. Chem. Soc., 1999, 121, 8707–8711 CrossRef CAS.
- H. Nikaido, Microbiol. Mol. Biol. Rev., 2003, 67, 593–656 CrossRef CAS PubMed.
- B. Franz, S. S. Balkundi, C. Dahl, Y. M. Lvov and A. Prange, Macromol. Biosci., 2010, 10, 164–172 CrossRef CAS PubMed.
- S. S. Balkundi, N. G. Veerabadran, D. M. Eby, G. R. Johnson and Y. M. Lvov, Langmuir, 2009, 25, 14011–14016 CrossRef CAS PubMed.
- D. M. Eby, S. Harbaugh, R. N. Tatum, K. E. Farrington, N. Kelley-Loughnane and G. R. Johnson, Langmuir, 2012, 28, 10521–10527 CrossRef CAS PubMed.
- H. Y. Woo, B. Liu, B. Kohler, D. Korystov, A. Mikhailovsky and G. C. Bazan, J. Am. Chem. Soc., 2005, 127, 14721–14729 CrossRef CAS PubMed.
- J. H. Ortony, T. Chatterjee, L. E. Garner, A. Chworos, A. Mikhailovsky, E. J. Kramer and G. C. Bazan, J. Am. Chem. Soc., 2011, 133, 8380–8387 CrossRef CAS PubMed.
- J. Hinks, W. H. Poh, J. J. H. Chu, J. S. C. Loo, G. C. Bazan, L. E. Hancock and S. Wuertz, Applied and Environmental Microbiology, 2015, 81, 1949–1958 CrossRef CAS PubMed.
- I. Sondi and B. Salopek-Sondi, J. Colloid Interface Sci., 2004, 275, 177–182 CrossRef CAS PubMed.
- Escherichia coli and Salmonella: Cellular and Molecular Biology, ed. F. C. Neidhardt, R. Curtiss, J. L. Ingraham, E. C. C. Lin, K. B. Low, B. Magasanik, W. S. Reznikoff, M. Riley, M. Schaechter and H. E. Umbarger, ASM Press, Washington DC, 2nd edn, 1996, vol. 1 Search PubMed.
- W. W. Wilson, M. M. Wade, S. C. Holman and F. R. Champlin, J. Microbiol. Methods, 2001, 43, 153–164 CrossRef CAS PubMed.
- A. L. Hillberg and M. Tabrizian, Biomacromolecules, 2006, 7, 2742–2750 CrossRef CAS PubMed.
- M. Kahraman, A. I. Zamaleeva, R. F. Fakhrullin and M. Culha, Anal. Bioanal. Chem., 2009, 395, 2559–2567 CrossRef CAS PubMed.
- A. G. Lee, Biochim. Biophys. Acta, Biomembr., 2003, 1612, 1–40 CrossRef CAS.
- M. Kastowsky, T. Gutberlet and H. Bradaczek, J. Bacteriol., 1992, 174, 4798–4806 CAS.
- J. C. Biffinger, H. W. Kim and S. G. DiMagno, ChemBioChem, 2004, 5, 622–627 CrossRef CAS PubMed.
- K.-Y. Pu, K. Li, X. Zhang and B. Liu, Adv. Mater., 2010, 22, 4186–4189 CrossRef CAS PubMed.
- D. Ding, K.-Y. Pu, K. Li and B. Liu, Chem. Commun., 2011, 47, 9837–9839 RSC.
- W. Song, R. Jiang, Y. Yuan, X. Lu, W. Hu, Q. Fan and W. Huang, Chin. Sci. Bull., 2013, 58, 2570–2575 CrossRef CAS.
- Y. Lee, I. Yang, J. E. Lee, S. Hwang, J. W. Lee, S.-S. Um, T. L. Nguyen, P. J. Yoo, H. Y. Woo, J. Park and S. K. Kim, J. Phys. Chem. C, 2013, 117, 3298–3307 CAS.
- N. D. Kirchhofer, M. Rasmussen, F. Dahlquist, S. Minteer and G. C. Bazan, Energy Environ. Sci., 2015, 8, 2698–2706 CAS.
- R. Nakao, M. Ramstedt, S. N. Wai and B. E. Uhlin, PLoS One, 2012, 7, e51241 CAS.
- A. T. Poortinga, R. Bos, W. Norde and H. J. Busscher, Surf. Sci. Rep., 2002 Search PubMed.
- J. Palmer, S. Flint and J. Brooks, J. Ind. Microbiol. Biotechnol., 2007, 34, 577–588 CrossRef CAS PubMed.
- Y. Liu, S.-F. Yang, Y. Li, H. Xu, L. Qin and J.-H. Tay, J. Biotechnol., 2004, 110, 251–256 CrossRef CAS PubMed.
- W. M. Dunne, Clin. Microbiol. Rev., 2002, 15, 155–166 CrossRef CAS PubMed.
- A. Zita and M. Hermansson, Appl. Environ. Microbiol., 1997, 63, 1168–1170 CAS.
- F. Ahimou, F. A. Denis, A. Touhami and Y. F. Dufrêne, Langmuir, 2002, 18, 9937–9941 CrossRef CAS.
Footnotes |
| † Electronic supplementary information (ESI) available: Experimental details, additional figures. See DOI: 10.1039/c5sc03046c |
| ‡ These authors contributed equally to this work. |
| This journal is © The Royal Society of Chemistry 2016 |

