 Open Access Article
Creative Commons Attribution 3.0 Unported Licence
Total chemical synthesis of photoactivatable proteins for light-controlled manipulation of antigen–antibody interactions†
Shan
Tang‡
a,
Zhengpeng
Wan‡
b,
Yiren
Gao‡
b,
Ji-Shen
Zheng
c,
Jing
Wang
b,
Yan-Yan
Si
a,
Xin
Chen
d,
Hai
Qi
d,
Lei
Liu
*a and
Wanli
Liu
*b
aTsinghua-Peking Center for Life Sciences, Key Laboratory of Bioorganic Phosphorus Chemistry & Chemical Biology (Ministry of Education), Department of Chemistry, Tsinghua University, Beijing 100084, China. E-mail: lliu@mail.tsinghua.edu.cn
bMOE Key Laboratory of Protein Science, Collaborative Innovation Center for Diagnosis and Treatment of Infectious Diseases, School of Life Sciences, Tsinghua University, Beijing, 100084, China. E-mail: liulab@mail.tsinghua.edu.cn
cHigh Magnetic Field Laboratory, Chinese Academy of Sciences, Hefei, 230031, China
dLaboratory of Dynamic Immunobiology, School of Medicine, Tsinghua University, Beijing, 100084, China
First published on 11th December 2015
Abstract
We report the chemical synthesis of the first photo-activatable protein antigen that can be used to study antigen–antibody interaction mediated responses in B cells. This strategy facilitated fine tuning of the caged protein antigen to optimize its bioactivity and photochemical properties. One optimal molecule, HEL-K96NPE, was totally inert to hen egg lysozyme (HEL)-specific B cells and could only restore its antigenicity upon photoactivation. Combined with real time live cell imaging, the utility of HEL-K96NPE was demonstrated as a proof of concept to quantify B cell synapse formation and calcium influx responses at the single cell level.
Light-responsive reagents provide useful tools to probe and manipulate biological events in a controllable manner with an aim to elucidate complex biological processes.1 Since the report of caged cAMP and ATP,2 various caged biomolecules such as neurotransmitters,3 nucleotides,4 lipids,5 and peptides6 have been described. Photocaged proteins,7 due to their high bioactivity and specificity, are especially suitable for the studies of dynamic cellular processes such as signal transduction, DNA transcription and cell motility.8 Photocaged proteins are typically obtained by masking the critical functionality for enzyme activity/protein–protein interaction or peptide backbones.9 Although the technique of genetically encoding unnatural amino acids makes the preparation of photocaged proteins possible,10 chemical protein synthesis can also be used for development of photocaged proteins.11
Here we report the first photoactivatable protein antigen developed through chemical protein synthesis for light-controlled manipulation of antigen–antibody interactions in B cell studies. B lymphocytes circulating in the blood and lymphatic system perform important roles of immune surveillance. They use the surface expressed B cell receptors (BCRs) composed of membrane bound antibody and signaling co-receptor Igα/Igβ to recognize and capture pathological antigens.12,13 Much attention has been paid to the dynamic events driving the formation of the B cell immunological synapse (IS) using imaging approaches.14 A better understanding of these events provides insights into fundamental aspects of B cell responses, such as antibody discrimination, antibody memory immunity and even B cell tumorigenesis.15 Nonetheless, there is a lack of molecular tools to manipulate the initiation of these dynamic events in a controllable manner.16 Our caged protein antigens provided novel and useful tools to cope with this challenge.
We focused on hen egg lysozyme (HEL), one of the most important model antigens recognized by the B cells expressing HEL-specific membrane bound antibody (HyHEL-10).17 Studies on HEL have greatly contributed to the understanding of antibody responses and B cell biology.18,19 An inert caged antigen (Scheme 1A) that could only be activated upon photoactivation would be useful to study antigen–antibody interactions and the formation of B cell IS in a controllable manner. This created an interesting challenge as the HEL/HyHEL-10 interaction is very strong (KD ≈ 20 pM) with a very large interaction surface (about 1800 Å) (Scheme 1B).20,21 Among the 16 residues directly contacting the HyHEL-10 antibody, the external surface of the helix and the extended loop region (Thr89–Gly102, Scheme 1C) contributes the most to the interaction of HEL with the HyHEL-10 antibody. To obtain a photoactivatable HEL, we decided to mask key amino acid residues lying on the interface based on the co-crystal structure of HEL and Fv fragment of HyHEL-10 antibody.21
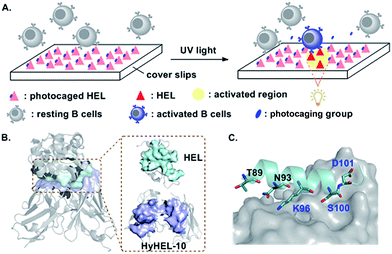 | ||
| Scheme 1 (A) Photocaged HEL, after exposure to near-UV light, activates B cells to trigger downstream signal transduction. (B) Co-crystal structure of HEL and Fv fragment of HyHEL-10 (left). The interface of HEL and HyHEL-10 is shown on the right. (C) Interaction between the external surfaces of HEL and HyHEL-10. The images are modified from Protein Data Bank file 2DQJ. | ||
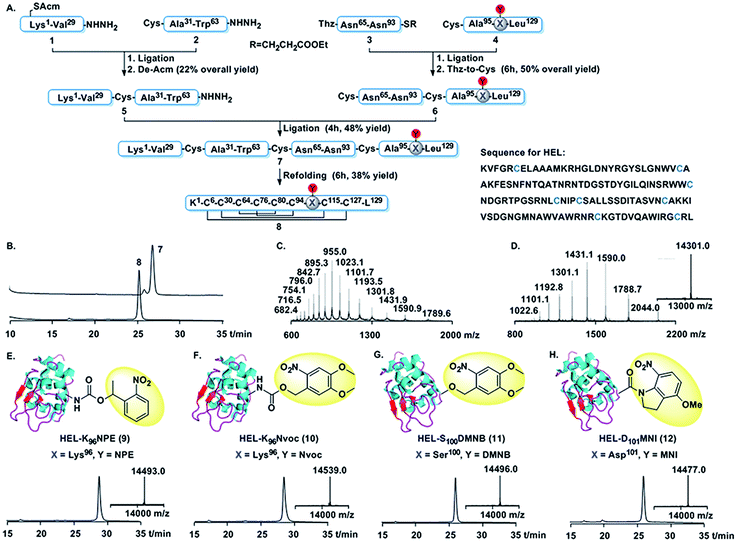
We first developed a general synthetic route to HEL. An earlier synthesis of human lysozyme used tert-butoxycarbonyl (Boc) solid phase peptide synthesis (SPPS).22 However, as the caging groups were not compatible with Boc SPPS,23 a 9-fluorenyl-methoxycarbonyl (Fmoc) route was needed.24 As shown in Fig. 1A, HEL was divided into two halves, each containing two segments, i.e. (1, 2, 3 and 4). Cys6 in segment 1 was protected by an acetamidomethyl (Acm) group to avoid the formation of thiolactone.24c The N-terminal half 5 was assembled by ligation of 1 and 2, followed by removal of the Acm group. The C-terminal half 6 was made by condensation of 3 and 4, and subsequent conversion of Thz to Cys. Final ligation between 5 and 6 afforded full-length HEL (7), which was subjected to a redox system to form the correctly folded HEL (8). 7 and 8 were characterized by HPLC and mass analysis (Fig. 1B–D). The pattern of four disulfide linkages was consistent with that of native HEL according to (LC-MS)/MS analysis (Fig. S14 and S15†).
Using the above synthetic route, we synthesized the photocaged HELs (Fig. 1E–H). We aimed to develop near UV-sensitive proteins for in vitro live cell imaging studies. Therefore, we used 1-(2-nitrophenyl)ethyl (NPE) and 6-nitroveratryloxy-carbonyl (Nvoc) groups to mask Lys96, obtaining HEL-K96NPE (9) and HEL-K96Nvoc (10). We also made HEL-S100DMNB (11) using 4,5-dimethoxy-2-nitrobenzyl (DMNB) to mask Ser100. In addition, we made HEL-D101MNI (12) using 4-methoxy-7-nitroindolinyl (MNI) to mask Asp101.25 HPLC analysis showed that all four photocaged HEL variants exhibited enhanced hydrophobic features compared to HEL, reflecting the hydrophobic nature of each photocleavable moiety. Each HEL variant was obtained at the 1 mg scale (Fig. S4–S12, Table S2†).
CD spectra of these photocaged proteins and native HEL exhibited a negative minimum absorption at 208 nm,26 indicating that attachment of photosensitive moieties did not appreciably change the general structure of HEL (Fig. S16†).
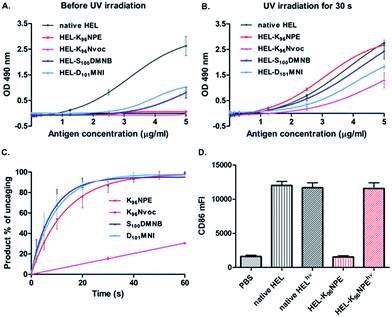
We examined the antigenicity of the synthetic proteins against HyHEL-10 with an antigen-dose dependent enzyme-linked immunosorbent assay (ELISA). Synthetic wild-type HEL exhibited a binding capacity similar to that of native HEL purified from hen egg white (Fig. S17†), while 9 and 10 exhibited no measurable binding to HyHEL-10 (Fig. 2A). Moreover, the binding ability of 11 or 12 was reduced but not abrogated. A similar conclusion was made after measuring the binding affinity of the HEL variants to HyHEL-10 by surface plasmon resonance (SPR) (Fig. S20†). The binding affinity of 12, 11 and 9 (or 10) to HyHEL-10 was about 300-, 400-, and 6000-fold weaker than that of native HEL. Therefore, caging at Lys96 (9 or 10) can effectively reduce the binding affinity of HEL toward HyHEL-10. Upon exposure to UV light (365 nm, 18 mW cm−2) for 60 s, we observed enhanced binding capability to HyHEL-10 for all of these four photocaged HEL variants (Fig. 2B). Especially for 9, the binding capability after photoactivation was comparable to native HEL. However, 10 only partially restored its antigenicity. These results were consistent with the photolysis kinetics data obtained by analyzing the percentage of photolytic peptides in the total peptide population (Fig. 2C and S19†).27
To further assess the antigenicity of photoactivated 9 in living B cells, a flow cytometry-based cellular assay was carried out. Photoactivated 9 efficiently up-regulated the activation marker CD86 on HEL-specific primary B cells from MD4 transgenic mice (MD4 primary B cells) similarly to native HEL,28 while 9 was totally inert after an incubation duration of 12 h (Fig. 2D and S21†). These results showed that caging of a single amino acid can efficiently disrupt a picomolar affinity protein–protein interaction with a large interface up to 1800 Å2.
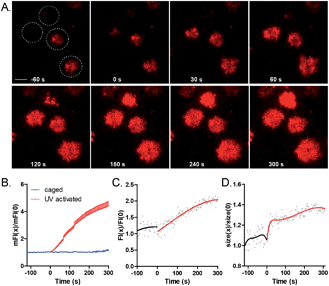
We then used 9 to temporally control antigen–antibody mediated B cell spreading and the subsequent accumulation responses of BCRs into the B cell IS.14 We immobilized 9 on the surface of cover slides, and placed freshly isolated MD4 primary B cells (pre-labeled with Alexa Fluor 647 conjugated Fab fragment of anti-mouse IgM) on these slides. The dynamics of the contact interface of B cells with glass slides before and after irradiation with a 405 nm laser (7.3 W cm−2) were examined by TIRF imaging.29,30 As shown from the images (Fig. 3A and ESI Movie 1†), before laser irradiation, MD4 primary B cells mildly touched the cover slides coated with 9. Only 3 s after photoactivation, MD4 primary B cells underwent a typical spreading response towards the photoactivated surface as quantified by the increased size of the B cell contact area, which was referred to as the size of B cell IS (Fig. S29†). The mean fluorescence intensity (mFI) of HyHEL-10 BCRs within the B cell IS increased by about 400% in 400 s after photoactivation (Fig. 3B). These responses were dependent on the light dosage in a linear manner (Fig. S27†) and only B cells within the photoactivated region but not the B cells sitting far beyond the photoactivated region exhibited the synaptic accumulation of BCRs (Fig. S26†). These data indicated that immediately after photoactivation, 9 was converted to the antigenic form to drive the accumulation of BCRs at the photoactivated regions.
Next we examined the dynamic changes of the high BCR FI puncta structures (BCR microclusters) within the contact interface of B cells with cover slides before and after photoactivation. As shown by the four representative cells in Fig. 3A, there was no formation of stable and prominent BCR microclusters before photoactivation. However, statistical analysis showed that the BCR microcluster FI and size (Fig. 3C and D), as quantified by a 2D-Gaussian function-based fitting method,31 increased over time after photoactivation. These results suggested that BCR and antigen recognition triggered the formation and maturation of BCR microclusters during the initiation of B cell activation.14a
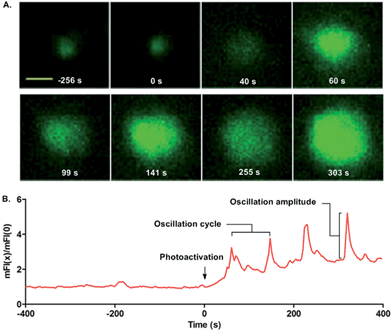
Finally, we quantified the single cell calcium influx responses upon photoactivation. MD4 primary B cells pre-stained with the calcium probe Fluo-4 were placed on cover slides presenting 9 for calcium imaging (Fig. 4A and ESI Movie 2†). No calcium influx responses were observed in the MD4 primary B cells in contact with 9 in the first 400 s. Upon photoactivation (405 nm laser, 7.3 W cm−2), uncaged 9 readily drove the B cells to undergo calcium influx responses. The oscillating calcium influx responses were observed with an oscillation cycle of 85–90 s and an amplitude of 2–2.6 times the basal mFI level (Fig. 4B, and ESI Movie 2†). The oscillating calcium influx nature is the physiological response of activated primary B cells in vivo.32 Thus with the help of the photoactivatable HEL, we can capture the full frame dynamic calcium influx responses in the initiation of B cell activation that are not easily observed by the conventional experimental system.
It should be pointed out that although 9 failed to activate HEL-specific BCR and B cells, it showed a binding affinity to HyHEL-10 of about 50 nM in our SPR assay (Fig. S20†). Because the affinity between wild type HEL and HyHEL-10 test in our SPR assay was 2–7 fold higher than that was measured by other methods in the literature,19,20,33 we cannot completely rule out the possibility that we might have also overestimated the affinity between HyHEL-10 with HEL-K96NPE. However, previous studies showed that HEL(K97A) mutant with an affinity of 114 nM to HyHEL-10, exhibiting a 2400-fold decrease to HEL, lost the ability to activate B cells.19 Based on these results, we proposed that in addition to binding affinity, the availability of a sufficient amount of antigen density,19 a high-enough Kon rate,19 and even the correct conformational changes upon antigen binding34 might be cooperating in the binding for the conversion to constructive biological effects.
Conclusions
Protein chemical synthesis offers convenient access to tailor-designed photocaged proteins. We developed the first photoactivatable protein antigen through photocaged hot spot scanning. The in vitro ELISA- and SPR-based binding assays and flow cytometry-based cellular assays provided the basis for subsequent studies investigating the dynamic early events by TIRFM-based live cell imaging approaches. Importantly, we captured the behavior changes of B cells upon photoactivation for spreading responses, the accumulation of BCR molecules into the B cell immunological synapse and the calcium oscillation response in a controllable manner. By offering the unique ability to trigger the antigen–antibody interaction with an exact temporal resolution, HEL-K96NPE could be a promising molecular tool to unravel the complex and dynamic events in the initiation of B cell activation. Our results also indicate the powerful capability of chemical protein synthesis in enabling the optimization of bioactivities and photochemical properties of caged proteins.Acknowledgements
We thank Dr Susan K. Pierce (National Institute of Allergy and Infectious Diseases, National Institutes of Health) for generously providing experimental materials. This work is supported by funds from MOST (2014CB542500, 2013CB932800 and 2014AA020527), NSFC (81361120384, 21532004, 31270913 and 81422020), and the Specialized Research Fund for the Doctoral Program of Higher Education (Grant No. 20120002130004).Notes and references
- C. Brieke, F. Rohrbach, A. Gottschalk, G. Mayer and A. Heckel, Angew. Chem., Int. Ed., 2012, 51, 8446–8476 CrossRef CAS PubMed.
- (a) J. Engels and E.-J. Schlaeger, J. Med. Chem., 1977, 20, 907–911 CrossRef CAS PubMed; (b) J. H. Kaplan, B. Forbush 3rd and J. F. Hoffman, Biochemistry, 1978, 17, 1929–1935 CrossRef CAS PubMed.
- G. C. R. Ellis-Davies, Nat. Methods, 2007, 4, 619–628 CrossRef CAS PubMed.
- G. Mayer and A. Heckel, Angew. Chem., Int. Ed., 2006, 45, 4900–4921 CrossRef CAS PubMed.
- (a) A. Nadler, G. Reither, S. Feng, F. Stein, S. Reither, R. Müller and C. Schultz, Angew. Chem., Int. Ed., 2013, 52, 6330–6334 CrossRef CAS PubMed; (b) L. T. Nguyen, N. P. Oien, N. L. Allbritton and D. S. Lawrence, Angew. Chem., Int. Ed., 2013, 52, 9936–9939 CrossRef CAS PubMed.
- (a) H.-M. Lee, W. Xu and D. S. Lawrence, J. Am. Chem. Soc., 2011, 133, 2331–2333 CrossRef CAS PubMed; (b) A. L. DeMond, T. Starr, M. L. Dustin and J. T. Groves, J. Am. Chem. Soc., 2006, 128, 15354–15355 CrossRef CAS PubMed; (c) M. Sainlos, W. S. Iskenderian-Epps, N. B. Olivier, D. Choquet and B. Imperiali, J. Am. Chem. Soc., 2013, 135, 4580–4583 CrossRef CAS PubMed.
- C. W. Riggsbee and A. Deiters, Trends Biotechnol., 2010, 28, 468–475 CrossRef CAS PubMed.
- (a) M. E. Hahn and T. W. Muir, Angew. Chem., Int. Ed., 2004, 43, 5800–5803 CrossRef CAS PubMed; (b) J. Hemphill, C. Chou, J. W. Chin and A. Deiters, J. Am. Chem. Soc., 2013, 135, 13433–13439 CrossRef CAS PubMed; (c) B. N. Goguen, B. D. Hoffman, J. R. Sellers, M. A. Schwartz and B. Imperiali, Angew. Chem., Int. Ed., 2011, 50, 5667–5670 CrossRef CAS PubMed; (d) J. K. Böcker, K. Friedel, J. C. J. Matern, A.-L. Bachmann and H. D. Mootz, Angew. Chem., Int. Ed., 2015, 54, 2116–2120 CrossRef PubMed; (e) X. Chen, S. Tang, J.-S. Zheng, R. Zhao, Z.-P. Wang, W. Shao, H.-N. Chang, J.-Y. Cheng, H. Zhao, L. Liu and H. Qi, Nat. Commun., 2015, 6, 7220–7228 CrossRef PubMed.
- L. Baumann and A. G. Beck-Sickinger, Angew. Chem., Int. Ed., 2013, 53, 9550–9553 CrossRef PubMed.
- A. S. Baker and A. Deiters, ACS Chem. Biol., 2014, 9, 1398–1407 CrossRef CAS PubMed.
- (a) S. B. H. Kent, Chem. Soc. Rev., 2009, 38, 338–351 RSC; (b) Y. Huang and L. Liu, Sci. China: Chem., 2015, 58, 1779–1781 CrossRef CAS.
- J. M. Dal Porto, S. B. Gauld, K. T. Merrell, D. Mills, A. E. Pugh-Bernard and J. Cambier, Mol. Immunol., 2004, 41, 599–613 CrossRef CAS PubMed.
- (a) A. L. DeFranco, Curr. Opin. Immunol., 1997, 9, 296–308 CrossRef CAS PubMed; (b) H. Jumaa, R. W. Hendriks and M. Reth, Annu. Rev. Immunol., 2005, 23, 415–445 CrossRef CAS PubMed.
- (a) S. K. Pierce and W. Liu, Nat. Rev. Immunol., 2010, 10, 767–777 CrossRef CAS PubMed; (b) N. E. Harwood and F. D. Batista, Annu. Rev. Immunol., 2010, 28, 185–210 CrossRef CAS PubMed.
- R. E. Davis, V. N. Ngo and G. Lenz, et al. , Nature, 2010, 463, 88–92 CrossRef CAS PubMed.
- M. Huse, Immunology, 2010, 130, 151–157 CrossRef CAS PubMed.
- C. C. Goodnow, J. Crosbie and S. Adelstein, et al. , Nature, 1988, 334, 676–682 CrossRef CAS PubMed.
- C. A. Nelson, N. J. Viner and E. R. Unanue, Immunol. Rev., 1996, 151, 81–105 CrossRef CAS PubMed.
- S. J. Fleire, J. P. Goldman, Y. R. Carrasco, M. Weber, D. Bray and F. D. Batista, Science, 2006, 312, 738–741 CrossRef CAS PubMed.
- T. B. Lavoie, W. N. Drohan and S. J. Smith-Gill, J. Immunol., 1992, 148, 503–513 CAS.
- (a) E. A. Padlan, E. W. Silverton, S. Sheriff, G. H. Cohen, S. J. Smith-Gill and D. R. Davies, Proc. Natl. Acad. Sci. U. S. A., 1989, 86, 5938–5942 CrossRef CAS PubMed; (b) H. Kondo, M. Shiroishi, M. Matsushima, K. Tsumoto and I. Kumagai, J. Biol. Chem., 1999, 274, 27623–27631 CrossRef CAS PubMed.
- T. Durek, V. Y. Torbeev and S. B. H. Kent, Proc. Natl. Acad. Sci. U. S. A., 2007, 104, 4846–4851 CrossRef CAS PubMed.
- P. Siman, S. V. Karthikeyan, M. Nikolov, W. Fischle and A. Brik, Angew. Chem., Int. Ed., 2013, 52, 8059–8063 CrossRef CAS PubMed.
- (a) P. E. Dawson, T. W. Muir, I. Clark-Lewis and S. B. H. Kent, Science, 1994, 266, 776–779 CAS; (b) G.-M. Fang, Y.-M. Li, F. Shen, Y.-C. Huang, J.-B. Li, Y. Lin, H.-K. Cui and L. Liu, Angew. Chem., Int. Ed., 2011, 50, 7645–7649 CrossRef CAS PubMed; (c) G.-M. Fang, J.-X. Wang and L. Liu, Angew. Chem., Int. Ed., 2012, 51, 10347–10350 CrossRef CAS PubMed.
- S. Tang, J.-Y. Cheng and J.-S. Zheng, Tetrahedron Lett., 2015, 56, 4582–4585 CrossRef CAS.
- T. Knubovets, J. J. Osterhout, P. J. Connolly and A. M. Klibanov, Proc. Natl. Acad. Sci. U. S. A., 1999, 96, 1262–1267 CrossRef CAS.
- P. Klán, T. Šolomek, C. G. Bochet, A. Blanc, R. Givens, M. Rubina, V. Popik, A. Kostikov and J. Wirz, Chem. Rev., 2013, 113, 119–191 CrossRef PubMed.
- J. C. Rathmell, S. E. Townsend, J. C. Xu, R. A. Flavell and C. C. Goodnow, Cell, 1996, 87, 319–329 CrossRef CAS PubMed.
- (a) D. Axelrod, J. Cell Biol., 1981, 89, 141–145 CrossRef CAS PubMed; (b) J. T. Groves, R. Parthasarathy and M. B. Forstner, Annu. Rev. Biomed. Eng., 2008, 10, 311–338 CrossRef CAS PubMed; (c) W. Liu, T. Meckel, P. Tolar, H. W. Sohn and S. K. Pierce, Immunity, 2010, 32, 778–789 CrossRef CAS PubMed.
- D. Axelrod, T. P. Burghardt and N. L. Thompson, Annu. Rev. Biophys. Bioeng., 1984, 13, 247–268 CrossRef CAS PubMed.
- Z. Wan, S. Zhang, Y. Fan, K. Liu, F. Du, A. M. Davey, H. Zhang, W. Han, C. Xiong and W. Liu, J. Immunol., 2013, 190, 4661–4675 CrossRef CAS PubMed.
- H. Qi, J. G. Egen, A. Y. C. Huang and R. N. Germain, Science, 2006, 312, 1672–1676 CrossRef CAS PubMed.
- (a) A. Rajpal, M. G. Taylor and J. F. Kirsch, Protein Sci., 1998, 7, 1868–1874 CrossRef CAS PubMed; (b) M. G. Taylor, A. Rajpal and J. F. Kirsch, Protein Sci., 1998, 7, 1857–1867 CrossRef CAS PubMed.
- (a) P. Tolar, H. W. Sohn and S. K. Pierce, Nat. Immunol., 2005, 6, 1168–1176 CrossRef CAS PubMed; (b) P. Tolar, J. Hanna, P. D. Krueger and S. K. Pierce, Immunity, 2009, 30, 44–55 CrossRef CAS PubMed.
Footnotes |
| † Electronic supplementary information (ESI) available: Experimental section. See DOI: 10.1039/c5sc03404c |
| ‡ These authors contributed equally. |
| This journal is © The Royal Society of Chemistry 2016 |

![[thin space (1/6-em)]](https://www.rsc.org/images/entities/char_2009.gif) 309.2 ± 0.8 Da (cacld 14
309.2 ± 0.8 Da (cacld 14