 Open Access Article
Nucleic acid-selective light-up fluorescent biosensors for ratiometric two-photon imaging of the viscosity of live cells and tissues†
Dandan
Li‡
a,
Xiaohe
Tian‡
b,
Aidong
Wang
c,
Lijuan
Guan
d,
Jun
Zheng
a,
Fei
Li
a,
Shengli
Li
a,
Hongping
Zhou
a,
Jieying
Wu
a and
Yupeng
Tian
*a
aDepartment of Chemistry, Anhui University, Hefei, China. E-mail: yptian@ahu.edu.cn
bSchool of Life Science, Anhui University, Hefei, China
cHuangshan University, Huangshan, China
dDepartment of Chemistry, University College London, London, UK
First published on 21st December 2015
Abstract
Rational design of specific ratiometric viscosity probes with small molecular weight is a challenge in practical biotechnology applications. Herein two novel water-soluble, small-molecular ratiometric probes, bearing N-methyl benzothiazolium moiety (DSF and DBF), are designed for two-photon fluorescent imaging as a functional of local viscosity. The dye DSF, a light-up fluorescent probe, is sensitive to local viscosity and selectively stains nuclear DNA, which can be used to inspect asynchronous cells under confocal microscopy. While the dye DBF as a molecular rotor displays strong fluorescence enhancement in viscous media or binding to RNA. It exhibits dual absorption and emission as well, and only the red emission is markedly sensitive to viscosity changes, providing a ratiometric response and selectively imaging nucleolic and cytosolic RNA. Interestingly it is shown, for the first time, that the intracellular targeting and localization (DNA and RNA) of the two dyes are entirely realized simply by modifying the substituent attached to the benzothiazolium.
Introduction
The character of each component in a cellular system and their complex biological functions and processes has attracted increasing attention, and therefore better understanding of the selective staining/imaging of specific cellular organelles is of paramount importance.1 Since nucleic acid (NA) including DNA and RNA is the major source for storing, duplicating and transferring the genetic information in all eukaryotic cells,2,3 design tools in NA imaging have become of great interest.4–7 Commercial nuclear imaging agents8 such as DAPI, Hoechst 33342 (DNA) and SYTO-Select (RNA) probe require ultraviolet light as excitation source, resulting in significant autofluorescence and extensive photon toxicity.9,10 An attractive approach for the selective detection of NA in living samples is ratiometric imaging with two-photon microscopy (TPM). The former offers quantitative measurement and avoids most of the interferences from microenvironments; the latter gives deeper tissue penetration and an autofluorescence-free background.11–18 However, ratiometric two-photon absorption molecules generally possess large π-conjugated systems, resulting in relatively large molecular weight, and involve extensive synthesis procedures.19–24 Therefore, NA-specific ratiometric two-photon excited fluorescence (TPEF) probes with optimized two-photon action cross-section (Φδ) and appropriate biocapability (e.g. aqueous solubility, membrane permeability) are the next ideal image systems.Viscosity strongly influences intracellular substance transportation, biomacromolecule interactions, and reactive metabolite diffusion in live cells,25 and consequently abnormal viscosity variations strongly reflect many diseases and malfunctions.26–30 In recent years, “molecular rotors”, microviscosity-targeted fluorescent sensors, have gradually emerged with the application of fluorescence technology.31–36 Nevertheless, these sensors are unable to quantitatively determine intracellular microviscosity or its variations due to the influence of experimental and instrumental factors. Therefore, novel molecular rotors with dual emission maxima capable of quantifying viscosity37–41 in living samples and avoiding most of the interferences are indeed in demand.
Considering the above, two water-soluble small organic molecules with optimized two-photon action cross-section were designed. The introduction of N-methyl benzothiazolium moiety (as an acceptor A) and the ease of modifying the substituent attached to the benzothiazolium result in strong and concomitant optimization of both optical performances and NA binding parameters. A 2-(methylamino)ethanol unit acts as a donor (D) and its HO– group should tend to form strong hydrogen bonds with the other polar molecules around its microenvironment. It was found that a minor modification of the substituent attached to the benzothiazolium significantly alters the final subcellular destination. Consequently, this led to the identification of two novel TPEF probes called DSF and DBF having high affinity binding to nuclear DNA and intracellular RNA, respectively. Importantly, inside living cells and tissues, the viscosity changes, showing some regional difference, can be clearly observed by ratiometric two-photon imaging using two such probes. This is the first time that two 2PA fluorescent agents, which also offer in situ intracellular viscosity quantitation, have been applied to image DNA and RNA in living cells and tissues.
Results and discussion
Experimental
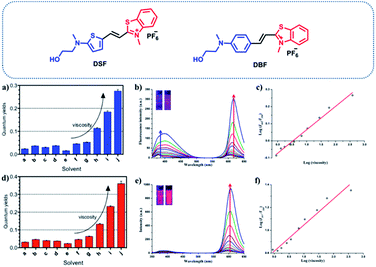
To further investigate their utility as molecular rotors for quantifying viscosity, the changes of fluorescence emission spectra for DSF and DBF as a function of the solvent viscosity were investigated. As illustrated in Fig. S3,† DSF exhibits two emission bands in aqueous solution. The red-emission band (λem(red) = 605 nm) increased much faster than the blue-emission band (λem(blue) = 380 nm) as the viscosity of the solution increased (Fig. 1b). In addition, the logarithm of the fluorescence ratio thereof (I605 nm/I380 nm) has a linear relationship with that of the viscosity (η) of the solution, which is as expected from the Förster–Hoffmann equation:43
log![[thin space (1/6-em)]](https://www.rsc.org/images/entities/char_2009.gif) If = C + x If = C + x![[thin space (1/6-em)]](https://www.rsc.org/images/entities/char_2009.gif) log log![[thin space (1/6-em)]](https://www.rsc.org/images/entities/char_2009.gif) η η |
![[thin space (1/6-em)]](https://www.rsc.org/images/entities/char_2009.gif) η were plotted accordingly (Fig. 1c, R2 = 0.99, slope x = 0.14). In addition, similar to DSF, DBF possesses a unique spectral character, with two emission peaks (such as λem = 380 and 597 nm in water, Fig. S3†). Most importantly, only the red emission of DBF responded significantly to the viscosity of the solvent. As shown in Fig. 1e, with increasing proportions of glycerol in the solvent mixture, the red fluorescence intensity at 597 nm increased sensitively with viscosity of the solvent. The blue emission at 380 nm, however, gave only very small responses. This permits ratiometric changes with a linear relationship between log(I597/I380) and log
η were plotted accordingly (Fig. 1c, R2 = 0.99, slope x = 0.14). In addition, similar to DSF, DBF possesses a unique spectral character, with two emission peaks (such as λem = 380 and 597 nm in water, Fig. S3†). Most importantly, only the red emission of DBF responded significantly to the viscosity of the solvent. As shown in Fig. 1e, with increasing proportions of glycerol in the solvent mixture, the red fluorescence intensity at 597 nm increased sensitively with viscosity of the solvent. The blue emission at 380 nm, however, gave only very small responses. This permits ratiometric changes with a linear relationship between log(I597/I380) and log![[thin space (1/6-em)]](https://www.rsc.org/images/entities/char_2009.gif) η, which is fitted by the Förster–Hoffmann equation. R2 of the linear relation increases in the water–glycerol system (Fig. 1f) was 0.96, and the slope x was 0.23. This indicated that DSF and DBF could be applied as ratiometric sensors to quantitatively detect the solution viscosity.
η, which is fitted by the Förster–Hoffmann equation. R2 of the linear relation increases in the water–glycerol system (Fig. 1f) was 0.96, and the slope x was 0.23. This indicated that DSF and DBF could be applied as ratiometric sensors to quantitatively detect the solution viscosity.
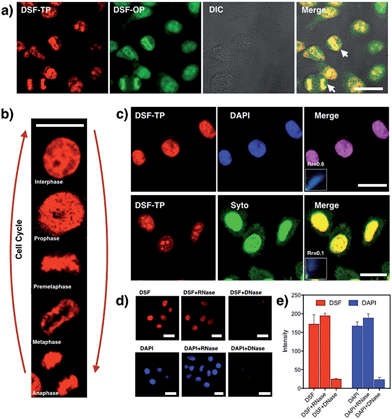
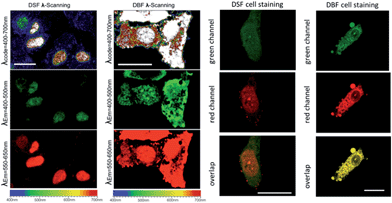
To establish the precise intracellular localization of DSF, co-staining experiments were performed. Incubation of HepG2 cells with DSF and co-staining with the membrane-permeable DAPI, a DNA minor-groove binder, shows strong co-localization of the two emission signals (Fig. 3c; Pearson's correlation coefficient: Rr = 0.60). Conversely, co-staining with SYTO 9, a general nucleic acid stain, shows a clear difference in localization (Rr = 0.10). In addition, deoxyribonuclease (DNase) and ribonuclease (RNase) digest experiments were also performed (Fig. 3d and e) to identify the species stained by DSF in the nucleus, while DAPI was also tested as control. Upon treatment with RNase, no significant loss of fluorescence in the nucleus occurred for DSF. By contrast, after DNase digestion, the nuclear fluorescence signals of DSF were completely lost. DSF exhibited a similar behavior in the digest experiment with DAPI, indicating that nuclear fluorescence originated from the binding of DSF with DNA in the nucleus. DNase/RNase digest experiments and co-staining with other commercially available fluorescent nuclear stains reveal that DSF is clearly targeting nuclear DNA in live cells.
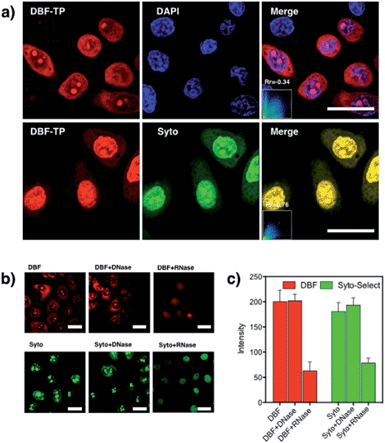
As is well known, the nucleolus contains abundant RNAs and proteins, especially ribosomal RNA and ribosomal proteins. To investigate the selectivity for RNA of DBF in cells, a digest test of RNase, which only hydrolyzes the RNA in the cell and does not influence the DNA, was performed (Fig. 4b). The only commercial RNA probe, SYTO RNA-Select, was also used as control. From Fig. 4b, the same as SYTO RNA-Select, in contrast to the untreated samples, the fluorescence of DBF in cytoplasm and nucleoli dramatically diminished and tended to redistribute to the nucleoli. In addition, upon treatment with DNase, no significant loss of fluorescence in the nucleus occurred for DBF and SYTO RNA-Select (Fig. 4c). The result indicates that DBF can selectively stain RNA in the nucleolus and cytoplasm, which would be of great advantage in the observation of RNA content and distribution and the visualization of nucleolus-related events.
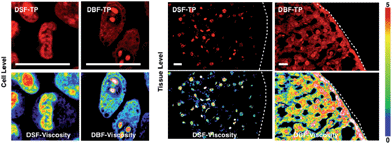
The above results showed that the two NA sensors as two-photon ratiometric rotors could be used to probe viscosity changes in vitro and ex vivo by ratiometric two-photon imaging. Additionally, the two rotors with dual emission maxima are capable of quantifying viscosity in cells and tissues, avoiding most of the interferences from the fluid optical properties, dye concentration, and other experimental or instrumental factors.
Considering that DSF and DBF both can bind to DNA, to understand more thoroughly the sequence selectivity of them, we studied them in the presence of the polynucleotides poly(dA-dT)2 and poly(dG-dC)2. As shown in Fig. S12,† the increase in fluorescence of DSF/DBF in the presence of the former is higher than the latter which is due to the AT displaying a more negative electrostatic potential as compared to other sequences, which is favorable to cation trapping.4 On the basis of the data discussed above, we conducted molecular modeling calculations53 using Discovery Studio 4.1 with duplex DNA fragment (duplex AT-rich DNA, base sequences CTTTTGCAAAAG/CTTTTGCAAAAG). The docking results (Fig. 7) indicate that DSF and DBF can bind to duplex DNA by intercalating DNA via the hydrogen bonding interactions of nucleobases (preferably to A ≡ T, which is in agreement with the results of fluorescence spectra change of DSF/DBF in the presence of polynucleotides poly(dA-dT)2 and poly(dG-dC)2). In addition, as shown in Table S4,† DSF binds to DNA with higher affinity (lower CDOCKER energy) which might be due to DSF interacting with the base pairs of DNA via hydrogen bonds in different directions (Fig. S14†), resulting in DSF being inserted inside DNA in a stable configuration. While, as shown in Fig. S15,† DBF interacts with the base pairs of DNA by hydrogen bonds in the same direction and in the action of the same force field, so the structure of DBF binding to DNA will be twisted.
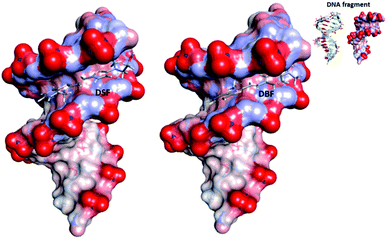 | ||
| Fig. 7 Models obtained after molecular modeling of the interaction of DSF and DBF with DNA fragment. Inset: the structure of the corresponding DNA fragment. | ||
The knowledge of the interaction mechanism between RNA and fluorescent probes is still not enough compared with the much deeper understanding of DNA biosensors. Besides, compared to the many fluorescent probes imaging DNA, the mechanisms of RNA probes for cell imaging are rarely reported. Molecular Probes Co., which sells various DNA probes such as DAPI, series of Hoechsts, and propidium iodide, only offers the classical commercial RNA probe “SYTO RNA-Select” for imaging RNA in living cells, but its chemical structure has not been described. Also, it is not very clear why just by changing the linker thiophene (DSF) to phenyl (DBF) the binding selectivity changes from DNA to RNA. Considering the results of molecular modeling calculations for DBF and DNA fragment, it is tentatively suggested that the difference may be due to the fact that (i) some specificity of intracellular distribution and organization of RNA and DNA molecules can cause a difference in the affinity of dye DSF or DBF to DNA and RNA inside cells and (ii) DBF interacts with the base pairs of RNA by hydrogen bonds in the same direction (similar to DNA binding) and in the action of the same force field, and the structure of DBF binding to RNA will be twisted into stable crescent-shape configuration. DBF exhibits much stronger binding affinity toward RNA than DNA in a buffer solution and selectively stains and targets RNA in cells which might be attributable to crescent-shape molecules with positive charges preferring binding with RNA.54,55 As mentioned above, DSF is clearly targeting nuclear DNA and DBF selectively stains RNA in living cells. Because of the ease of modifying the substituent attached to the thiazole, the intracellular targeting and localization properties of the two dyes are entirely different. These findings suggest that a variation of substituent attached to the benzothiazolium moiety can greatly vary the binding interaction with NA and thus provide a tool to fine-tune the targeting and localization properties of organic molecules as effective organelle-specific TPEF probes.
Conclusions
In summary, two water-soluble small organic ratiometric molecules with optimized two-photon action cross-section were developed. Because of the ease of modifying the substituent attached to the benzothiazolium moiety, the targeting and localization properties can be easily tuned and optimized for the organic molecules as effective organelle-specific TPEF probes. The two novel TPEF probes called DSF and DBF bind to nuclear DNA and RNA in the nucleolus and cytoplasm with high affinity, respectively. Importantly, the two unique fluorescent nucleic acid light-up probes as two-photon ratiometric rotors can be used for quantifying and imaging intracellular viscosity in living cells and tissues. Their advantages of exclusive NA-selective staining of living cells, high signal ratio, excitation with NIR light, good photostability, as well as low cytotoxicity at imaging concentration, promise potential applications of DSF and DBF in biological and biomedical research.Acknowledgements
This work was supported by the National Natural Science Foundation of China (21271004, 51372003, 51432001, 21271003, 51472002 and 51402001), Focus on returned overseas scholar of Ministry of Education of China, the Higher Education Revitalization Plan Talent Project (2013), and Anhui University Doctor Startup Fund (J01001962). The work of molecular modeling calculations on Discovery Studio (Dassault Systèmes BIOVIA, Discovery Studio Modeling Environment, Release 4.5, San Diego: Dassault Systèmes, 2015) was contributed by Professor Aidong Wang from Huangshan University, China.Notes and references
- I. B. Buchwalow and W. Böcker, Immunohistochemistry: Basics and Methods, Springer, Berlin, 2010 Search PubMed.
- A. Z. Medvedev, Adv. Gerontol. Res., 1964, 21, 181–206 Search PubMed.
- J. Brachet, Prog. Biophys. Mol. Biol., 1965, 15, 95–127 CrossRef.
- B. Dumat, G. Bordeau, E. Faurel-Paul, F. Mahuteau-Betzer, N. Saettel, G. Metge, C. Fiorini-Debuisschert, F. Charra and M. P. Teulade-Fichou, J. Am. Chem. Soc., 2013, 135, 12697–12706 CrossRef CAS PubMed.
- L. Guo, M. S. Chan, D. Xu, D. Y. Tam, F. Bolze, P. K. Lo and M. S. Wong, ACS Chem. Biol., 2015, 10, 1171–1175 CrossRef CAS PubMed.
- P. Hanczyc, B. Norden and M. Samoc, Dalton Trans., 2012, 41, 3123–3125 RSC.
- X. Liu, Y. Sun, Y. Zhang, F. Miao, G. Wang, H. Zhao, X. Yu, H. Liu and W. Y. Wong, Org. Biomol. Chem., 2011, 9, 3615–3618 CAS.
- Invitrogen Home pages, A Guide to Fluorescent Probes and Labelling Technologies, ed. R. P. Haugland, Molecular Probes, Eugene, OR, 10th edn, 2005, pp. 397–405, http://www.probes.com and http://www.invitrogen.com Search PubMed.
- G. P. Pfeifer, Y. H. You and A. Besaratinia, Mutat. Res., 2005, 571, 19–31 CrossRef CAS PubMed.
- H. M. Kim and B. R. Cho, Chem. Rev., 2015, 115, 5014–5055 CrossRef CAS PubMed.
- W. R. Zipfel, R. M. Williams and W. W. Webb, Nat. Biotechnol., 2003, 21, 1369–1377 CrossRef CAS PubMed.
- F. Helmchen and W. Denk, Nat. Methods, 2005, 2, 932–940 CrossRef CAS PubMed.
- R. M. Williams, W. R. Zipfel and W. W. Webb, Curr. Opin. Chem. Biol., 2001, 5, 603–608 CrossRef PubMed.
- L. Guo and M. S. Wong, Adv. Mater., 2014, 26, 5400–5428 CrossRef PubMed.
- H. M. Kim, B. H. Jeong, J. Y. Hyon, M. J. An, M. S. Seo, J. H. Hong, K. J. Lee, C. H. Kim, T. Joo, S. C. Hong and B. R. Cho, J. Am. Chem. Soc., 2008, 130, 4246–4247 CrossRef PubMed.
- X. H. Wang, D. M. Nguyen, C. O. Yanez, L. Rodriguez, H. Y. Ahn, M. V. Bondar and K. D. Belfield, J. Am. Chem. Soc., 2010, 132, 12237–12239 CrossRef CAS PubMed.
- J. H. Han, S. K. Park, C. S. Lim, M. K. Park, H. J. Kim, H. M. Kim and B. R. Cho, Chem.–Eur. J., 2012, 18, 15246–15249 CrossRef CAS PubMed.
- W. Yang, P. S. Chan, M. S. Chan, K. F. Li, P. K. Lo, N. K. Mak, K. W. Cheah and M. S. Wong, Chem. Commun., 2013, 49, 3428–3430 RSC.
- K. P. Divya, S. Sreejith, P. Ashokkumar, K. Yuzhan, Q. Peng, S. K. Maji, Y. Tong, H. Yu, Y. Zhao, P. Ramamurthy and A. Ajayaghosh, Chem. Sci., 2014, 5, 3469–3474 RSC.
- L. Yuan, F. Jin, Z. Zeng, C. Liu, S. Luo and J. Wu, Chem. Sci., 2015, 6, 2360–2365 RSC.
- C. S. Lim, G. Masanta, H. J. Kim, J. H. Han, H. M. Kim and B. R. Cho, J. Am. Chem. Soc., 2011, 133, 11132–11135 CrossRef CAS PubMed.
- S. K. Bae, C. H. Heo, D. J. Choi, D. Sen, E. H. Joe, B. R. Cho and H. M. Kim, J. Am. Chem. Soc., 2013, 135, 9915–9923 CrossRef CAS PubMed.
- H. J. Kim, C. H. Heo and H. M. Kim, J. Am. Chem. Soc., 2013, 135, 17969–17977 CrossRef CAS PubMed.
- L. Zhou, X. Zhang, Q. Wang, Y. Lv, G. Mao, A. Luo, Y. Wu, Y. Wu, J. Zhang and W. Tan, J. Am. Chem. Soc., 2014, 136, 9838–9841 CrossRef CAS PubMed.
- S. T. Ohnishi and T. Ohnishi, Membrane Abnormalities in Sickle Cell Disease and in Other Red Blood Cell Disorders, CRC Press, Boca Raton, Florida, 1994 Search PubMed.
- J. Harkness, Biorheology, 1971, 8, 171–193 CAS.
- M. J. Stutts, C. M. Canessa, J. C. Olsen, M. Hamrick, J. A. Cohn, B. C. Rossier and R. C. Boucher, Science, 1995, 269, 847–850 CrossRef CAS PubMed.
- P. M. Moriarty and C. A. Gibson, Cardiovasc. Rev. Rep., 2003, 24, 321–325 CAS.
- S. Alain, G. Jérôme, C. Gilles, M. Jean-Louis and L. Jaime, J. Hypertens., 2002, 20, 159–169 CrossRef.
- I. Uchimura and F. Numano, Diabetes Front., 1997, 8, 33–37 CAS.
- R. O. Loutfy and B. A. Arnold, J. Phys. Chem., 1982, 86, 4205–4211 CrossRef CAS.
- M. A. Haidekker, T. T. Ling, M. Anglo, H. Y. Stevens, J. A. Frangos and E. A. Theodorakis, Chem. Biol., 2001, 8, 123–131 CrossRef CAS PubMed.
- B. D. Allen, A. C. Benniston, A. Harriman, S. A. Rostron and C. Yu, Phys. Chem. Chem. Phys., 2005, 7, 3035–3040 RSC.
- M. A. H. Alamiry, A. C. Benniston, G. Copley, K. J. Elliott, A. Harriman, B. Stewart and Y. G. Zhi, Chem. Mater., 2008, 20, 4024–4032 CrossRef CAS.
- X. Yin, Y. Li, Y. Zhu, X. Jing, Y. Li and D. Zhu, Dalton Trans., 2010, 39, 9929–9935 RSC.
- F. Zhou, J. Shao, Y. Yang, J. Zhao, H. Guo, X. Li, S. Ji and Z. Zhang, Eur. J. Org. Chem., 2011, 4773–4787 CAS.
- H. S. Guo, P. Zhu, F. Guo, X. L. Li, X. L. Wu, X. Y. Fan, L. Wen and F. C. Tang, Nat. Protoc., 2015, 10, 645–659 CrossRef CAS PubMed.
- F. Liu, T. Wu, J. Cao, S. Cui, Z. Yang, X. Qiang, S. Sun, F. Song, J. Fan, J. Wang and X. Peng, Chem.–Eur. J., 2013, 19, 1548–1553 CrossRef CAS PubMed.
- D. Fischer, E. A. Theodorakis and M. A. Haidekker, Nat. Protoc., 2007, 2, 227–236 CrossRef PubMed.
- X. Peng, Z. Yang, J. Wang, J. Fan, Y. He, F. Song, B. Wang, S. Sun, J. Qu, J. Qi and M. Yan, J. Am. Chem. Soc., 2011, 133, 6626–6635 CrossRef CAS PubMed.
- Z. Yang, J. Cao, Y. He, J. H. Yang, T. Kim, X. Peng and J. S. Kim, Chem. Soc. Rev., 2014, 43, 4563–4601 RSC.
- M. A. Haidekker, T. P. Brady, D. Lichlyter and E. A. Theodorakis, Bioorg. Chem., 2005, 33, 415–425 CrossRef CAS PubMed.
- T. Förster and Z. G. Z. Hoffmann, Phys. Chem., 1971, 75, 63–76 Search PubMed.
- B. J. Coe, J. A. Harris, I. Asselberghs, K. Wostyn, K. Clays, A. Persoons, B. S. Brunschwig, S. J. Coles, T. Gelbrich, M. E. Light, M. B. Hursthouse and K. Nakatani, Adv. Funct. Mater., 2003, 13, 347–357 CrossRef CAS.
- G. S. He, J. Zhu, A. Baev, M. Samoc, D. L. Frattarelli, N. Watanabe, A. Facchetti, H. Agren, T. J. Marks and P. N. Prasad, J. Am. Chem. Soc., 2011, 133, 6675–6680 CrossRef CAS PubMed.
- Q. Zheng, H. Zhu, S. C. Chen, C. Tang, E. Ma and X. Chen, Nat. Photonics, 2013, 7, 234–239 CrossRef CAS.
- M. R. Gill, J. Garcia-Lara, S. J. Foster, C. Smythe, G. Battaglia and J. A. Thomas, Nat. Chem., 2009, 1, 662–667 CrossRef CAS PubMed.
- X. Wang, X. Tian, Q. Zhang, P. Sun, J. Wu, H. Zhou, B. Jin, J. Yang, S. Zhang, C. Wang, X. Tao, M. Jiang and Y. Tian, Chem. Mater., 2012, 24, 954–961 CrossRef CAS.
- R. Indumathy, S. Radhika, M. Kanthimathi, T. Weyhermuller and B. Unni Nair, J. Inorg. Biochem., 2007, 101, 434–443 CrossRef CAS PubMed.
- B. Zhou, W. Liu, H. Zhang, J. Wu, S. Liu, H. Xu and P. Wang, Biosens. Bioelectron., 2015, 68, 189–196 CrossRef CAS PubMed.
- G. Song, Y. Sun, Y. Liu, X. Wang, M. Chen, F. Miao, W. Zhang, X. Yu and J. Jin, Biomaterials, 2014, 35, 2103–2112 CrossRef CAS PubMed.
- B. Dumat, G. Bordeau, A. I. Aranda, F. Mahuteau-Betzer, Y. El Harfouch, G. Metge, F. Charra, C. Fiorini-Debuisschert and M. P. Teulade-Fichou, Org. Biomol. Chem., 2012, 10, 6054–6061 CAS.
- G. Wu, D. H. Robertson, C. L. Brooks III and M. Vieth, J. Comput. Chem., 2003, 24, 1549–1562 CrossRef CAS PubMed.
- O. P. Cetinkol and N. V. Hud, Nucleic Acids Res., 2009, 37, 611–621 CrossRef CAS PubMed.
- R. Sinha and G. S. Kumar, J. Phys. Chem. B, 2009, 113, 13410–13420 CrossRef CAS PubMed.
Footnotes |
| † Electronic supplementary information (ESI) available: The detailed synthetic processes, fully characterizations of the two dyes. The crystal structural and DNA binding information of DSF. The water solubility, pH effect, cytotoxicity and photostability of DSF and DBF. CCDC 1432097. For ESI and crystallographic data in CIF or other electronic format see DOI: 10.1039/c5sc03956h |
| ‡ These authors contributed equally. |
| This journal is © The Royal Society of Chemistry 2016 |

