 Open Access Article
Ab initio study of PbCr(1−x)SxO4 solid solution: an inside look at Van Gogh Yellow degradation†
Ana B.
Muñoz-García
 *,
Arianna
Massaro
and
Michele
Pavone

Department of Chemical Sciences, University of Naples Federico II, Comp. Univ. Monte Sant'Angelo Via Cintia 21, 80126 Naples, Italy. E-mail: anabelen.munozgarcia@unina.it
First published on 10th March 2016
Abstract
Van Gogh Yellow refers to a family of lead chromate pigments widely used in the 19th century and often mixed with lead sulfate to obtain different yellow hues. Unfortunately, some paintings, such as the famous Sunflowers series, suffered degradation problems due to photoactivated darkening of once bright yellow areas, especially when irradiated with UV light. Recent advanced spectroscopic analyses have proved that this process occurs mostly where the pigment presents a sulfur-rich orthorhombic phase of a PbCr(1−x)SxO4 solid solution, while chromium-rich monoclinic phases are lightfast. However, the question of whether degradation is purely a surface phenomenon or if the bulk properties of sulfur-rich pigments trigger the process is still open. Here, we use first-principles calculations to unveil the role of sulfur in determining important bulk features such as structure, stability, and optical properties. From our findings, we suggest that degradation occurs via an initial local segregation of lead sulfate that absorbs at UV light wavelengths and provides the necessary energy for subsequent reduction of chromate ions into the greenish chromic oxide detected in experiments. In perspective, our results set reliable scientific foundations for further studies on surface browning phenomena and can help to chose the best strategy for the proper conservation of art masterpieces.
Born on March 30, 1853 in Groot-Zundert, Netherlands, Vincent Van Gogh is considered today as the greatest Dutch painter after Rembrandt, although he remained poor and virtually unknown all throughout his life. It is generally believed that Van Gogh struggled with mental illness and that those problems led him to an early death by suicide when he was only 37, but there is no consensus on a specific diagnosis. Likely, these disorders triggered his creativity and influenced his art. To counteract his epilepsy, anxiety and depression, Van Gogh drank absinthe, a toxic alcoholic drink, popular with many artists at the time, containing the toxin thujone. Besides aggravating mental symptoms, thujone can also cause one to see objects in yellow (xanthopsia). Whether this substance caused Van Gogh's affinity with yellow or not,1 the dominance of vibrant yellows in several paintings after 1886 exists and was declared by the artist himself in his letters to his brother Theo: Van Gogh aimed at “a sun flooding everything with a light of pure gold”.2
Van Gogh Yellow (VGY) refers to a family of inorganic pigments based on the yellow mineral crocoite (lead chromate, PbCrO4), whether pure or mixed with the white mineral anglesite (lead sulfate, PbSO4), that add a paler hue to pure chromate. The resulting pigment, considered as a PbCr(1−x)SxO4 solid solution, presents a yellow-orange colour for low sulfur content (x < 0.1) and a pale yellow colour with increasing sulfur concentration (x > 0.5). Unfortunately, VGY pigments show a tendency to lose their bright colours rapidly, gradually turning greenish-brown when exposed to sunlight. This degradation, already spotted by Van Gogh himself,2 can be noticed just by comparing two versions of his famous Sunflowers, as shown in Fig. 1.
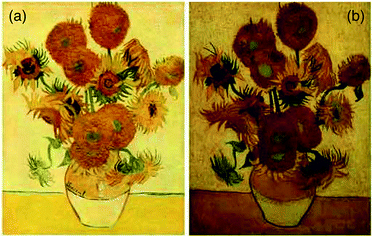 | ||
| Fig. 1 Two versions of Sunflowers by Vincent Van Gogh; (a) 1888, National Gallery, London, UK; (b) 1889, Van Gogh Museum, Amsterdam, The Netherlands. | ||
Recent analytical studies have addressed the degradation of VGY, both in its synthetic form and in samples from original Van Gogh paintings.3–10 With X-ray spectro-microscopy and related methods, authors have found a surface alteration layer containing significant amounts of Cr(III), thus ascribing VGY darkening to the partial reduction of Cr(VI). Among all synthetic and original samples, the most sulfur-rich ones showed the highest tendency toward browning. Thereby, sulfur is supposed to play a key role in the degradation process. Moreover, degradation of model samples requires irradiation with either UV-visible, UV or blue light, while red light is insufficient to trigger the process.6 Further work has reported spectroscopic studies on surface coatings, where a certain percentage of Cr(III) was observed, not only at the paint–coating interface, but also inside the varnish/wax layers as dispersed micro-grains. This experimental evidence suggests that BaSO4 and ZnS coatings are useless, since degradation occurred anyway and a diffusion of degraded particles into the coating happened. The authors hypothesize a process in which PbCrO4 degrades through dissolution of CrO42− ions, which react with the organic binder of the paint and then precipitate as greenish Cr2O3 at the top layer.10
While the faster degradation of sulfur-rich VGY than sulfur-poor samples and the formation of Cr2O3 species have become clear through these experiments, there are still many open questions on VGY darkening. Why does the presence of sulfur induce degradation? To what extent is the observed surface degradation independent of VGY bulk structure? In other words, are there any bulk features that trigger VGY degradation?
Understanding the origin and mechanisms of VGY degradation can provide the answers to these questions, with new hints for the safe storage and restoration of important paintings. To this end, complementary to spectroscopic and analytical studies, ab initio computational methods are valuable tools to identify the structure–property relationships that determine the chemical and optical properties of VGY.11–13
Here, we report the results of a systematic first-principles study on the structural, electronic and energetic features of the complex VGY pigment. While a few theoretical works have addressed lead chromate electronic structure for photoelectrocatalysis,14,15 to the best of our knowledge, there have been no computational studies on the VGY lead chromate-sulfate solid solution yet. Thus, we performed spin-polarized Kohn–Sham density functional theory (DFT)16,17 calculations to address three main properties of VGY PbCr(1−x)SxO4 solid solutions of increasing sulfur content (0 ≤ x ≤ 1): the crystal structures and relative stability, the solid solution formation energies, and the corresponding VGY colour variations, i.e. the electronic structure features.
The reliable prediction of bulk structural properties is key to study the ion migration and surface reactions that have been proposed to explain VGY browning. DFT is a workhorse method for solid-state materials, but an approximated exchange-correlation density functional should be carefully tested for the system and for the property of interest. Indeed, we found that a standard periodic DFT, based on the Perdew–Burke–Ernzerhof (PBE) exchange-correlation density functional,18 failed in describing the correct VGY structural features. Since PbCrO4 exists in both monoclinic and orthorhombic phases and PbSO4 only presents an orthorhombic structure, we focused on determining the different crystal forms of the PbCr(1−x)SxO4 solid solution. Raman experiments reported that the sulfate-poor samples (x < 0.4) present a monoclinic phase, with the orthorhombic fraction becoming higher with increasing sulfur content (x ≤ 0.5), while sulfate-rich samples (x > 0.8) are mostly formed in the orthorhombic phase.3,5 These results were confirmed by X-ray studies, but no solid solution structure has been found for 0.5 < x < 0.8.3
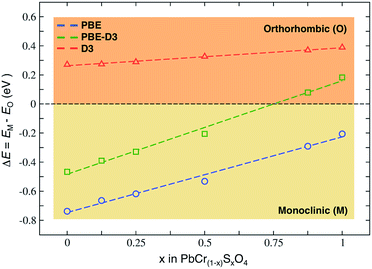
We performed structural optimizations of PbCr(1−x)SxO4 (with x = 0, 0.125, 0.25, 0.5, 0.875 and 1) in both monoclinic and orthorhombic phases. The PBE density functional incorrectly predicts the monoclinic phase to always be the most stable (Fig. 2). When long-range non-covalent van der Waals forces are properly described by dispersion-corrected DFT (PBE-D3),19–21 we obtain the correct trend with orthorhombic phase that becomes the most stable with high sulfur contents.
This result highlights the importance of dispersion forces also in the context of solid-state ionic systems, especially when subtle phase equilibria are in action. While in molecular sciences DFT-D based approaches are well established,19–21 non-covalent dispersive interactions are often underestimated when modelling inorganic extended materials.22,23
In VGY, PBE failure can be ascribed to the known tendency to favour wider structures that minimize the repulsive nature of the self-interaction term. The monoclinic phase always has a larger unit cell volume than the orthorhombic, as seen from the computed minimum energy volumes reported in the ESI.†
Besides delivering lattice constants very close to experimental ones, PBE-D3 predicts more compact volumes than PBE and the relative energies between the two phases are consistent with experimental observations: the dispersion interactions always favour the orthorhombic phase (red line in Fig. 2). The final ordering with respect to sulfur content reflects the balance between two opposite factors; the higher repulsion between the large sized chromate anions (240 pm) than sulfate (230 pm),24 and the maximization of dispersive attractive interactions in the more compact orthorhombic crystal.
We evaluated the stability of the PbCr(1−x)SxO4 solid solutions according to the reaction:
| (1 − x)PbCrO4 + xPbSO4 ⇒ PbCr(1−x)SxO4 | (1) |
We considered all values of x that were detected by experiments (as in the former section, x = 0, 0.125, 0.25, 0.5, 0.875 and 1), in monoclinic (M) and/or orthorhombic (O) phases, plus x = 0.75, which was not observed. Actually, in-house synthesized VGY powders with a 0.25![[thin space (1/6-em)]](https://www.rsc.org/images/entities/char_2009.gif) :
:![[thin space (1/6-em)]](https://www.rsc.org/images/entities/char_2009.gif) 0.75 Cr
0.75 Cr![[thin space (1/6-em)]](https://www.rsc.org/images/entities/char_2009.gif) :
:![[thin space (1/6-em)]](https://www.rsc.org/images/entities/char_2009.gif) S ratio did not present the expected stoichiometry, but resulted in a mixture of PbCr0.6S0.4O4 (M), PbCr0.1S0.9O4 (O), and PbSO4 (O) in relative percentages of 11%, 75% and 14%.3 The computed formation energies have been calculated according to the formula:
S ratio did not present the expected stoichiometry, but resulted in a mixture of PbCr0.6S0.4O4 (M), PbCr0.1S0.9O4 (O), and PbSO4 (O) in relative percentages of 11%, 75% and 14%.3 The computed formation energies have been calculated according to the formula:
| ΔEform = EVGY − [(1 − x)EPbCrO4] − [xEPbSO4] | (2) |
Fig. 3 shows the main results of this analysis.
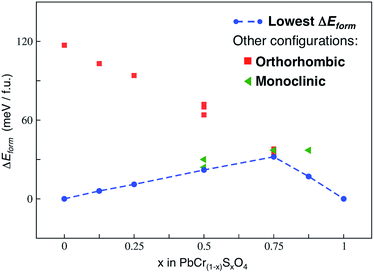 | ||
| Fig. 3 Formation energies (ΔEform) calculated at the PBE-D3 level of theory, according to eqn (2), for all the x values of the VGY solid solution. The lowest formation energies are displayed by the dashed blue line and define the so-called lowest hull. | ||
We neglected vibrational effects and configurational entropy in this study: previous works on similar transition metal oxide solid solutions have shown that vibrational effects on the free energy of mixing are negligible, particularly at room temperature.25 As well, by estimating the maximum configurational entropy for our solid solution (Smax, according to eqn (10) in ref. 25), at room temperature we found that −TΔSmax values do not alter the ΔEform trend in Fig. 3.
The hull (line connecting the lowest energy configurations of each VGY composition) has a concave shape: in the range of all x values our calculations predicted positive (unfavourable) formation energies. This indicates a potential miscibility gap and a phase-separation tendency in the solid solution at low temperatures, which is in agreement with the PbSO4–PbcrO4 core–shell particles detected in original samples of VGY.10 Our calculations predict a pronounced maximum for x = 0.75, which is, precisely, the composition that is not found experimentally. When chromate and sulfate anions are both present in VGY (e.g., x = 0.5), the analysis of the most stable structures shows a segregated configuration to be preferred over a more uniform (isotropic) distribution of the anions in the unit cells (see figures in the ESI†). These findings qualitatively prove the tendency of the lead chromate-sulfate solid solution to be unstable and prone to separation into its two parent materials. Indeed, this also affects the overall electronic structure and optical properties, as discussed below.
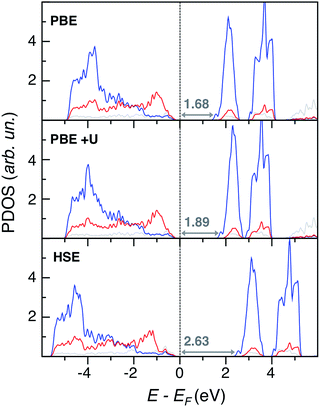
Regarding electronic structure and optical properties, DFT is a ground state theory and underestimates the optical band gap in extended materials, as well as the HOMO–LUMO gap in molecular systems. Despite this well-known drawback,23 DFT-based analysis of electronic structure features can still provide informative insights, especially when using more refined methods than standard PBE. To this end, we performed single point calculations at different levels of theory on the VGY minimum energy crystal structures optimized at the PBE-D3 level. Together with PBE, we performed PBE+U calculations26 with a U–J value equal to 3.2 eV on Cr d states.27 In principle, the formal charge of Cr (+6) implies that there are no d electrons, but we found a strong hybridization between Cr d and O p states (see the Bader AIM effective charge analysis28 in the ESI†) and, therefore, Cr d orbitals cannot be considered totally empty. We also performed hybrid Hartree–Fock DFT calculations with the HSE functional.29 The resulting atom and angular momentum-projected density of states (PDOS) plots are shown in Fig. 4.
Overall, the three methods yield qualitatively consistent results by describing an extended overlap of Cr d and O p states at the valence band edge (VB), while the conduction band edge (CB) is mainly populated by Cr d states. We also report in Fig. 4 the predicted eigenvalue gaps (Eg), which are not a direct prediction of the experimental optical transition energies, but still represent a reliable estimate of the material band gap. As expected, the PBE significantly underestimates the experimental value, Eg(PbCrO4, optical) = 2.3 eV.15 With an ad hoc correction for the self-interaction error, the PBE+U band gap is closer to the experimental value than PBE but is still low. On the other hand, the hybrid HSE method predicts too large a band gap, which means a too ionic character. We achieved the best band gap estimate with the non-self-consistent Green-function method (G0W0):30 the predicted quasi particle band gap Eg(G0W0) = 2.29 eV is in nice agreement with experiment, even if the G0W0 result should be compared to the photoelectron spectroscopy (PES) and inverse PES (IPES) bandgap rather than to the optical one.
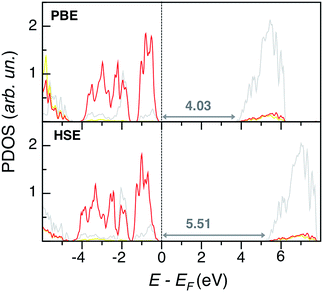
PbSO4 electronic structural features are depicted in PDOS plots at the PBE and HSE levels of theory in Fig. 5. Both methods predict similar band edge features, which present no states from sulfur: the VB and CB are mostly populated by O p and Pb d states, respectively, while S states are very internal and far from the Fermi level. Also in this case, PBE slightly underestimates the experimental band gap of 4.2 eV.31 While HSE predicts a too large band gap, the G0W0 results are the closest to experiment, Eg(G0W0) = 4.13 eV.
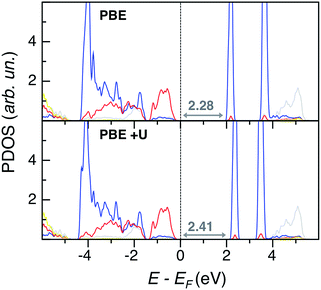
The G0W0 band gap values match nicely with the experimental ones, but this method is too computationally demanding for a systematic study of the lead chromate-sulfate solid solution, with larger super-cells than the PbCrO4 and PbSO4 unit cells, and with many possible chromate-sulfate configurations. HSE, with the inclusion of non-local exchange, predicts too ionic systems with too large band gap values. Thus, we opted for the less expensive PBE+U single point calculations to obtain a qualitative trend of band gap values for the entire solid solution (see Table S5 in the ESI†). Eigenvalue gap values slightly widen with increasing S content, with larger values in the orthorhombic than in the monoclinic phase. However, within all the explored range of x, VGY band gap values are never much larger than in PbCrO4 (with a maximum deviation of 0.4 eV). The origin of this behavior is clearly shown by the PDOS plot of PbCr0.125S0.875O4 (x = 0.875) depicted in Fig. 6: even for the highest S content, the VB and CB edges have the same character as in PbCrO4 (Fig. 4), sulfur states are quite low in energy and are not present at the band edges, as in pristine PbSO4. These electronic structure features are common for all x values, as shown in the ESI.†
To locate the predicted VGY band gap values in the electromagnetic spectrum, we related the PBE+U eigenvalue gap values of the solid solution with the more reliable G0W0 values of pristine PbCrO4, according to a simple scaling function:
| Eg(x) = Eg(G0W0)(PbCrO4)[Eg(PBE+U)(x)/Eg(PBE+U)(PbCrO4)] | (3) |
We chose PbCrO4 (and not PbSO4) for scaling purposes because of the similarities in band edge characters between the solid solution (at any S contents) and PbCrO4, as shown before. Thus, we assume that the PbCrO4 band gap computed with G0W0 would increase by the same factor as the PbCr(1−x)SxO4 one with respect to PbCrO4 as calculated at the PBE+U level of theory. The results are shown in Fig. 7, together with the G0W0 data for PbCrO4 and PbSO4. This result shows that all VGY solid solutions, even at the highest sulfur content (x = 0.875), would still deliver a non-white colour.
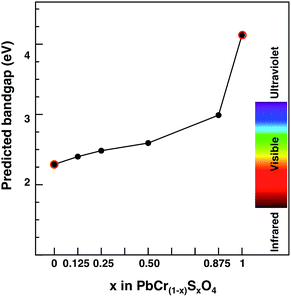 | ||
| Fig. 7 Predicted band gap for the PbCr(1−x)SxO4 solid solution as a function of sulfur content (x). Red circled dots indicate G0W0 predicted values. Black dots indicate PBE+U values scaled according to eqn (3); monoclinic (orthorhombic) most stable cells are considered for x ≤ 0.5 (x > 0.5). | ||
Conclusions
The present work reports an ab initio study on the structure, optical properties and stability of Van Gogh Yellow (VGY), i.e. the PbCr(1−x)SxO4 solid solution. VGY is an inorganic pigment dominating Vincent Van Gogh's paintings of his late period (1886 to 1890), many of which suffer from darkening of yellow areas after exposure to sunlight.Following a series of experimental studies on the composition and optical properties of the VGY solid solution with different sulfur contents, we performed first-principles calculations on VGY bulk properties in order to understand VGY structure–property relationships from an atomistic perspective, and to determine whether degradation has its origin in VGY bulk features or is purely due to surface processes.
We found that the inclusion of dispersion corrections (DFT-D) is mandatory for reliable structural predictions, because standard semi-local density functional approximations fail in describing the experimental structural transitions from monoclinic to orthorhombic at increasing S contents. In particular, PBE-D3 provided the correct phase ordering with equilibrium lattice parameters within 1% of the experimental values.
Regarding optical properties, we computed the lead chromate and sulfate eigenvalue gap values at PBE, PBE+U and HSE levels of theory, as well as the G0W0 quasi-particle gaps. While PBE and PBE+U values are slightly smaller than experimental ones, the HSE values are too large. As expected, G0W0 values are the most accurate, but the balance of accuracy and computation time is much more convenient with PBE/PBE+U. Our calculations on the PbCr(1−x)SxO4 solid solution show that band gap increases as x increases and it is also larger in orthorhombic than in monoclinic forms. However, even at the highest sulfur content, the VGY band gap lies within the visible range (1.7–3.5 eV).
We also analyzed the thermodynamic stability of VGY solid solution by means of a lowest hull plot, i.e. the line connecting the lowest phases in the formation energy versus composition curve. All the solid solution compounds are less stable than PbCrO4 and PbSO4 parent materials. Thus, the chemical composition of VGY can affect its long term stability already in the bulk state, even before surface photocatalytic and/or redox reactions occur.
Overall, our results offer a possible explanation of why the degradation (browning) of VGY is promoted by high sulfur contents and UV radiation.4,10 The presence of significant sulfur amounts in VGY (and so the synthesis and preparation of the pigment) represents a possible cause of instability leading to long-term separation into PbCrO4 and PbSO4. The paler hues of VGY than pure PbCrO4 are not dependent on a sulfur-driven band gap change, but are due to formation of a nano-composite with white anglesite and yellow crocoite phases. These locally segregated lead sulfate phases are the ones responsible for absorbing UV light, thus providing the necessary energy to reduce the lead chromate at the VGY surface into greenish chromic oxide.
In perspective, our results set the necessary foundations for further studies on surface phenomena involved in the VGY darkening mechanism and for identifying possible recovery strategies.
Methods and computational details
DFT calculations were performed with the Vienna ab initio Simulation Package (VASP 5.3.2).32,33 We adopted the Perdew–Burke–Ernzerhof (PBE) generalized gradient approximation (GGA) for the exchange and correlation functional.18 Nuclei and core electrons were described by projector augmented-wave (PAW) potentials34 (medium hardness for O). The Pb 5d106s26p2, Cr 3d54s1, S 3s23p4, and O 2s22p4 valence electrons were described by a plane-wave basis set with a kinetic energy cut-off of 800 eV. We used a 4 × 4 × 4/4 × 4 × 6 Γ k-point sampling for calculations of the monoclinic/orthorhombic unit cells of PbBO4 (B = Cr, S). For the 2 × 1 × 1 monoclinic and 1 × 2 × 1 orthorhombic super-cells, we used 2 × 4 × 4 and 4 × 2 × 6 Γ k-point sampling, respectively. We set Gaussian smearing (σ = 0.05 eV) for integration over the first Brillouin zone. With the chosen cut-off energy and k-point sampling we achieved convergence of total energies within 1 meV per formula unit. For all the systems, we optimized both the lattice parameters and all the ion positions without any symmetry constraints until the total force on each atom was <0.01 eV Å−1. Dispersion interactions have been accounted for via the DFT-D3 scheme, recently proposed by Grimme19 and in particular, we have applied the D3(BJ) scheme with the Becke–Johnson damping function.20 Electronic structure features of PbCrO4 and PbSO4 have been computed at different levels of theory: the hybrid DFT functional by Heyd–Scuseria–Ernzerhof (HSE)29 and the non-self-consistent GW approximation (G0W0) as implemented in VASP.30 Moreover, we tested the DFT+U approach26 for lead chromate, setting a U–J potential for Cr d states of 3.2 eV, as it should be when chromate will be reduced to chromic oxide.27 Further details on the structural models for all explored systems are reported in the ESI.†Acknowledgements
The authors kindly acknowledge the Italian Ministry of University and Research (MIUR) for funding under grants FIRB Futuro in Ricerca (RBFR122HFZ) and PRIN (2012NB3KLK).References
- W. N. Arnold and L. S. Loftus, Xanthopsia and van Gogh's yellow palette, Eye, 1991, 5, 503–510 CrossRef PubMed.
- V. van Gogh, Ever Yours, The Essential Letters, Yale University Press, 2014 Search PubMed.
- L. Monico, K. Janssens, E. Hendriks, B. G. Brunetti and C. Miliani, Raman study of different crystalline forms of PbCrO4 and PbCr1−xSxO4 solid solutions for the noninvasive identification of chrome yellows in paintings: a focus on works by Vincent van Gogh, J. Raman Spectrosc., 2014, 45, 1034–1045 CrossRef CAS.
- L. Monico, K. Janssens, E. Hendriks, F. Vanmeert, G. van der Snickt, M. Cotte, G. Falkenberg, B. G. Brunetti and C. Miliani, Evidence for Degradation of the Chrome Yellows in Van Gogh's Sunflowers: A Study Using Noninvasive In Situ Methods and Synchrotron-Radiation-Based X-ray Techniques, Angew. Chem., Int. Ed. Engl., 2015, 54, 13923–13927 CrossRef CAS PubMed.
- L. Monico, K. Janssens, C. Miliani, B. G. Brunetti, M. Vagnini, F. Vanmeert, G. Falkenberg, A. Abakumov, Y. Lu, H. Tian, J. Verbeeck, M. Radepont, M. Cotte, E. Hendriks, M. Geldof, L. van der Loeff, J. Salvant and M. Menu, Degradation process of lead chromate in paintings by Vincent van Gogh studied by means of spectromicroscopic methods. 3. Synthesis, characterization, and detection of different crystal forms of the chrome yellow pigment, Anal. Chem., 2013, 85, 851–859 CrossRef CAS PubMed.
- L. Monico, K. Janssens, C. Miliani, G. van der Snickt, B. G. Brunetti, M. Cestelli Guidi, M. Radepont and M. Cotte, Degradation process of lead chromate in paintings by Vincent van Gogh studied by means of spectromicroscopic methods. 4. Artificial aging of model samples of co-precipitates of lead chromate and lead sulfate, Anal. Chem., 2013, 85, 860–867 CrossRef CAS PubMed.
- L. Monico, K. Janssens, F. Vanmeert, M. Cotte, B. G. Brunetti, G. van der Snickt, M. Leeuwestein, J. Salvant Plisson, M. Menu and C. Miliani, Degradation process of lead chromate in paintings by Vincent van Gogh studied by means of spectromicroscopic methods. Part 5. Effects of nonoriginal surface coatings into the nature and distribution of chromium and sulfur species in chrome yellow paints, Anal. Chem., 2014, 86, 10804–10811 CrossRef CAS PubMed.
- L. Monico, G. van der Snickt, K. Janssens, W. De Nolf, C. Miliani, J. Dik, M. Radepont, E. Hendriks, M. Geldof and M. Cotte, Degradation process of lead chromate in paintings by Vincent van Gogh studied by means of synchrotron X-ray spectromicroscopy and related methods. 2. Original paint layer samples, Anal. Chem., 2011, 83, 1224–1231 CrossRef CAS PubMed.
- L. Monico, G. van der Snickt, K. Janssens, W. De Nolf, C. Miliani, J. Verbeeck, H. Tian, H. Tan, J. Dik, M. Radepont and M. Cotte, Degradation process of lead chromate in paintings by Vincent van Gogh studied by means of synchrotron X-ray spectromicroscopy and related methods. 1. Artificially aged model samples, Anal. Chem., 2011, 83, 1214–1223 CrossRef CAS PubMed.
- H. Tan, H. Tian, J. Verbeeck, L. Monico, K. Janssens and G. van Tendeloo, Nanoscale investigation of the degradation mechanism of a historical chrome yellow paint by quantitative electron energy loss spectroscopy mapping of chromium species, Angew. Chem., Int. Ed. Engl., 2013, 52, 11360–11363 CrossRef CAS PubMed.
- F. Da Pieve, C. Hogan, D. Lamoen, J. Verbeeck, F. Vanmeert, M. Radepont, M. Cotte, K. Janssens, X. Gonze and G. van Tendeloo, Casting light on the darkening of colors in historical paintings, Phys. Rev. Lett., 2013, 111, 208302 CrossRef CAS PubMed.
- S. Fantacci, A. Amat and A. Sgamellotti, Computational chemistry meets cultural heritage: challenges and perspectives, Acc. Chem. Res., 2010, 43, 802–813 CrossRef CAS PubMed.
- C. Hogan and F. Da Pieve, Colour degradation of artworks: an ab initio approach to X-ray, electronic and optical spectroscopy analyses of vermilion photodarkening, J. Anal. At. Spectrom., 2015, 30, 10 RSC.
- D. Errandonea, E. Bandiello, A. Segura, J. J. Hamlin, M. B. Maple, P. Rodriguez-Hernandez and A. Muñoz, Tuning the band gap of PbCrO4 through high-pressure: evidence of wide-to-narrow semiconductor transitions, J. Alloys Compd., 2014, 587, 14–20 CrossRef CAS.
- Y. Miseki, O. Kitao and K. Sayama, Photocatalytic water oxidation over PbCrO4 with 2.3 eV band gap in IO3−/I− redox mediator under visible light, RSC Adv., 2015, 5, 1452–1455 RSC.
- P. Hohenberg and W. Kohn, Inhomogeneous Electron Gas, Phys. Rev., 1964, 136, B864–B871 CrossRef.
- W. Kohn and L. J. Sham, Self-Consistent Equations Including Exchange and Correlation Effects, Phys. Rev., 1965, 140, A1133–A1138 CrossRef.
- J. P. Perdew, K. Burke and M. Ernzerhof, Generalized Gradient Approximation Made Simple, Phys. Rev. Lett., 1996, 77, 3865–3868 CrossRef CAS PubMed.
- S. Grimme, J. Antony, S. Ehrlich and H. A. Krieg, A consistent and accurate ab initio parametrization of density functional dispersion correction (DFT-D) for the 94 elements H-Pu, J. Chem. Phys., 2010, 132, 154104 CrossRef PubMed.
- A. D. Becke and E. R. Johnson, A simple effective potential for exchange, J. Chem. Phys., 2006, 124, 221101 CrossRef PubMed.
- S. Grimme, Density functional theory with London dispersion corrections, Wiley Interdiscip. Rev.: Comput. Mol. Sci., 2011, 1, 211–228 CrossRef CAS.
- V. Barone, M. Casarin, D. Forrer, M. Pavone, M. Sambi and A. Vittadini, Role and effective treatment of dispersive forces in materials: polyethylene and graphite crystals as test cases, J. Comput. Chem., 2009, 30, 934–939 CrossRef CAS PubMed.
- E. A. Carter, Challenges in modeling materials properties without experimental input, Science, 2008, 321, 800–803 CrossRef CAS PubMed.
- Y. Marcus, Ion Properties, CRC Press, New York, 1997 Search PubMed.
- S. Benny, R. Grau-Crespo and N. de Leeuw, A theoretical investigation of a-Fe2O3− Cr2O3 solid solutions, Phys. Chem. Chem. Phys., 2009, 11, 808–815 RSC.
- V. I. Anisimov, F. Aryasetiawan and A. I. Lichtenstein, First-principles calculations of the electronic structure and spectra of strongly correlated systems: the LDA+U method, J. Phys.: Condens. Matter, 1997, 9, 767–808 CrossRef CAS.
- N. J. Mosey, P. Liao and E. A. Carter, Rotationally invariant ab initio evaluation of Coulomb and exchange parameters for DFT+U calculations, J. Chem. Phys., 2008, 129(1), 014103 CrossRef PubMed.
- W. Tang, E. Sanville and G. Henkelman, A grid-based Bader analysis algorithm without lattice bias, J. Phys.: Condens. Matter, 2009, 21, 084204 CrossRef CAS PubMed.
- J. Heyd, G. E. Scuseria and M. Ernzerhof, Hybrid functionals based on a screened Coulomb potential, J. Chem. Phys., 2003, 118, 8207 CrossRef CAS.
- M. Shishkin and G. Kresse, Implementation and performance of the frequency-dependent GW method within the PAW framework, Phys. Rev. B: Condens. Matter Mater. Phys., 2006, 74, 035101 CrossRef.
- H. J. Beaven, A model for thermoluminescence and related phenomena in PbSO4:Sm, J. Phys. D: Appl. Phys., 1988, 21, 181 CrossRef CAS.
- G. Kresse and J. Furthmüller, Efficient iterative schemes for ab initio total energy calculations using a plane-wave basis set, Phys. Rev. B: Condens. Matter Mater. Phys., 1996, 54, 11169–11186 CrossRef CAS.
- G. Kresse and J. Furthmüller, Efficiency of ab initio total energy calculations for metals and semiconductors using a plane-wave basis set, Comput. Mater. Sci., 1996, 6, 15–50 CrossRef CAS.
- G. Kresse and D. Joubert, From ultrasoft pseudopotentials to the projector augmented-wave method, Phys. Rev. B: Condens. Matter Mater. Phys., 1999, 59, 1758–1775 CrossRef CAS.
Footnote |
| † Electronic supplementary information (ESI) available: Structural models for all VGY solid solution, equilibrium lattice constants of PbCrO4 and PbSO4 and equilibrium volumes of all VGY solid solution in both monoclinic and orthorhombic phases, study of S segregation in PbCr0.5S0.5O4, Bader charge analysis of PbCrO4, eigenvalue gaps of VGY solid solution at PBE(+U) levels of theory and PDOS of all VGY solid solution. See DOI: 10.1039/c5sc04362j |
| This journal is © The Royal Society of Chemistry 2016 |

