 Open Access Article
The stabilisation of the Nx phase in mixtures
E.
Ramou
ab,
Z.
Ahmed
a,
C.
Welch
a,
P. K.
Karahaliou
b and
G. H.
Mehl
*a
aDepartment of Chemistry, University of Hull, Hull HU6 7RX, UK. E-mail: g.h.mehl@hull.ac.uk
bDepartment of Physics, University of Patras, 26504 Patras, Greece
First published on 28th October 2015
Abstract
The phase behaviour of mixtures between two symmetric dimers, CBC9CB and the ether-linked analogue CBOC9OCB was investigated by Polarizing Optical Microscopy (POM), Differential Scanning Calorimetry (DSC) and X-Ray Diffraction (XRD) studies. The dimeric constituents are fully miscible and the construction of a temperature-composition phase diagram reveals a surprising amplification of the stability of the Nx phase in compositions of up to 37 wt% of CBOC9OCB in CBC9CB. The origin for this enhancement of stability is discussed and an explanation based on chiral recognition is developed.
1 Introduction
Liquid crystal dimers consist of molecules containing two mesogens joined by a flexible chain. Their most characteristic feature is the dependence of their mesomorphic properties on the parity of the linking chain. This odd–even effect is attributed to the available energetically favoured shapes of the molecules and their ability to form predominantly linear or bent conformations in the liquid crystal state.1,2 The recent discovery of an additional thermotropic liquid crystal phase, originally found in odd membered cyanobiphenyl dimeric liquid crystals, at temperatures below the nematic phase, has attracted considerable interest over the last few years, especially as it was noticed that a characteristic feature of the phase was the formation of chiral domains by chemically non-chiral compounds. This mesophase originally called the Nx phase, has also more recently been described as a twist bend nematic, Ntb. The optical defect textures observed under the microscope suggest a smectic-like structure, while X-ray data indicate a mesophase with a nematic character. Despite detailed investigations by a wide range of characterization techniques, the structural features of the mesophase are still discussed controversially. The correlation with theoretical models is not fully clear and multilevel ordering has been considered and discussed.3–17 Indeed, a considerable theoretical and simulation effort is currently targeted at understanding the liquid crystal phase behaviour in systems with conformational chirality. Due to these questions, in this contribution the phase is termed Nx.The behaviour of the Nx phase in mixtures of dimeric compounds with typical nematogens as in the case of 5CB18 has resulted, for the materials reported so far, in a monotonic destabilisation of the Nx phase with increasing content of the nematic dopant. The effect of the chiral conformations is simply diluted by adding another component and the stability decreases. When the additive is a nematic dimer the resulting mixtures have been reported to exhibit a more complex behaviour, not only for the Nx phase but for the Iso–N transition as well.19,20 Although the Nx phase has been shown to accommodate relatively large amounts of other liquid crystal groups, including nematic nanoparticle systems,21 the overall trend has so far always been that addition of another compound results in a destabilisation of the Nx phase.
Here we present our investigation of binary mixtures between methylene and ether linked cyanobiphenyl dimers, that exhibit a N–Nx phase transition, by Polarizing Optical Microscopy (POM), Differential Scanning Calorimetry (DSC) and for selected compositions by X-Ray Diffraction (XRD). The ether linked materials reported so far do not exhibit the Nx phase, yet the mesophase can be induced through mixtures with methylene linked dimers.19,20 Exceptions to this are some non-symmetric dimers.22,23 Here we show the first example of a surprising stabilisation of the enantiotropic Nx phase on adding a nematic dimer. This indicates that adding a nonchiral material to a material with conformational chirality can stabilize the chiral phase. We also report the formation of a stabilised monotropic Nx phase over a wide composition range.
2 Materials and methods
2.1 Materials
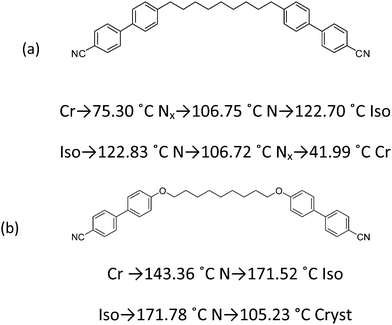
The first component of the mixtures is α,ω-bis(4,4′-cyanobiphenyl)nonane (CBC9CB), a cyanobiphenyl dimer already reported to exhibit an enantiotropic Nx phase.14,18 The second material is the ether linked α,ω-bis(4,4′-cyanobiphenyloxy)nonane (CBOC9OCB), that exhibits only the N mesophase.24,25 Their chemical structures and phase sequences are depicted in Fig. 1.2.2 Sample preparation
The binary mixtures were prepared by co-heating pre-weighed amounts until both components were isotropic. The resulting blends were mechanically stirred and then cooled at room temperature until they were fully crystallized. Moreover, selected samples containing 30, 50, 80 wt% of CBOC9OCB were additionally prepared using a different procedure. Pre-weighed amounts of the dimeric compounds were co-dissolved in dichloromethane. The solvent was allowed to evaporate at room temperature followed by drying under vacuum. This was carried out to assure that the results for the phase transition temperatures were not dependent on the sample preparation method. All concentrations are given in weight percents (wt%), if not stated otherwise.2.3 POM observations
Phase identification of the mixtures was performed by using an Olympus BX-51 polarized light microscope with a Mettler FP82 hot stage and a Lumenera Infinity X camera. The samples were heated above the isotropisation temperature and left for approximately 10 minutes in the isotropic state. This was followed by a cooling/heating cycle to identify the different liquid crystal phases in the mixtures. Afterwards, a second cooling/heating run was performed to determine the transition temperatures relating to cases of interest. For the study of the biphasic region a temperature rate of 3 °C min−1 was used. Especially in the case of the Iso–N transition, the appearance of nematic droplets marks the onset of the transition, while the disappearance of the last isotropic region indicates the end of the transition. For the investigation of the N–Nx transition in all mixtures, a temperature rate of 3 °C min−1 was used. The appearance of a blocky texture marks the onset of the transition. For the examination of the Cr–Nx transition in the enantiotropic mixtures a temperature rate of 0.2 °C min−1 was used.2.4 DSC measurements
The thermal behaviour of the samples was investigated on Mettler-Toledo differential scanning calorimetry DSC 822e calibrated against an indium standard. Two consecutive heating/cooling scans were performed, using scanning rates of 5 °C min−1, unless stated otherwise. Experimental data were taken from the second run.2.5 XRD studies
X-ray diffraction experiments (CuKα radiation, generated using copper tube at 35 kV and 30 mA), focused with Xenocs FOX2D12-INF optics, were performed on aligned samples (0.5 Tesla magnet, magnetic field vertical) in a home built graphite furnace with a Eurotherm heater. The diffraction patterns were detected using a Mar345 2D-image plate.3 Results
3.1 Temperature-composition phase diagram and transition enthalpies
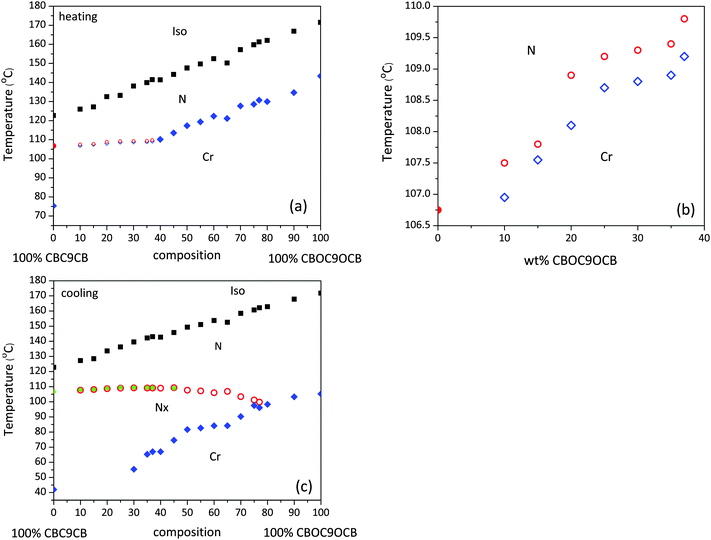
The phase diagram for the mixtures of CBC9CB and CBOC9OCB collected on heating and cooling are shown in Fig. 2. The transition temperatures were taken from the second DSC heating/cooling runs. In the case where the scan was unable to locate a transition, POM transition temperatures were used. As can be seen in Fig. 2(a and b), the overall trends on heating are quite clear. On addition of CBOC9OCB to CBC9CB the transition temperature from the nematic to the isotropic phase increases linearly with increasing CBOC9OCB content. Progressing from the pure compound to the mixtures a wide biphasic region is formed at the isotropisation temperatures. The optical textures of those transitions showed regions with the nematic and isotropic phases in coexistence. More details will be discussed later.For the melting points two trends are detectable. On addition of 10 wt% of CBOC9OCB to CBC9CB the melting point increases to 106.95 °C, compared to that of 75.3 °C of the pure CBC9CB. Increasing the concentration of CBOC9OCB further up to 37 wt%, results only in a small temperature increase up to 109.2 °C. Beyond a 37 wt% concentration the melting points increase steeply to reach the melting point of the pure CBOC9OCB at 143.36 °C.
More interestingly, the character of the Nx phase is composition dependent, dividing the diagram into two main regions. For concentrations in the range of 40–77 wt% of CBOC9OCB, the Nx phase is monotropic. There the N–Nx transition is too weak to be captured by DSC scans and consequently the transition is verified only through POM analysis. Mixtures with concentrations in the range of 10–37 wt% of CBOC9OCB show enantiotropic Nx behaviour. Clearly detectable is the increase of the N–Nx transition temperature on heating (see Fig. 2(b)), stable up to 109.8 °C at the 37 wt% mixture with an increase of almost 3.0 °C compared to the pure CBC9CB. Between 37–40 wt% the mesophase is observed to be monotropic.
On cooling an overall, similar behaviour for the Iso–N transition is detectable (see Fig. (2c)). Moreover, the onset of the crystallization temperatures decreases with increasing CBC9CB content. The result is the emergence of a wide region of Nx phase stability reaching up to a CBOC9OCB content between 77 and 80 wt%. A slight increase in the stability of the mesophase is observed upon the addition of a small amount of CBOC9OCB. This increase reaches a maximum of 109.3 °C for the 45 wt% mixture, which is 3 °C higher than the corresponding N–Nx transition temperature of the pure CBC9CB. Within this temperature range the CBOC9OCB dimer, although in the N phase, is very close to its N–Cr transition. This indicates that ordering is promoted in the mixtures that favours the formation of Nx phase, being a more ordered mesophase, than the conventional nematic. Beyond the 60 wt% composition the phase transition temperature decreases slowly to 99.8 °C at the 77 wt% mixture, while at higher concentrations the mixtures exhibit only a Cr–N transition following the trend of the pure CBOC9OCB.
However, the overall behaviour of the N–Nx transition, as observed in a wider composition range is essentially invariant to the added presence of CBOC9OCB and comparable to the corresponding behaviour of the pure CBC9CB. This observation suggests that the former dimer is sufficiently accommodated by CBC9CB possibly due to their relatively close molecular structure. A more detailed discussion about the observed stabilisation of the Nx phase is discussed in Section 3.4.
In Fig. 3(a and b) enthalpies associated with the Iso–N and N–Nx transitions, derived from the DSC scans, are plotted as a function of the concentration of CBOC9OCB, in the range of 0–45 wt%. The enthalpy values for the Iso–N transition exhibit a substantially linear behaviour increasing in value from the transition enthalpy of pure CBC9CB of 1.09 kJ mol−1 to 1.95 kJ mol−1 for 45 wt% of CBOC9OCB having almost twice the value. According to Emerson et al.,26 the transition enthalpies for odd membered dimers with ether linkages have higher values, than their corresponding methylene linked ones this is due to an increased orientational order of the system. The experimental enthalpy values of our binary systems, as the concentration of CBOC9OCB increases, are consistent with this theory. The enthalpy for the formation of the Nx phase decreases with increasing wt% of CBOC9OCB down to very small values similar to what has been observed for mixtures of CBC9CB with 5CB.18 As the binary systems become richer in the ether linked dimer, the already weak character of the N–Nx transition becomes weaker.
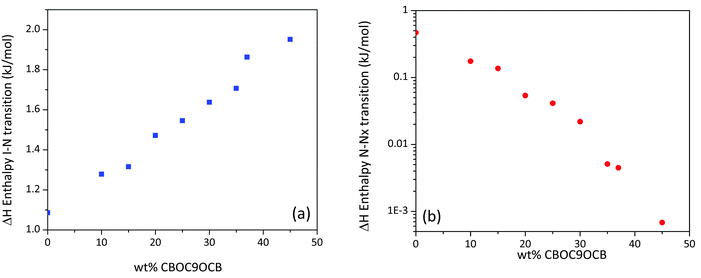 | ||
| Fig. 3 (a) Enthalpy values, taken from the second DSC cooling runs, of the (a) Iso–N and (b) N–Nx transitions as a function of the concentration of CBOC9OCB. | ||
3.2 POM and DSC studies
The properties of the materials will be discussed in more detail based on a number of selected compositions. Composition information and transition temperatures of these mixtures are listed in Table 1.| Mixture | CBOC9OCB (wt%) | CBC9CB (wt%) | Transition temperature (°C) |
|---|---|---|---|
| 1 | 20 | 80 |
Cr → 108.1 °C Nx → 108.9 °C N → 132.58 °C Iso
Iso → 133.63 °C N → 108.65 °C Nx |
| 2 | 50.01 | 49.99 |
Cr → 117.33 °C N → 147.6 °C Iso
Iso → 149.35 °C N → 107.7 °C Nx → 81.65 °C Cr |
| 3 | 50.37 | 49.63 |
Cr → 116.99 °C N → 142.70 °C ? → 148.03 °C Iso
Iso → 149.64 °C N → 143.89 °C ? → 108.5 °C Nx → 85.65 °C Cr |
| 4 | 75 | 25 |
Cr → 128.57 °C N → 159.77 °C Iso
Iso → 160.68 °C N → 101.2 °C Nx → 97.52 °C Cr |
| 5 | 15 | 85 |
Cr → 107.55 °C Nx → 107.80 °C N → 127.17 °C Iso
Iso → 128.49 °C N → 108.1 °C Nx |
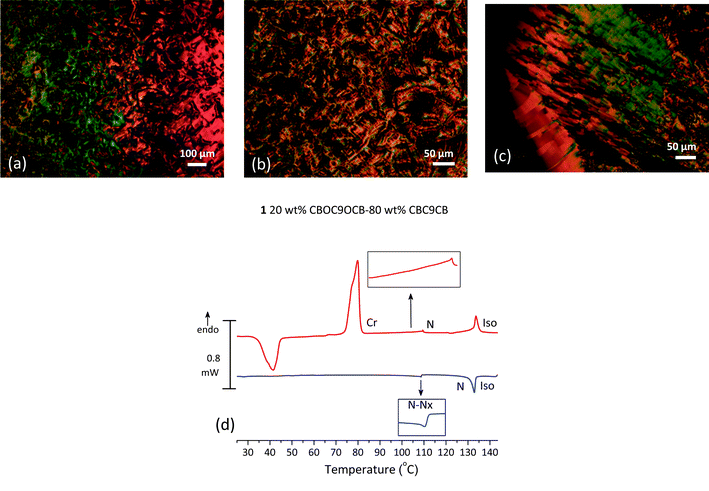
The binary mixture 1, of composition 20 wt% CBOC9OCB–80 wt% CBC9CB, is taken as representative for the left part of the phase diagram, as shown in Fig. 1, where an enantiotropic Nx phase is formed in a composition range of 0–37 wt% of CBOC9OCB. On cooling at temperatures below the conventional nematic phase, POM textures on untreated glasses exhibit features ascribed to the Nx phase. The onset of the mesophase is marked by the appearance of a blocky texture (Fig. 4(a)). Upon further cooling the texture evolves into elliptical polygonal domains and rope type patterns (Fig. 4(b)). The corresponding DSC scans confirm the N–Nx transition. As shown in Fig. 4(d) at temperatures below the Iso–N peak, the N–Nx transition is distinguishable by a weakly first order transition, though the exotherm is quite small with a low enthalpy value of 0.054 kJ mol−1. Exothermic peaks associated with crystallization of the sample were not traced by the DSC, because the system forms a glass like state. Similar behaviour was observed for samples of composition 10, 15, 20, 25 wt% of CBOC9OCB in CBC9CB. POM studies on cooling verify the persistence of the Nx phase until 25 °C. Optically detectable crystallization, at room temperature, started after approximately 2 hours at a quite slow pace. Consequently, in the corresponding DSC scan, on second heating, the first transition (exothermic) is associated with the recrystallization of the sample. The next endotherm is a Cr–Cr transition followed by a wide and low peaked Cr–N transition. POM studies reveal that in the temperature range of the latter endotherm an additional transition exists. Microscopy analysis indicates the formation of the Nx phase from the crystalline, on heating (Fig. 4(c)). As mentioned above, the stability of the mesophase is not reduced upon adding CBOC9OCB content, it is enhanced.
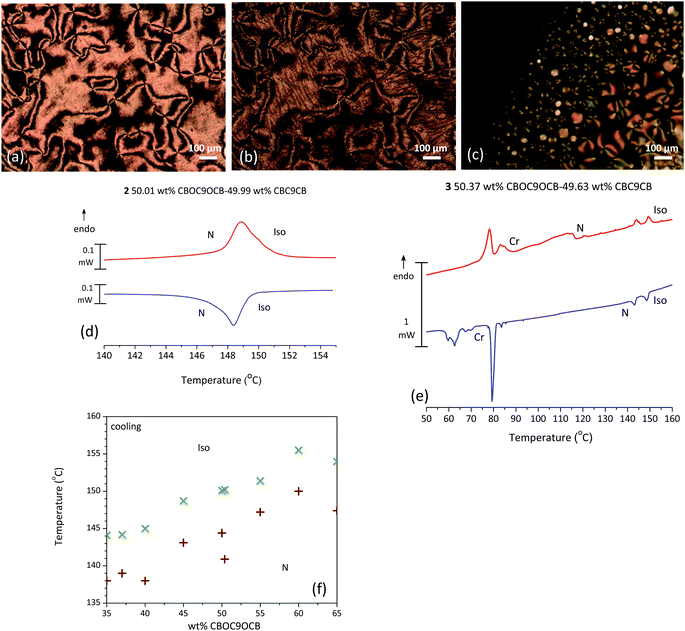
The centre of the phase diagram is interesting. Several mixtures in the range of 50/50 wt% were prepared and are characterized by a melting point at roughly 117 °C followed by the formation of a nematic (N) phase. On cooling an Nx phase appears at around 108 °C that progresses into a rope type pattern. In Fig. 5(a and b) an example of such a mixture is presented. During POM observation, at isotropisation temperatures large biphasic regions are formed whilst the temperature range of the N–I transition is approximately 6 °C. This transition behaviour was found to be reproducible on cooling as well and prompted us to investigate into this matter further.
Small variation of the concentrations around the 50/50 composition region has an effect on the isotropisation transition. For mixture 2, with a composition of 50.01 wt% CBOC9OCB–49.99 wt% CBC9CB, a broad transition is detected, reproducible on cooling, with enthalpy values of 2.06 kJ mol−1 and 2.22 kJ mol−1 respectively, as seen in Fig. 5(d). If concentrations are changed slightly like in the case of mixture 3 (50.37 wt% CBOC9OCB–49.63 wt% CBC9CB), the broad DSC peak is resolved into two peaks (Fig. 5(e)), with quite similar enthalpy values of 0.57 kJ mol−1 and 0.62 kJ mol−1 respectively, whereas POM textures are indicative of a single I–N transition. These two peaks are mirrored on the cooling scan as well with enthalpy values of 0.67 kJ mol−1 and 0.80 kJ mol−1. The POM micrograph of these transitions is depicted in Fig. 5(c). The N phase emerges from the isotropic state as nematic droplets that merge to form the bulk phase. A Schlieren texture is in coexistence with the isotropic fluid during this wide transition.
Based on our microscopy studies we constructed a temperature–concentration phase diagram for the biphasic region in the vicinity of the 50–50 composition for clarification. As indicated above, the upper temperature represents the appearance of the first nematic droplets, while the lower temperature indicates the end of the transition where the whole field of view is covered by a Schlieren texture. It is evident from the graph in Fig. 5(f) that there are several compositions that exhibit biphasic regions in a temperature interval of at least 5 °C. However, our interest was focused in the 50–50 region. Further XRD investigation showed no indication of any additional or different features in the biphasic region, when compared to the N phase, pointing to an unusual deconvolution of a mixture with changing temperature and not to another phase.
The origin of this unusual behaviour, whether possibly due to an almost S-shaped extremely steep “solidus curve” of this LC state at this concentration, more akin to the melting behaviour of some minerals or due to the formation of “AB type” molecular species between the two molecular groups, with an enhanced stability, is currently subject to further detailed investigations and not the focus of this contribution. Hence they are just reported as an experimental finding.
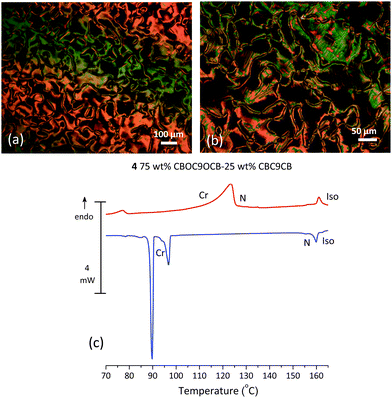
Mixture 4, (75 wt% CBOC9OCB–25 wt% CBC9CB) further to the right of the phase diagram, shown in Fig. 1, is selected as a representative example of a monotropic composition. On cooling from the N phase, POM textures show patterns typical of the Nx phase (Fig. 6(a and b)). Fig. 6(c) shows the DSC thermogram of 4 for the second heating and cooling runs. On heating the first endotherm is a quite broad Cr–N transition with a temperature range of 27 °C. Such wide melting transitions have been observed before in binary systems.27 The second endotherm is a sharp N–Iso transition, though broader than that of the pure compounds, indicative of a biphasic region. On cooling, after the Iso–N transition, the N–Nx transition is not detectable. Hence, the second exotherm is an Nx–Cr transition followed at lower temperatures by a strong peak associated with further crystallization of the sample.
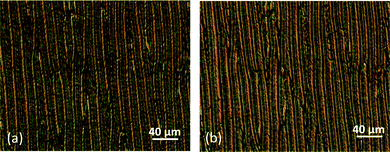
The optical textures on treated glasses reveal a periodically uniform pattern already associated with the formation of the Nx phase under defined boundary conditions. Fig. 7(a and b) show the micrographs obtained for mixture 5 (15 wt% CBOC9OCB–85 wt% CBC9CB) contained in a commercial planar cell (EHC Co., KSRO-06/A211P1NSS 05X) with a 6 μm cell gap. On cooling a periodic pattern develops consisting of rope type stripes parallel to the rubbing direction along with elongated ellipses. Upon rotating the polarizer by ±20°, the texture exhibits a colour exchange, as observed for other systems suggesting the formation of domains having opposite handedness.3,7 Similar patterns have already been observed for other compounds exhibiting the Nx phase, such as CBC7CB,4 the compound DTC5C9, a methylene linked dimer containing difluoroterphenyl units3 and other mixtures.19
3.3 X-ray diffraction
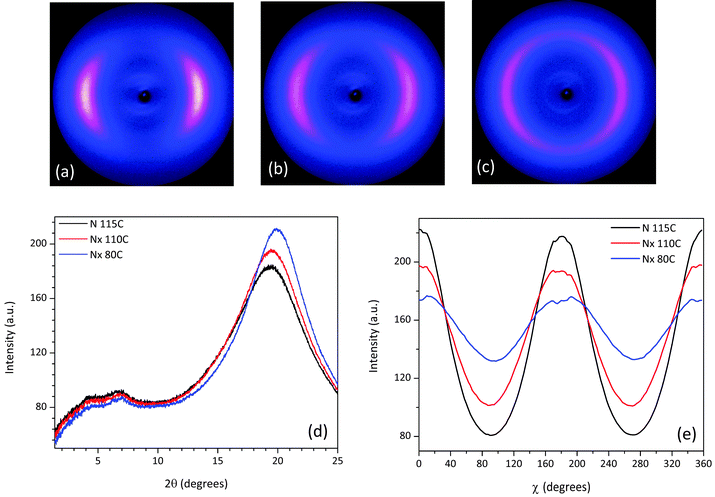
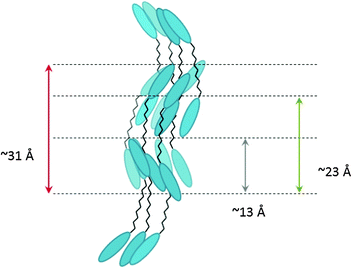
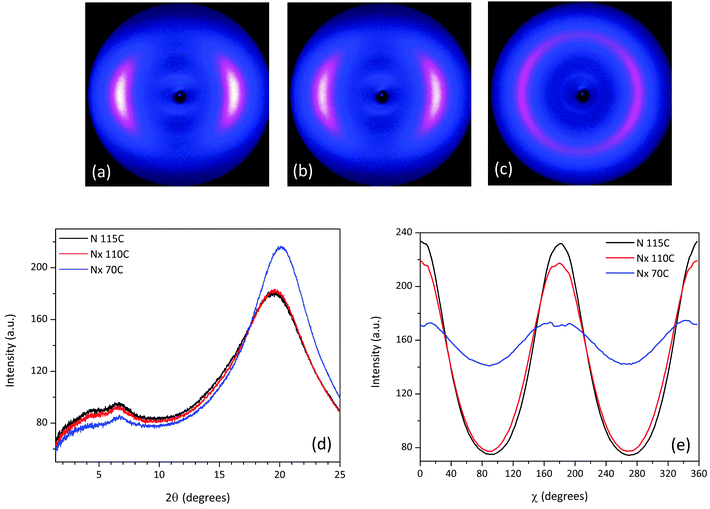
X-ray measurements were performed on aligned samples of CBC9CB and a selection of the mixtures to verify the presence of the Nx phase. The two dimensional X-ray diffraction patterns of CBC9CB are shown in Fig. 8, taken on cooling at temperatures 115 °C, 110 °C and 80 °C. At 115 °C CBC9CB is in the N phase. Its corresponding diffractogram (see Fig. 8(a)) exhibits features associated with short range orientational order, diffuse wide angle arcs and weak scattering in the small angle area. The equatorial maxima represent a side-to-side separation of 4.6 Å, a typical value for calamitic liquid crystals.28 At 110 °C the X-ray pattern changes denoting the onset of the Nx phase (Fig. 8(b)). While there is no significant change in the small angle scattering, the wide angle arcs are somewhat narrower and spread further around the meridian. This indicates that the packing of the molecules has not changed significantly, however there is a change in the alignment. We note here that there is a systematic difference to the temperatures between POM, DSC and XRD experiments. This is attributed to differences between semi-bulk measurements in the capillaries (diameter 0.8 mm), longer annealing times, less accurate temperature measurement but we note too that the variation of external boundary conditions has been reported to have strong effect on the transition temperatures of the Nx phase.29 At 80 °C (Fig. 8(c)), deep into the Nx phase, the wide angle arcs have evolved into a circle-type pattern, indicating a misalignment or a decrease of macroscopic ordering, a finding that has been previously reported as a typical observation4,30,32 possibly due to domain formation. The signal distribution is much narrower than at 110 °C and the equatorial peaks result in an average separation of 4.5 Å, which is indicative of a closer lateral packing of the molecules. Similar diffractograms have been obtained for CBC7CB,4 CBC11CB3 and a range of other mesogens.21,31θ-Scans of the X-ray patterns for the three recorded temperatures are presented in Fig. 8(d). Noticeable are the two peaks in the small angle that persist upon cooling. For the N phase at 115 °C the pseudo d-spacings calculated from the small angle intensities correspond to distances of d1 = 23 Å and d2 = 13 Å respectively. Based on a simple measurement through ChemDraw and assuming an all trans configuration of the molecule, the end to end molecular length (L) of CBC9CB is estimated to be roughly 31 Å. The d-spacing values suggest that the molecules are strongly interdigitated. This is in line with previous results for CBC9CB18 and CBC7CB.4
The assembly of cyanobiphenyl and other polar end group low molar mass (“monomeric”) liquid crystals has been thoroughly explored and discussed since their initial discovery.32,33 According to these investigations, the diffraction data were interpreted as due to the formation of antiparallel correlated dimers, with molecules dissociating and associating constantly giving rise to a signal for monomers and associated dimers. A dynamic equilibrium exists between monomeric and antiparallel assembled dimeric species making up the nematic phase in such systems, the typical example being 5CB.34–36
It should be noted that the peaks observed in the N phase in this investigation are very weak, with the 13 Å peak slightly more intense than the one at 23 Å. Both peaks do not correlate with a simple harmonic of the molecular length nor is there a simple harmonic relationship between them. Noticeable too is the similarity of the signal with those found for 5CB.32,33,36,37 Based on the approach for the low molar mass cyanobiphenyls, a dimer can be envisaged as two linked monomers. By dividing the estimated molecular length by two, the peak at 13 Å is at approximately 0.8 monomer length (0.8 = d2/0.5L), a result that would fit to the concept of a local SmA mono-layer like arrangement of the molecules.32 The peak at 23 Å could be either associated with a SmA mono-layer like packing of the full molecule with a value of 0.73 (d1/L), still in the range for a SmA mono-layer structure or alternatively with a strongly interdigitated organization of half a dimer and one mesogenic group. With the data available at present, it is not possible to distinguish between these two possibilities. However, the data strongly suggest that there are several species as in the monomeric systems, possibly conformational isomers or correlated molecules making up the phase, as in 5CB. We note too that quite complex packing behaviour has been observed in a number of flexibly linked smectic systems.38,39 It has been considered that in these dimeric systems the molecules pack in an antiparallel arrangement through overlapping associations of their cyanobiphenyl units, a sketched representation of such a molecular assembly is shown in Fig. 9.
Fitting the peaks to a Gaussian function results in correlation lengths of 14 Å and 5.7 Å respectively, in line with what has been observed for 5CB.36,37 The correlation lengths (ξ) were calculated using the formula ξ = c/Δq, where c is the function used to describe the intensity profile and Δq is the full width at half maximum (FWHM), a variation of the Scherrer equation, following the discussion by Francescangeli et al.40
As for the Nx phase, the θ-scans of the small angle area, as seen in Fig. 8(d), reveal no significant change, although the signal becomes slightly less intense with decreasing temperature. The calculated pseudo d-spacings and correlation lengths are summarized in Table 2 and they are in line with the concept discussed above. In the wide angle there is a noticeable increase in the height of the peaks as we progress into the Nx phase, due to the change of the signal distribution and a slight shift to the right. As mentioned above, this is indicative of a closer lateral packing of the molecules.
| Substance | Temperature (°C) | LC phase | Wide angle d-spacing (Å) | Small angle d1-spacing (Å) | Small angle d2-spacing (Å) | Longitudinal correlation length ξ1 (Å) | Longitudinal correlation length ξ2 (Å) |
|---|---|---|---|---|---|---|---|
| CBC9CB | 115 | N | 4.6 | 23 | 13 | 14 | 5.7 |
| 110 | Nx (onset) | 4.6 | 23 | 13 | 12 | 6.0 | |
| 80 | Nx | 4.5 | 22 | 13 | 13 | 6.9 | |
| 1 | 115 | N | 4.6 | 23 | 13 | 13 | 7.5 |
| 110 | Nx (onset) | 4.6 | 24 | 13 | 13 | 6.4 | |
| 70 | Nx | 4.4 | 26 | 13 | 12 | 6.1 | |
| 3 | 120 | N | 4.5 | 24 | 14 | 13 | 7.8 |
| 110 | Nx (onset) | 4.5 | 25 | 14 | 11 | 7.5 | |
| 90 | Nx | 4.4 | 30 | 13 | 10 | 4.5 | |
The azimuthally integrated scatterings in Fig. 8(e) reveal a small tilt of 2.13° at 110 °C and 3.7° at 80 °C. This could be simply due to surface effects.31 Although there have been reports of a tilt in the wide angle arcs in the range of 10°–20°.3,10 However, this is not considered a typical finding, as in many cases there is no split in the equatorial reflections, which would be expected if a tilt had developed.4 The mechanism responsible for this unusual behaviour is still an open question beyond the scope of this work. Moreover, our experimental results, performed in selected compositions, lead to significantly lower tilt values and they are reported as experimental findings.
The scattering patterns of mixture 1 recorded at 115 °C, 110 °C and 70 °C exhibit features similar to CBC9CB, see Fig. 10(b and c), and they confirm the nematic character of the Nx phase due to diffuse small and wide angle scattering. The change in the equatorial arcs in the wide angle region going from the N to the Nx phase at 110 °C (Fig. 10(b)) is more distinctive in the θ-scan shown in Fig. 10(d), where one can notice that the corresponding peak is slightly narrower and more intense. At 70 °C the wide angle arcs have evolved into a circle with a quite narrow signal distribution, resulting in a peak shifted slightly to the right with an increased intensity. The overall trend indicates a closer lateral packing and a misalignment, consistent with the possible domain formation. In the small angle region the two peaks are present in both phases, at comparable positions with each other. The corresponding d spacings and correlation lengths (see Table 2) are quite close to those found for CBC9CB, suggesting a strongly interdigitated organization or possibly a local SmA molecular assembly. The χ-scan (Fig. 10(e)) detects a slight tilt of 1.34° at 110 °C and 3.54° at 70 °C.
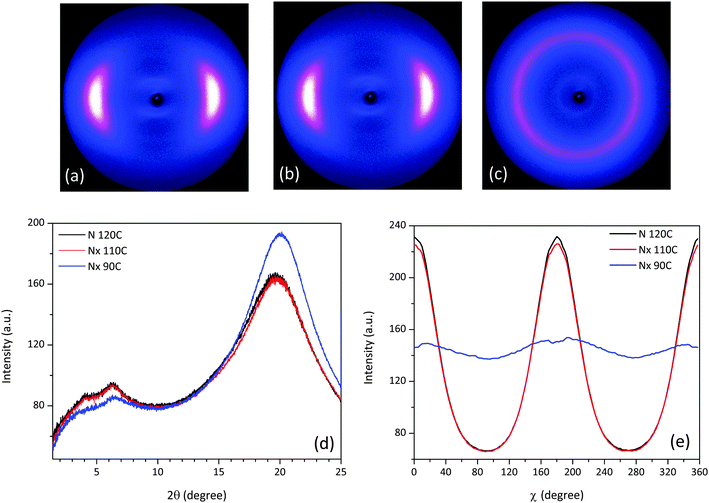
The X-ray results for mixture 3 shown in Fig. 11 are recorded at temperatures 120 °C, 110 °C and 90 °C. At the onset of the Nx phase at 110 °C (Fig. 11(b)) the equatorial scattering pattern shows only small differences to the one for the nematic phase at 120 °C (see Fig. 11(a)). Upon further cooling at 90 °C the X-ray diffraction pattern in the wide angle region evolves into a diffused isotropic-type circle (see Fig. 11(c)). In the θ-scan, shown in Fig. 11(d), the differences between the collected diffractograms verify that the nematic phases at 110 °C and 90 °C are the Nx phase. In the wide angle region a shift to the right is noticeable as the temperature decreases, while the corresponding lateral distances indicate a closer packed side to side assembly. In the small angle the two peaks are more distinct than in the case of CBC9CB and 1. The estimated pseudo d-spacings and correlation lengths are somewhat increased when compared to the previous compositions (see Table 2), with the exception of those at 90 °C. Deep in the Nx phase, the calculated repeat distances were found to be d1 = 30 Å and d2 = 13 Å, while the correlation lengths derived from Gaussian fittings are 10 Å (ξ1) and 4.5 Å (ξ2) respectively. The distribution of the wide angle scattering along χ in Fig. 11(e) detects no tilt for the Nx phase at 110 °C however at 90 °C it is found to be 7.19°, significantly higher compared to the aforementioned compounds. Mixture 4, where the transition is monotropic, was not investigated in detail by XRD due to its very weak signal intensities, when compared to the other materials, however it is akin to mixture 3.
3.4 Stability of the Nx phase
For the understanding of the stability of the Nx phase the two regimes, high concentration of CBOC9OCB and low concentration of CBOC9OCB should be looked at independently. If we start from the right side of the phase diagram at concentrations over 60 wt% CBOC9OCB as shown in Fig. 1(c) where CBOC9OCB forms the majority component in the mixtures, we are looking at an incremental increase of stability in the Nx phase. Going left in the phase diagram and increasing the concentration of CBC9CB, the phase behaviour though still monotropic is quite similar to that discussed for mixtures between CBC9CB and 5CB.18 It is broadly in line with discussions of mixing phenomena in liquid crystals where variations of the Schröder–van Laar equation have been used to assess transition behaviour and it conforms too with the more theoretical approaches discussed by de Gennes.41,42 For the left part of the phase diagram where an increase in Nx phase stability occurs, overall the transition temperatures are remarkably independent of concentration over a region ranging from approximately 10–60 wt% CBOC9OCB. This sheds more light on features of the self-assembly of the Nx phase.Though there are a number of different models for the Nx phase, a common feature of all so far is that the odd methylene linked dimers, forming the Nx phase, are bent and, although statistically achiral, they locally organize in chiral domains (either of left or right handedness).14 Each domain is mainly populated by molecules adopting twisted conformations of the same sense. On the other hand, in the case of ether linked dimers such as CBOC9OCB, twisted molecular conformations, although present, do not form homochiral domains due to relative ‘flat’ energy barriers between the twisted conformations of opposite sense.43 We note too, that unlike 5CB, CBOC9OCB is almost of the same molecular size as CBC9CB. On adding CBOC9OCB dimer to the CBC9CB system, being in the Nx phase, the former spontaneously adjusts its molecular conformations to the handedness of the domains formed by the latter.
On increasing the concentration of CBOC9OCB this type of ‘chiral recognition’ persists up to compositions of 60 wt% CBOC9OCB, where the Nx phase is stable. This is in agreement with the observation that the N–Nx transition temperature of mixtures with concentrations up to 60 wt% CBOC9OCB, is very close to the corresponding transition temperatures of pure CBC9CB system. This indicates that CBOC9OCB is well accommodated in the chiral environment of the Nx phase. Apparently, as the concentration of CBOC9OCB further increases, this chiral molecular recognition becomes weaker up to the point where the mixtures exhibit only nematic phase.
4 Conclusion
We investigated through complimentary characterization techniques the liquid crystalline behaviour of binary mixtures of the odd membered cyanobiphenyl dimer CBC9CB with the ether linked CBOC9OCB. POM investigations along with DSC studies report the formation of the Nx phase in a wide concentration range. The mesophase is either monotropic or enantiotropic, depending on concentration. Systems richer in CBOC9OCB show a monotropic Nx phase, while compositions richer in CBC9CB form an enantiotropic Nx. The N–Nx transition is confirmed to be weakly first order. X-ray investigations denote the differences between the N and Nx phases, verifying the latter as a phase with a nematic character, exhibiting an increased positional order and possibly forming domains. XRD results suggest a strongly interdigitated structure with a possible local SmA monolayer assembly. Moreover, our temperature–concentration phase diagram reveals a stabilization of the mesophase, on heating and cooling, for a wide range. To our knowledge, this is the first time such behaviour has been reported in dimeric mixtures exhibiting the Nx phase. As the Nx phase is the result of the separation of chiral conformers into separate domains, these findings will be of use to calibrate theory and simulation studies concerned with a detailed analysis of molecular parameters and conformational minima of molecules responsible for the formation of the Nx phase.Acknowledgements
ER acknowledges the EU for funding in the ERASMUS+ Placements program, CW and ZA acknowledge funding through the EU project BIND and the EPSRC projects EP/M015726/1 and EP/J004480/1 and we acknowledge the EPSRC NMSF, Swansea, for high resolution mass spectra.References
- C. T. Imrie and G. R. Luckhurst, in Handbook of Liquid Crystals, ed. D. Demus, J. W. Goodby, G. W. Gray, H. W. Spiess and V. Vill, Weinheim, Wiley VCH, 1998, ch. X, vol. 2B, p. 801 Search PubMed.
- G. R. Luckhurst, in Recent Advances in Liquid Crystalline Polymers, ed. L. Chapoy, Elsevier Applied Science, Barking, UK, 1985, ch. 7, p. 105 Search PubMed.
- V. Panov, M. Nagaraj, J. K. Vij, Y. P. Panarin, A. Kohlmeier, M. G. Tamba, R. A. Lewis and G. H. Mehl, Phys. Rev. Lett., 2010, 105, 167801 CrossRef CAS PubMed.
- M. Cestari, S. Diez-Berart, D. A. Dunmur, A. Ferrarini, M. R. de la Fuente, D. J. B. Jackson, D. O. Lopez, G. R. Luckhurst, M. A. Perez-Jubindo and R. M. Richardson, Phys. Rev. E: Stat., Nonlinear, Soft Matter Phys., 2011, 84, 031704 CrossRef CAS PubMed.
- V. P. Panov, R. Balachandran, M. Nagaraj, J. K. Vij, M. G. Tamba, A. Kohlmeier and G. H. Mehl, Appl. Phys. Lett., 2011, 99, 261903 CrossRef.
- L. Beguin, J. W. Emsley, M. Lelli, A. Lesage, G. R. Luckhurst, B. A. Timimi and H. Zimmermann, J. Phys. Chem. B, 2012, 116, 7940–7951 CrossRef CAS PubMed.
- V. P. Panov, R. Balachandran, J. K. Vij, M. G. Tamba, A. Kohlmeier and G. H. Mehl, Appl. Phys. Lett., 2012, 101, 234106 CrossRef.
- R. Dong, A. Kohlmeier, M. G. Tamba, G. H. Mehl and E. Burnell, Chem. Phys. Lett., 2012, 552, 44–48 CrossRef CAS.
- D. Chen, J. H. Porada, J. B. Hooperc, A. Klittnick, Y. Shen, M. R. Tuchband, E. Korblova, D. Bedrov, D. M. Walba, M. A. Glaser, J. E. Maclennan and N. A. Clark, Proc. Natl. Acad. Sci. U. S. A., 2013, 110, 15931–15936 CrossRef CAS PubMed.
- V. Borshch, Y. K. Kim, J. Xiang, M. Gao, A. Jakli, V. P. Panov, J. K. Vij, C. T. Imrie, M. G. Tamba, G. H. Mehl and O. D. Lavrentovich, Nat. Commun., 2013, 4, 2635 CAS.
- C. Meyer, G. R. Luckhurst and I. Dozov, Phys. Rev. Lett., 2013, 111, 067801 CrossRef CAS PubMed.
- M. Gao, Y. K. Kim, C. Zhang, V. Borshch, S. Zhou, H. S. Park, A. Jakli, O. D. Lávrentovich, M. G. Tamba, A. Kohlmeier, G. H. Mehl, W. Weissflog, D. Studer, B. Zuber, H. Gnägi and F. Lin, Microsc. Res. Tech., 2014, 77, 754–772 CrossRef CAS PubMed.
- E. Gorecka, M. Salamonczyk, A. Zep, D. Pociecha, C. Welch, Z. Ahmed and G. H. Mehl, Liq. Cryst., 2015, 42, 1–7 CrossRef CAS.
- A. Hoffmann, A. G. Vanakaras, A. Kohlmeier, G. H. Mehl and D. J. Photinos, Soft Matter, 2015, 11, 850–855 RSC.
- S. A. Pardaev, J. C. Williams, R. J. Twieg, A. Jakli, J. T. Gleeson, B. Ellman and S. Sprunt, Phys. Rev. E: Stat., Nonlinear, Soft Matter Phys., 2015, 91, 032501 CrossRef PubMed.
- C. J. Yun, M. R. Vengatesan, J. K. Vij and J. K. Song, Appl. Phys. Lett., 2015, 106, 173102 CrossRef.
- V. P. Panov, M. C. M. Varney, I. I. Smalyukh, J. K. Vij, M. G. Tamba and G. H. Mehl, Mol. Cryst. Liq. Cryst., 2015, 611, 180–185 CrossRef CAS.
- C. S. P. Tripathi, P. Losada-Perez, J. Leys, A. Kohlmeier, M. G. Tamba, G. H. Mehl and C. Glorieux, Phys. Rev. E: Stat., Nonlinear, Soft Matter Phys., 2011, 84, 041707 CrossRef PubMed.
- K. Adlem, M. Copic, G. R. Luckhurst, A. Mertelj, O. Parri, R. M. Richardson, B. D. Snow, B. A. Timimi, R. P. Tuffin and D. Wilkes, Phys. Rev. E: Stat., Nonlinear, Soft Matter Phys., 2013, 88, 022503 CrossRef CAS PubMed.
- P. A. Henderson and C. T. Imrie, Liq. Cryst., 2011, 38, 1407–1414 CrossRef CAS.
- M. G. Tamba, C. H. Yu, B. J. Tang, C. Welch, A. Kohlmeier, C. Schubert and G. H. Mehl, Materials, 2014, 7, 3494–3511 CrossRef CAS.
- R. J. Mandle, E. J. Davis, S. A. Lobato, C. C. A. Vol, S. J. Cowling and J. W. Goodby, Phys. Chem. Chem. Phys., 2014, 16, 6907–6915 RSC.
- N. Sebastián, D. O. López, B. Robles-Hernández, M. R. de la Fuente, J. Salud, M. A. Pérez-Jubindo, D. A. Dunmur, G. R. Luckhurst and D. J. B. Jackson, Phys. Chem. Chem. Phys., 2014, 16, 21391–21406 RSC.
- J. W. Emsley, G. R. Luckhurst, G. N. Shilstone and I. Sage, Liq. Cryst., 1984, 102, 223–233 CrossRef CAS.
- C. T. Imrie and P. A. Henderson, Chem. Soc. Rev., 2007, 36, 2096–2124 RSC.
- A. P. J. Emerson and G. R. Luckhurst, Liq. Cryst., 1991, 10, 861–868 CrossRef CAS.
- P. A. Irvine, D. C. Wu and P. J. Flory, J. Chem. Soc., Faraday Trans. 1, 1984, 80, 1795–1806 RSC.
- G. Ungar, in The Physical Properties of Liquid Crystals: Nematics, ed. D. A. Dunmur, A. Fukuda and G. R. Luckhurst, Inspec/Iee, London, 2007 Search PubMed.
- P. K. Challa, V. Borshch, O. PArri, C. T. Imrie, S. N. Sprunt, J. T. Gleeson, O. D. Lavrentovich and A. Jakli, Phys. Rev. E: Stat., Nonlinear, Soft Matter Phys., 2014, 89, 060501 CrossRef CAS PubMed.
- C. T. Archbold, E. J. Davis, R. J. Mandle, S. J. Cowling and J. W. Goodby, Soft Matter, 2015, 11, 7547–7557 RSC.
- Z. Ahmed, C. Welch and G. H. Mehl, RSC Adv., 2015, 5, 93513–93521, 10.1039/C5RA18118F.
- A. J. Leadbetter, R. M. Richardson and C. N. Colling, J. Phys., Colloq., 1975, 36, 37–43 CrossRef.
- A. J. Leadbetter, J. C. Frost and J. P. Gaughan, J. Phys., 1979, 40, 375–380 CAS.
- D. A. Dunmur and A. E. Tomes, Mol. Cryst. Liq. Cryst., 1983, 97, 241–253 CrossRef CAS.
- L. Longa and W. H. de Jeu, Phys. Rev. A: At., Mol., Opt. Phys., 1983, 28, 2380–2392 CrossRef CAS.
- S. Barnard, PhD thesis, University of Bristol, 1991.
- V. Castelletto, A. M. Squires, I. W. Hamley, J. Stasiak and G. D. Moggridge, Liq. Cryst., 2009, 36, 435–442 CrossRef CAS.
- J. P. F. Lagerwall, F. Giesselmann, M. D. Wand and D. M. Walba, Chem. Mater., 2004, 16, 3606–3615 CrossRef CAS.
- H. Sasaki, Y. Takanishi, J. Yamamoto and A. Yoshizawa, J. Phys. Chem. B, 2015, 119, 4531–4538 CrossRef CAS PubMed.
- O. Francescangeli, M. Laus and G. Galli, Phys. Rev. E: Stat. Phys., Plasmas, Fluids, Relat. Interdiscip. Top., 1997, 55, 481–487 CrossRef CAS.
- P. Raynes, in Liquid Crystal Handbook, ed. J. W. Goodby, P. J. Collings, T. Kato, C. Tschierske, H. F. Gleeson and P. Raynes, Wiley-VCH, 2nd edn, 2015, vol. 1, pp. 351–363 Search PubMed.
- P. G. de Gennes and J. Prost, The Physics of Liquid Crystals, Clarendon Press, Oxford, 2nd edn, 1993, p. 282 Search PubMed.
- D. J. Photinos, A. G. Vanakaras, private communication, 2015.
| This journal is © The Royal Society of Chemistry 2016 |

