 Open Access Article
Creative Commons Attribution 3.0 Unported Licence
A modular self-assembly approach to functionalised β-sheet peptide hydrogel biomaterials†
Patrick J. S.
King
abc,
M.
Giovanna Lizio
ab,
Andrew
Booth
abd,
Richard F.
Collins
e,
Julie E.
Gough
d,
Aline F.
Miller
bc and
Simon J.
Webb
*ab
aSchool of Chemistry, The University of Manchester, Brunswick Street, Manchester, M13 9PL, UK
bManchester Institute of Biotechnology, The University of Manchester, 131 Princess Street, M1 7DN, UK. E-mail: S.Webb@manchester.ac.uk
cSchool of Chemical Engineering and Analytical Sciences, The University of Manchester, Sackville Street, P.O. Box 88, Manchester, M60 1QD, UK
dSchool of Materials, The University of Manchester, MSS Tower, Manchester M13 9PL, UK
eFaculty of Life Sciences, Michael Smith Building, Oxford Road, Manchester, M13 9PT, UK
First published on 18th December 2015
Abstract
Two complementary β-sheet-forming decapeptides have been created that form binary self-repairing hydrogels upon combination of the respective free-flowing peptide solutions at pH 7 and >0.28 wt%. The component peptides showed little structure separately but formed extended β-sheet fibres upon mixing, which became entangled to produce stiff hydrogels. Microscopy revealed two major structures; thin fibrils with a twisted or helical appearance and with widths comparable to the predicted lengths of the peptides within a β-sheet, and thicker, longer, interwoven fibres that appear to comprise laterally-packed fibrils. A range of gel stiffnesses (G′ from 0.05 to 100 kPa) could be attained in this system by altering the assembly conditions, stiffnesses that cover the rheological properties desirable for cell culture scaffolds. Doping in a RGD-tagged component peptide at 5 mol% improved 3T3 fibroblast attachment and viability compared to hydrogel fibres without RGD functionalisation.
Introduction
Hydrogels are a versatile class of material with applications in controlled drug release, cell delivery and tissue engineering. The use of polymeric or self-assembled hydrogels as responsive cell culture materials1 is particularly promising, as the highly hydrated three dimensional structure provides a biomimetic environment for proliferating cells. Recently, self-assembling peptide hydrogels have shown potential as the next generation of cell culture biomaterials.2 These short and synthetically-accessible peptides self-assemble into nanoscale fibres that imitate the structure of the natural extracellular matrix, and their self-assembled structure allows for responsive elements3 or cell recognition motifs4 to be included within the hydrogel structure.Hydrogels decorated with biological ligands or enzyme cleavable groups have promise not only as cell culture scaffolds,5 but also as implantable biomaterials6 or protease sensors.7 In recent examples of the latter, PEGA hydrogels functionalised with cleavable peptide sequences were developed as drug delivery platforms8 whereas self-assembled peptide gels can respond to enzymatic cleavage by undergoing a sol-to-gel transition.9 Furthermore, incorporating recognition and/or sensing elements within a three-dimensional cell culture material that can be formed around cells, yet not be degraded by them, would support cell growth and allow the behaviour of these proliferating cells to be non-invasively monitored.
Our aim was to design a modular self-assembling peptide-based biomaterial with good biocompatibility that would form after the mixing of two precursor solutions at physiological pH, without the requirement for an external stimulus. The external stimuli, such as heating or a pH change,10 used to trigger the self-assembly of some hydrogels can be inimical to sensitive cell lines that cannot tolerate conditions either before or after the stimulus. Two-component protein/peptide hydrogels,11 such as the MITCH system of Heilshorn and co-workers12 or the complementary undecamers P11-13/P11-14 developed by Kyle et al.,2d are versatile as they can be formed around the cells of interest and can also form the basis of injectable cell culture scaffolds.13 The P11-13/P11-14 system (Ac-EQEFEWEFEQE-NH2 with Ac-QQXFXWXFXQQ-NH2, X = ornithine) is of particular interest, as hydrogels were formed that had a significant β-sheet component and were cytocompatible with fibroblasts. A significant β-sheet component might give two-component hydrogels resistance to degradation by cells, yet allow the incorporation of responsive elements or cell adhesion motifs. If displayed at fibre surfaces, these motifs would be recognisable by cells or cleavable by secreted enzymes. Nonetheless there are as yet few examples of two-component peptide gels with fibrils composed of β-sheet.2d,14
Herein we describe the self-assembly of a robust two-component hydrogel from complementary decapeptides; EEFKWKFKEE (single letter amino acid codes, peptide p1) and KKFEWEFEKK (peptide p2). The design of these complementary peptides included the simple ‘hphphp’ repeating pattern (h = hydrophobic residue, p = polar residue) that is known to favour β-sheet structures,15 with tryptophan included to enhance aromatic pairing interactions and to allow peptide concentrations to be accurately determined. We hoped a tightly-packed β-sheet core would confer protease resistance, yet the self-assembling molecular design would allow functionalised peptides to be included within the fibril structure. One example would be the cell recognition sequence RGD, which is found in the hydrophilic loop of fibronectin and aids the proliferation of attachment dependent cells like fibroblasts.16 Alternatively, enzymes released by cells could cleave functionalised N-termini from the hydrogel fibrils to release fragments that produce a measurable response, either in colour, fluorescence or liquid crystal orientation.9c Such biomaterials could be useful as in vivo or in vitro sensors for proteases that indicate a disease state, such as some matrix metalloproteases.
Materials and methods
All reagents were purchased from Sigma-Aldrich (UK), Novabiochem (UK) or AGTC (UK), and were of the highest grade available. Water used to prepare all samples was purified using a Millipore A10 system fitted with a 0.22 μm filter, with a resistivity of 18.2 MΩ cm (Billerica, Massachusetts, USA). The peptides p1, p2 and p1-RGD were synthesised, purified and characterised using standard methods (see the ESI†).Peptide gelation
Stiff hydrogels form in a wide range of buffers, but for the majority of experiments described herein the conditions used were: 10 mM p1 and 10 mM p2 in 100 mM phosphate buffer saline (PBS) buffer, pH 7.4, were mixed at 20 °C. These samples are referred to as ‘standard gel samples’.Electron microscopy
For negative staining transmission electron microscopy (TEM), diluted gel samples at pH 7 were placed onto glow-discharged 400 mesh carbon coated grids (Agar Scientific, Stansted, UK) for one minute. Grids were washed with doubly distilled water twice, and samples were then negatively stained with freshly-prepared and filtered 2% (w/v) uranyl acetate (Agar Scientific, Stansted, UK) for one minute, blotting at each stage using Whatman filter paper. Samples were viewed and recorded on two microscopes: a Tecnai Biotwin (FEI, Oregon, USA) under an accelerating voltage of 100 KV, and imaged with a GATAN Orius CCD (Gatan, Oxford, UK), with a sample increment of 3.5 Å pixel−1, or a Tecnai F30 (FEI, Oregon, USA) under an accelerating voltage of 100 KV. Image analysis was CTF corrected, using EMAN2 software. For helical turn projections, approximately 650 particle areas of helical turn were used. Individually selected particles were classified using multi-statistical analysis. Reference-free class average projection maps were generated. Fibre width and morphology analysis was performed using ImageJ.For scanning electron microscopy (SEM), gel samples were placed upon polished metal stubs, flash-frozen in liquid N2, then lyophilised for 24 h. Samples were sputter-coated with Pt/Pd and imaged using a Philips XL30 FEGSEM, fitted with a Nordlys II camera (Oxford Instruments, Abingdon, UK).
Fourier transform infra-red spectroscopy (FTIR)
Spectra were recorded from 4000 to 400 cm−1 (128 scans) on a Bruker Alpha FTIR spectrometer fitted with a platinum ATR module. Samples were prepared in D2O or H2O and gel samples were incubated for 24 h before acquisition. The D2O or H2O (water) background spectra were subtracted.Rheology
Measurements were performed on an AR-G2 rheometer fitted with a Peltier plate (TA instruments, Herts, UK). Unless otherwise stated, samples were prepared and incubated at 20 °C for 24 h before measurement. The storage (G′) and loss (G′′) moduli were recorded as a function of frequency sweeps between 0.1 and 100 Hz, at 0.1% strain unless otherwise stated. A solvent trap was used to keep samples fully hydrated during measurements, at 20 °C unless otherwise stated.Small-angle X-Ray scattering (SAXS)
Measurements were performed using a HECUS instrument with a Xenocs micro-focus copper source with Montel optics, using a Pilatus 100k detector (HECUS (Bruker), Coventry, UK). All samples were prepared at 20 °C, pH 7 unless otherwise stated. Gel samples were pre-incubated at this temperature for 24 h before use, and injected into the sample container prior to sealing and data acquisition.Cell culture
Hydrogels containing either p1 or a 9![[thin space (1/6-em)]](https://www.rsc.org/images/entities/char_2009.gif) :
:![[thin space (1/6-em)]](https://www.rsc.org/images/entities/char_2009.gif) 1 p1
1 p1![[thin space (1/6-em)]](https://www.rsc.org/images/entities/char_2009.gif) :
:![[thin space (1/6-em)]](https://www.rsc.org/images/entities/char_2009.gif) p1-RGD mixture combined with equimolar p2 (20 mM total peptide) were prepared through dilution of concentrated stock solutions with Dulbecco's Phosphate buffer solution (DPBS) to a final volume of 200 μL. The pH was adjusted to 7.2 with 1 M NaOH in each case, and samples incubated for 24 h at 20 °C. 3T3 Mouse fibroblasts were cultured in Dulbecco's modified eagle medium (DMEM) with L-glutamine, containing 10% fetal bovine serum (FBS) and 1% antibiotic–antimycotic solution. Hydrogel samples were shear-thinned through a 21 gauge needle until fluid, then immediately mixed with cell pellets (66
p1-RGD mixture combined with equimolar p2 (20 mM total peptide) were prepared through dilution of concentrated stock solutions with Dulbecco's Phosphate buffer solution (DPBS) to a final volume of 200 μL. The pH was adjusted to 7.2 with 1 M NaOH in each case, and samples incubated for 24 h at 20 °C. 3T3 Mouse fibroblasts were cultured in Dulbecco's modified eagle medium (DMEM) with L-glutamine, containing 10% fetal bovine serum (FBS) and 1% antibiotic–antimycotic solution. Hydrogel samples were shear-thinned through a 21 gauge needle until fluid, then immediately mixed with cell pellets (66![[thin space (1/6-em)]](https://www.rsc.org/images/entities/char_2009.gif) 000 cells for each 200 μL gel sample) and agitated until the cells were re-suspended. Seeded solutions were added to 24-well plate inserts (tissue culture plastic with PTFE membranes, 3 μm pore size), then DMEM (0.5 mL) was then added to the well around the insert after re-gelation and the sample was incubated at 37 °C. Visualisation of cells was performed on a Leica TCS SP5 confocal fluorescence microscope using associated LAS AF software.
000 cells for each 200 μL gel sample) and agitated until the cells were re-suspended. Seeded solutions were added to 24-well plate inserts (tissue culture plastic with PTFE membranes, 3 μm pore size), then DMEM (0.5 mL) was then added to the well around the insert after re-gelation and the sample was incubated at 37 °C. Visualisation of cells was performed on a Leica TCS SP5 confocal fluorescence microscope using associated LAS AF software.
Live dead assays were carried out using a LIVE/DEAD Viability/Cytotoxicity Kit® for mammalian cells (Life Technologies Corp.). At the desired timepoint, the media was removed and the hydrogel sample or glass coverslip control was washed with PBS (3 × 500 μL). A solution of ethidium homodimer (4 μM) and calcein O,O′-diacetate tetrakis(acetoxymethyl) ester (calcein AM, 2 μM) in PBS (300 μL) was added and the samples were incubated for 30 minutes at 37 °C. The dye solution was then removed and the samples were again washed with PBS (3 × 500 μL). The samples were then placed on microscope slides and immediately visualised (λex/λem = 494/517 nm for calcein, 528/617 nm for ethidium homodimer in the presence of DNA). Cell counts were performed manually from the images obtained.
Results and discussion
Design of peptides p1 and p2
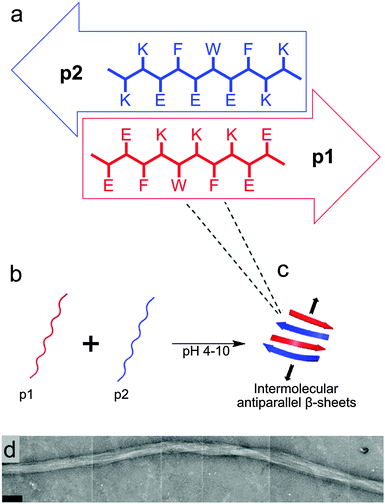
The design of the complementary peptides p1 and p2 (Fig. 1a) was largely based upon the simple ‘hphphp’ repeating pattern that is known to favour β-sheet formation.17 The side chain display in this pattern presents different “faces” on the opposite sides of peptides within a β-sheet array; one hydrophobic and the other polar. As used by Kyle et al.,2c the polar surfaces of each peptide were designed to be complementary, with a central display of glutamic acid or lysine residues with flanking residues of opposite charge. This pattern was designed to favour heterotypic over homotypic interactions and ensure aqueous solubility over a wide pH range; each peptide comprises 70% polar residues. The hydrophobic surfaces had central F-W-F displays to promote assembly, as aromatic residues are known to form stronger interactions with one another than to other hydrophobic amino acids.18 The tryptophan residues also facilitated the measurement of peptide concentrations using UV/visible spectroscopy. To extend the pH range over which gelation occurs, peptides p1 and p2 were designed with markedly different pI values, but the average of their pI values is 7.2, which ensures the stiffest hydrogel should form under physiological conditions.In the absence of homotypic interactions, p1 and p2 should self-assemble into “sticky-faced” dimers that are capable of forming fibrils composed of antiparallel β-sheet that grow perpendicular to peptide orientation (Fig. 1b and c). Because the termini should carry opposite charges under physiological conditions, the edges of fibrils will be patterned, facilitating higher-order assembly into thicker fibres. Fibres with β-structure are known to often form flexible, tape-like fibres that permit interweaving, which entangle to form self-supporting hydrogels at sufficiently high concentrations.19 Modification of the N-termini of p1 or p2 with bioactive peptide motifs should allow functional groups to be added that will project from the edges of fibrils, for example to facilitate cell-gel interactions. To this end, p1 was modified with RGD in the sequence RGDGGGEEFKWKFKEE (p1-RGD), which was designed to facilitate the growth of attachment sensitive cell types in the hydrogel.
The hydrogel was also designed to be protease resistant, which would enable its use with cultured cells as well as provide an enzyme-resistant scaffold for a protease sensor. Within the β-sheet fibres, the peptides will be highly sequestered and should be protected from proteolytic enzymes. To further improve protease resistance, residue sequences associated with susceptibility to proteolysis were not included in either p1 or p2. The predicted instability indices20 of p1 and p2 were calculated as −6.03 and 34.14 respectively, with values lower than 40 suggesting proteolytic stability.
Hydrogelation of p1 + p2 mixtures
Peptides p1 and p2 were synthesised using standard solid phase synthesis techniques,21 and purified using reverse-phase high performance liquid chromatography (RP-HPLC) to provide fine white powders that readily dissolved in aqueous media.22 Each peptide solution remained free-flowing over the pH range 1 to 14, at concentrations up to 0.2 M. Viscous solutions were formed upon the addition of salts such as NaCl however, and when individual peptide solutions were left for several hours at low (or high) pH. In some cases weak gels formed at room temperature, which could be resolubilised through brief heating or sonication.An equimolar mixture of p1 and p2 (>0.25% w/v) is a free-flowing solution below pH 4, but will form an optically clear hydrogel between pH 4 and 10, attaining maximum stiffness at pH 7.2 within a minute at 20 °C or 37 °C at 2.8% w/v (see ESI†). Above pH 10, the hydrogel formed reverts back to a free-flowing solution. This transition can be cycled >100 times by acidification/basification with little observable effect on hydrogel properties other than a slight increase in hydrogel stiffness due to an increase in salt concentration. If the gels were re-liquefied, the peptide components could be recovered and re-purified using RP-HPLC. The timescale of gelation depended strongly upon peptide concentration. The lowest concentration of each peptide in the mixture able to form a self-supporting hydrogel was 1 mM (2 mM total peptide), which required incubation at 20 °C for 24 h (0.28% w/v). Optically-clear hydrogels formed more rapidly as the total peptide concentration was increased to 40 mM. The addition of salts or buffer caused an increase in gelation speed, stiffness and opacity, e.g. standard samples with 20 mM total peptide formed stiff gels within a minute. These hydrogels are self-healing, reverting to free-flowing solutions when subjected to mechanical stress such as vigorous pipetting, yet reformed to form self-supporting hydrogels within 60 s for 20 mM total peptide and 10 h for 2 mM total peptide. Hydrogel lyophilisation yielded an intricate white mesh that did not reproduce a well-formed hydrogel upon simple rehydration. Lyophilised samples had to be redissolved by pH change or mechanical disruption before a hydrogel could reform.
Structural characterisation of p1 + p2 hydrogels
Both the molecular self-assembly of p1 and p2 and microscopic structure of these two-component peptide hydrogels was characterised using a combination of spectroscopy, microscopy and X-ray scattering. For the majority of assays, standard conditions were employed to give gels that would also be applicable to cell culture experiments (10 mM p1 and 10 mM p2 in 100 mM PBS buffer, pH 7.4, at 20 °C).Peptide secondary structure was analysed using ATR-FTIR (Fig. 2), exploiting the sensitivity of the amide I band to structure.23 Peaks at 1616 cm−1, 1684 cm−1 and a shoulder at 1695 cm−1 were observed in the standard hydrogel sample (Fig. 2a), with the latter confirmed to be a separate peak by second derivative analysis. The peaks at 1684 cm−1 and 1695 cm−1 correspond to β-sheet bands,24 while the strong peak at 1616 cm−1 can be attributed to extended antiparallel β-sheet. Although antiparallel β-sheet bands are normally observed between 1630 and 1643 cm−1 in globular proteins, a shift to between 1611 and 1630 cm−1 is characteristic of extended antiparallel β-sheets.25 Fibres that contain large numbers of β-strands in extended β-sheets typically have shorter and stronger hydrogen bonds than those normally found in globular proteins.26 This peak at 1616 cm−1 was not observed in the spectra of the weak hydrogels formed by p1 or p2 separately in the presence of NaCl (see the ESI†), suggesting that these were less ordered structures with a large proportion of unstructured peptide. Similarly, FTIR of either p1 or p2 in solution showed a complete lack of secondary structure, independent of pH or concentration up to 0.2 M, with a broad peak observed at 1654 cm−1 in all cases (Fig. 2b).
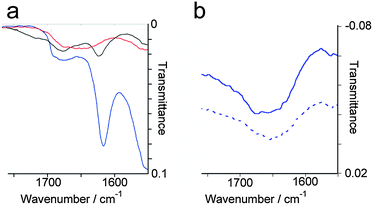 | ||
Fig. 2 Selected regions from water subtracted ATR-FTIR spectra of: (a) standard p1 + p2 gel samples at pH 1 (—), 14 ( ), and 7 ( ), and 7 ( ). (b) 10 mM p1 at pH 7 ( ). (b) 10 mM p1 at pH 7 ( ); 10 mM p2 at pH 7 ( ); 10 mM p2 at pH 7 ( ). ). | ||
To assess the effect of pH on peptide secondary structure, the pH of standard hydrogel samples (20 mM total peptide) was incrementally adjusted and the samples analysed by FTIR (Fig. 2a). The antiparallel β-sheet band at 1616 cm−1 that was observed at pH 7 became diminished upon changes in pH. Above pH 10, the resulting solution of p1 + p2 showed a complete lack of β-sheet structure, with a broad peak at 1654 cm−1 indicating the presence of unstructured peptide.27 However below pH 4 the solution of p1 + p2 showed peaks at 1623 cm−1, 1684 cm−1 and 1695 cm−1. These are similar to those seen at pH 7, but the lowest frequency peak (1623 cm−1) was weaker and shifted by only 7 cm−1, suggesting the presence of shorter antiparallel β-sheet stacks than in mature hydrogels. In conjunction with the lack of hydrogel formation, these observations suggest that small oligomers are formed at low pH rather than extended β-sheets.
Typically, low weight percentage gels formed from β-structured peptides such as p1 + p2 gain their structural integrity from interwoven flexible fibrils.28 To investigate if this was also the case for p1 + p2 hydrogels, SEM was performed on a standard gel sample that had been flash frozen in liquid N2, and lyophilised overnight (see the ESI†). The gel showed a porous structure (average pore diameter 11.5 μm (standard deviation (SD) = 3.79, standard error (SE) = 0.48, n = 238) containing very large fibres with an average diameter of 3.5 μm (SD = 0.79, SE = 0.13, n = 246). Closer inspection of these large fibres by SEM revealed they were composed of dense networks of smaller twisted and interlaced fibres that were generally oriented in the direction of the gel strand (see the ESI†). The average diameter of these smaller fibres was 96 nm (SD = 25.69, SE = 3.03, n = 145), much larger than the predicted width of a single peptide in antiparallel β-sheet conformation (∼3 nm). Closer inspection of the larger fibres revealed some were flat tapes twisted around themselves, in some cases producing apparently hollow cylinders.
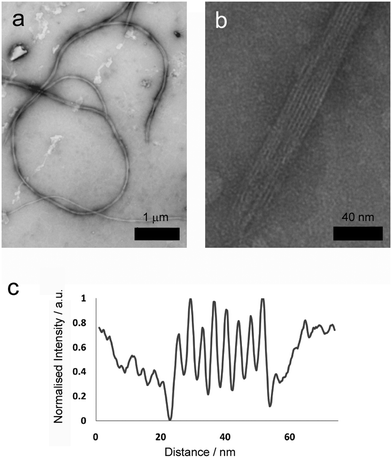
More detailed analysis was then performed using transmission electron microscopy (TEM) of standard gel samples that were diluted one hundred-fold in PBS and stained with uranyl acetate prior to imaging. Fibres of similar diameter to those previously observed were immediately obvious (Fig. 3a, average diameter 64.5 nm, SD = 8.24, SE = 0.71, n = 389). These species were one of the commonly observed structures, and were clearly flexible, often appearing wrapped into loops and intertwined with their neighbours (Fig. 3a, 2 to 100 μm in length, average 26 μm, SD = 12, SE = 5.0, n = 86). Occasionally tape-like structures were also observed (Fig. 3b), which had well-defined striations spiralling along the long axes.
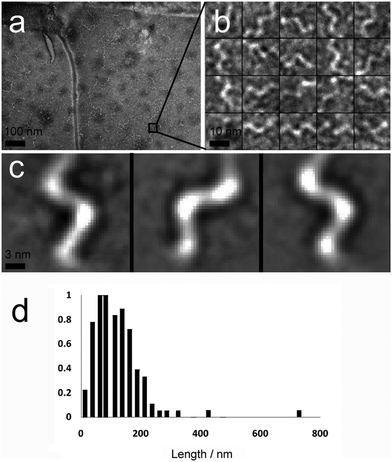
A second major species was also observed in the background of TEM images (Fig. 4a). These were also fibrous structures, but with much smaller dimensions; average length 116 nm (Fig. 4d, SD = 60.15, SE = 5.47, n = 1038), and average diameter 4.46 nm (SD = 1.10, SE = 0.05, n = 1038). These thin ‘fibrils’ have a diameter similar to the predicted widths of p1 and p2 in antiparallel β-sheet conformation (3.37 and 3.09 nm respectively). Unlike the larger fibres, which appeared to be linear and flexible, the smaller fibrils had a helical appearance (Fig. 4b and c). To determine if the fibrils actually had a helical shape, projection analysis was used. Projections from cropped images focusing on single turn-turn fibril repeats show that the conformation is very regular, consistent with helical structures or tapes with regular and periodic twisting. Such twisting of fibres has been observed previously in other β-sheet forming peptides and ascribed to the intrinsic chirality of the peptides.29 Such clearly defined and regular structures are unusual however, and may be evident in this system because of the strength and specificity of the interactions between the component peptides.
Where a flat tape lay directly on the grid, the striations in the tapes (Fig. 3b) were amenable to further analysis. Intensity profiles perpendicular to the fibre long axis (Fig. 3d) revealed the striations were regularly spaced at an average of 4.5 nm (SD = 0.64, SE = 0.12, n = 109), which was similar to the width to the smaller fibrils. This observation is consistent with fibre formation from laterally associated fibrils, a suggestion further supported by the observation of frayed and broken fibres that show apparently unravelled fibrils (see the ESI†). The observed difference between striation width and predicted p1 or p2 length in β-sheet conformation (3.09 or 3.37 nm respectively) may be due to salt bridges between terminal lysine and glutamine side chains in adjacent fibrils, which would add ∼1.3 nm to the fully extended conformation. The mechanism by which fibrils associate into fibres is unclear, but may be due to electrostatic attractions at the edges of fibrils between alternating N- and C-termini of the peptides.
To obtain structural information on whole hydrogel samples in situ that is complementary to the snapshots provided by TEM, small-angle X-ray scattering (SAXS) was employed. SAXS intensity I(q) was recorded for hydrogel samples with total peptide concentrations of 2, 5 and 10 mM (Fig. 5 and ESI†). Porod plots (log(I) versus log(q)) of these samples revealed an average (−1.80 ± 0.05) power relationship in the intermediate Guinier region, between the values for one-dimensional objects (−1 for infinitely thin fibres) and two-dimensional objects (−2 for sheets) (Fig. 5a, see the ESI†).30 These data correlate well with the TEM images that showed thin fibrils and fibres composed of sheets of aligned fibrils. In contrast, analysis of samples containing either p1 or p2 gave an average power relationship of (−3.40 ± 0.05) (Fig. 5b), a value between that for random polymer chains (power relationship −3) and three dimensional objects (power relationship −4). This supports the FTIR studies that suggested separated peptide components are predominantly unstructured. In addition to this analysis, structural peaks attributable to objects commensurate with fibre diameter were observed in hydrogel samples but not in dilute non-gelled samples (see the ESI†). For hydrogel samples containing total peptide concentrations of 2, 5 or 10 mM, broad peaks with maxima at q values of 0.065, 0.061 and 0.054 Å−1 were observed respectively. Using the Bragg relationship, for each concentration distances were estimated to be 96.7 nm (50.3–209.4), 104.7 nm (66.1–179.5), and 116.2 nm (72.4–201.9). This distance is approximately double the average fibre width of (64.5 ± 0.2) nm measured using TEM, which may be due to the collapse of twisted sheets onto the TEM grid surface during sample preparation. Interestingly, fibre widths appeared to increase with peptide concentration, as might be expected for a dynamic self-assembled system.
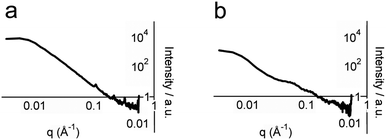 | ||
| Fig. 5 Porod analysis of SAXS profiles of: (a) 5 mM p1, pH 7.4, 20 °C and (b) 5 mM p1 and 5 mM p2, pH 7.4, 20 °C. | ||
Rheological properties of p1 + p2 hydrogels
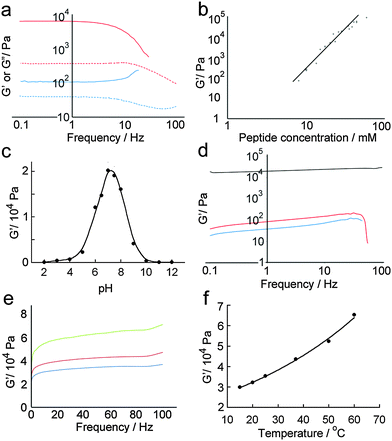
Quantitative analysis of hydrogel mechanical properties was performed using oscillatory shear rheometry, with both strain and frequency-sweep experiments performed to determine the storage (G′) and loss moduli (G′′). Strain-sweep experiments showed that moduli were independent of strain at 1%, which was used for later frequency sweep experiments (Fig. 6a).As might be anticipated, a maximum in gel stiffness was recorded for equimolar mixtures of p1 and p2, with deviations from the ideal ratio producing a steep decrease in rheological performance. Hydrogel stiffness increases with peptide concentration, from weak gels at 5 mM to stiff gels ≥14 mM (Fig. 6a and b). The storage modulus (G′) increased with increasing peptide concentration, up to a G′ of ∼100 kPa at 85 mM total peptide, providing relatively strong hydrogels31 with storage moduli similar to some of the best self-assembled aromatic peptide hydrogels.2c,9a,b,32 This range of storage moduli covers those suitable for the culture of soft tissues (0.1 to 100 kPa).33G′ was ∼10-fold greater than G′′, with both showing weak frequency dependencies (Fig. 6a); both features are characteristic of hydrogels.29 At the high shear levels experienced at high frequencies, a large decrease in G′ and G′′ was observed. The magnitude of the decrease depended on shear intensity and duration, but was typically 10 to 100-fold. However, >95% of the original gel stiffness could be recovered after an incubation period, which takes minutes to hours depending upon the peptide concentration (see the ESI†).
Changes in gel stiffness in response to pH were also quantified using oscillatory shear rheometry. Standard hydrogel samples were prepared at one-unit pH intervals, and strain and frequency sweeps performed (Fig. 6c and d). As expected from the average pI of the system, the maximum stiffness was attained at pH 7.2 (G′ = 21.2 kPa), which rapidly decreased at higher and lower pH. A deviation of ±2 units from pH 7 led to two-fold decreases in stiffness, and a deviation of ±4 pH units to a ten-fold decrease. The pH sensitivity of these hydrogels suggests potential medical applications in controlled and/or targeted drug release, e.g. in wound healing where local pH changes (e.g. lactic acid acidosis) could be used to trigger drug release.34
Self-assembled peptide hydrogels might be expected to “melt” if the assembled subunits disassociate when heated.15b,35 However, early indications were that this behaviour was not observed for p1 + p2 gels (Fig. 6e). A single standard hydrogel sample was then prepared at 15 °C and heated incrementally to 60 °C in a sealed cell, with the sample allowed to equilibrate for 10 minutes at each temperature before a frequency sweep was recorded. A plot of maximum G′ versus temperature (Fig. 6f) showed that hydrogel stiffness increased with temperature, which concurred with physical observations that the binary p1 + p2 gel became stronger when heated, during or after gelation. The reason for this behaviour is not clear, but annealing the sample may produce longer or stronger fibrillar structures from the aggregates that formed initially during the rapid gelation period after mixing.
Cell culture in p1 + p2 hydrogels
It was hoped that these three-dimensional self-assembled p1 + p2 hydrogel scaffolds would be capable of supporting cell growth. To show the utility of our modular approach to the creation of peptide based biomaterials, two hydrogel compositions were tested with attachment dependent 3T3 mouse fibroblasts; a standard hydrogel comprising p1 + p2, and an identical sample but with p1-RGD (RGDGGGEEFKWKFKEE) doped in at 5 mol% of total peptide (p1 + p2), which should aid the adhesion of these cells to the scaffold.36 Self-supporting hydrogel samples were prepared and incubated in Dulbecco's Modified Eagle Medium (DMEM, containing L-glutamine, fetal bovine serum and antibiotics) for 24 h at 20 °C prior to suspension of 3T3 mouse fibroblasts (66![[thin space (1/6-em)]](https://www.rsc.org/images/entities/char_2009.gif) 000 cells in each well, 200 μL gel) and further incubation for 3 days at 37 °C. The cell-hydrogel samples were then washed and live–dead assays performed (4 μM ethidium homodimer and 2 μM calcein AM in PBS) using confocal fluorescence microscopy.
000 cells in each well, 200 μL gel) and further incubation for 3 days at 37 °C. The cell-hydrogel samples were then washed and live–dead assays performed (4 μM ethidium homodimer and 2 μM calcein AM in PBS) using confocal fluorescence microscopy.
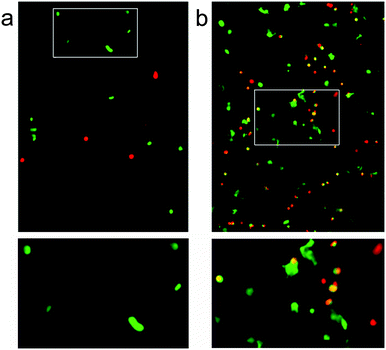
Over the three day incubation period, these p1 + p2 hydrogels in DMEM became considerably weaker compared to gel samples formed in PBS that had been treated in the same way, suggesting that either DMEM (see the ESI†) or the presence of cells may destabilise these self-assembled gels. Optical micrographs of live–dead assays taken at 72 h revealed that 43% of counted cells (n = 112) were viable in the standard p1 + p2 hydrogel. This indicated that the unfunctionalised β-sheet fibrillar scaffold of the p1 + p2 hydrogel is capable of sustaining these cells, although rounded cell morphology and low cell counts suggested poor attachment to the gel matrix (Fig. 7a). However, doping of the gel with p1-RGD (5 mol% of total peptide, equivalent to 1 mM RGD) led to a statistically significant (χ2 association test gives p = 0.010) improvement in cell-survival rates at 72 h for these attachment dependent fibroblasts, to 55% (of 1753 counted cells). In the RGD-doped gels, a much larger number of cells were present and the live cells appeared more spread (Fig. 7b). Although cell viability is lower than the 80–90% values recently reported for RGD-doped gels,37 these observations suggest that the RGD sequences immobilised in the fibrils are available and aid cell recognition. The modular nature of the p1 + p2 system should facilitate further improvement of these gels for the culture of adherent cells, for example the synthesis of other modified p1 peptides that project RGD further from the hydrogel fibrils.
Conclusions
Hydrogels are produced by the self-assembly of peptides p1 + p2 into antiparallel β-sheets, which undergo hierarchical self-assembly into different fibrillar structures including large twisted fibres. These hydrogels have been shown to have a number of desirable properties for applications as cell culture scaffolds. The gels are optically transparent, self-healing, stable to dilution, and can be formed in a range of buffers. Gel stiffness can be “dialled in” across a wide and biologically-relevant range (102 < G′ < 105 Pa) by changing peptide concentration, with heating unexpectedly increasing gel stiffness rather than the decrease normally associated with hydrogels based on peptide secondary structures.38 Optimum hydrogel stiffness is attained at physiological pH, and is reversibly reduced upon pH changes as small as a few units. Since hydrogels can store and slowly release biologically-relevant molecules such as drugs, this pH sensitivity could be used to trigger release in regions experiencing acidosis/alkalosis. The binary nature of p1 + p2 hydrogels could also lead to potential applications as injectable biomaterials.13Adding cell recognition groups to the N-terminus of the p1 peptide can give cell culture scaffolds that present this functionality to the external environment. For example, initial studies showed that the introduction of 5 mol% p1-RGD into p1 + p2 hydrogels improved the viability of 3T3 mouse fibroblasts in these hydrogels. The binary and self-healing nature of p1 + p2 hydrogels lends itself to three dimensional cell culture conditions, with the modular dopable nature of these gels potentially allowing a range of other cell recognition sequences, such as IKVAV or polysaccharides, to decorate the gel fibres. The exposure of functional groups on the N-termini of p1 to the surrounding solution also opens a pathway to the covalent attachment of sensor features onto the peptide fibrils. In particular, chromophores, fluorophores and lipids attached through protease cleavable sequences to p1 N-termini potentially allows in situ detection of proteases released by cells proliferating in these materials either in vivo or in vitro. Preliminary data indicate that p1 variants linked by enzyme cleavable sequences to a dye (dabsyl) can release chromophoric fragments upon trypsin addition, and investigations are continuing into the creation of such enzyme-sensitive biomaterials.
Acknowledgements
We thank Dr A. Saiani for helpful advice and Prof. S. L. Flitsch for the use of a peptide synthesiser. We also thank the BBSRC (grant refs. BB/G014337/1 and BBSRC DTG) and the ESPRC (grant ref. EP/N009134/1). Additional research data supporting this publication are available from the eScholar repository at http://dx.doi.org/10.15127/1.293595.Notes and references
- (a) V. Jayawarna, M. Ali, T. A. Jowitt, A. F. Miller, A. Saiani, J. E. Gough and R. V. Ulijn, Adv. Mater., 2006, 18, 611–614 CrossRef CAS; (b) D. G. Anderson, J. A. Burdick and R. Langer, Science, 2004, 305, 1923–1924 CrossRef CAS PubMed; (c) M. P. Lutolf, F. E. Weber, H. G. Schmoekel, J. C. Schense, T. Kohler, R. Müller and J. A. Hubbell, Nat. Biotechnol., 2003, 21, 513–518 CrossRef CAS PubMed; (d) F. de Cogan, A. Booth, J. E. Gough and S. J. Webb, Angew. Chem., Int. Ed. Engl., 2011, 50, 12290–12293 CrossRef CAS; (e) F. de Cogan, A. Booth, J. E. Gough and S. J. Webb, Soft Matter, 2013, 9, 2245–2253 RSC.
- (a) D. N. Woolfson and Z. N. Mahmoud, Chem. Soc. Rev., 2010, 39, 3464–3479 RSC; (b) R. Orbach, I. Mironi-Harpaz, L. Adler-Abramovich, E. Mossou, E. P. Mitchell, V. T. Forsyth, E. Gazit and D. Seliktar, Langmuir, 2012, 28, 2015–2022 CrossRef CAS PubMed; (c) V. Jayawarna, S. M. Richardson, A. Hirst, N. W. Hodson, A. Saiani, J. E. Gough and R. V. Ulijn, Acta Biomater., 2009, 5, 934–943 CrossRef CAS PubMed; (d) S. Kyle, S. H. Felton, M. J. McPherson, A. Aggeli and E. Ingham, Adv. Healthcare Mater., 2012, 1, 640–645 CrossRef CAS PubMed; (e) S. Maude, E. Ingham and A. Aggeli, Nanomedicine, 2013, 8, 823–847 CrossRef CAS PubMed; (f) A. Mujeeb, A. F. Miller, A. Saiani and J. E. Gough, Acta Biomater., 2013, 9, 4609–4617 CrossRef CAS PubMed.
- (a) R. V. Ulijn, N. Bibi, V. Jayawarna, P. D. Thornton, S. J. Todd, R. J. Mart, A. M. Smith and J. E. Gough, Mater. Today, 2007, 10, 40–48 CrossRef CAS; (b) R. J. Mart, R. D. Osborne, M. M. Stevens and R. V. Ulijn, Soft Matter, 2006, 2, 822–835 RSC.
- M. Zhou, A. M. Smith, A. K. Das, N. W. Hodson, R. F. Collins, R. V. Ulijn and J. E. Gough, Biomaterials, 2009, 30, 2523–2530 CrossRef CAS PubMed.
- M. W. Tibbitt and K. S. Anseth, Biotechnol. Bioeng., 2009, 103, 655–663 CrossRef CAS PubMed.
- Z. M. Yang, G. L. Liang, M. L. Ma, Y. Gao and B. Xu, Small, 2007, 3, 558–562 CrossRef CAS PubMed.
- A. G. Patrick and R. V. Ulijn, Macromol. Biosci., 2010, 10, 1184–1193 CrossRef CAS PubMed.
- P. D. Thornton, R. J. Mart, S. J. Webb and R. V. Ulijn, Soft Matter, 2008, 4, 821–827 RSC.
- (a) Y. Gao, F. Zhao, L. Wang, Y. Zhang and B. Xu, Chem. Soc. Rev., 2010, 39, 3425–3433 RSC; (b) S. K. M. Nalluri and R. V. Ulijn, Chem. Sci., 2013, 4, 3699–3705 RSC; (c) I.-H. Lin, L. S. Birchall, N. Hodson, R. V. Ulijn and S. J. Webb, Soft Matter, 2013, 9, 1188–1193 RSC.
- M. D. Segarra-Maset, V. J. Nebot, J. F. Miravet and B. Escuder, Chem. Soc. Rev., 2013, 42, 7086–7098 RSC.
- (a) E. F. Banwell, E. S. Abelardo, D. J. Adams, M. A. Birchall, A. Corrigan, A. M. Donald, M. Kirkland, L. C. Serpell, M. F. Butler and D. N. Woolfson, Nat. Mater., 2009, 8, 596–600 CrossRef CAS PubMed; (b) N. Yamaguchi, L. Zhang, B.-S. Chae, C. S. Palla, E. M. Furst and K. L. Kiick, J. Am. Chem. Soc., 2007, 129, 3040–3041 CrossRef CAS PubMed; (c) H. D. Lu, M. B. Charati, I. L. Kim and J. A. Burdick, Biomaterials, 2012, 33, 2145–2153 CrossRef CAS PubMed; (d) F. Ito, K. Usui, D. Kawahara, A. Suenaga, T. Maki, S. Kidoaki, H. Suzuki, M. Taiji, M. Itoh, Y. Hayashizaki and T. Matsuda, Biomaterials, 2010, 31, 58–66 CrossRef CAS PubMed.
- C. T. S. Wong Po Foo, J. S. Lee, W. Mulyasasmita, A. Parisi-Amon and S. C. Heilshorn, Proc. Natl. Acad. Sci. U. S. A., 2009, 106, 22067–22072 CrossRef PubMed.
- Y. Li, J. Rodrigues and H. Tomás, Chem. Soc. Rev., 2012, 41, 2193–2221 RSC.
- (a) R. J. Swanekamp, J. J. Welch and B. L. Nilsson, Chem. Commun., 2014, 50, 10133–10136 RSC; (b) S. Boothroyd, A. Saiani and A. F. Miller, Biopolymers, 2014, 101, 669–680 CrossRef CAS; (c) A. M. Jonker, D. W. P. M. Löwik and J. C. M. van Hest, Chem. Mater., 2012, 24, 759–773 CrossRef CAS.
- (a) D. N. Woolfson, Adv. Protein Chem., 2005, 70, 79–112 CrossRef CAS PubMed; (b) A. Fersht, Structure and Mechanism in Protein Science: A Guide to Enzyme Catalysis and Protein Folding, 3rd edn, W. H. Freeman & Co Ltd, 1999 Search PubMed.
- (a) E. Ruoslahti, Annu. Rev. Cell Dev. Biol., 1996, 12, 697–715 CrossRef CAS PubMed; (b) X. Z. Shu, K. Ghosh, Y. Liu, F. S. Palumbo, Y. Luo, R. A. Clark and G. D. Prestwich, J. Biomed. Mater. Res., Part A, 2004, 68, 365–375 CrossRef PubMed.
- C. E. MacPhee and D. N. Woolfson, Curr. Opin. Solid State Mater. Sci., 2004, 8, 141–149 CrossRef CAS.
- C. D. Tatko and M. L. Waters, J. Am. Chem. Soc., 2002, 124, 9372–9373 CrossRef CAS PubMed.
- I. A. Nyrkova, A. N. Semenov, A. Aggeli, M. Bell, N. Boden and T. C. B. McLeish, Eur. Phys. J. B, 2000, 17, 499–513 CrossRef CAS.
- K. Guruprasad, B. V. B. Reddy and M. W. Pandit, Protein Eng., Des. Sel., 1990, 4, 155–161 CrossRef CAS.
- R. B. Merrifield, J. Am. Chem. Soc., 1963, 85, 2149–2154 CrossRef CAS.
- These solutions were normally between pH 1 and 3 due to residual traces of acid.
- FTIR was preferred to circular dichroism as this enabled structural analysis of peptides within the hydrogel environment rather than in dilute samples.
- A. Barth, Biochim. Biophys. Acta, 2007, 1767, 1073–1101 CrossRef CAS PubMed.
- G. Zandomeneghi, M. R. H. Krebs, M. G. McCammon and M. Fandrich, Protein Sci., 2004, 13, 3314–3321 CrossRef CAS.
- (a) R. Sarroukh, E. Cerf, S. Derclaye, Y. F. Dufrêne, E. Goormaghtigh, J.-M. Ruysschaert and V. Raussens, Cell. Mol. Life Sci., 2010, 68, 1429–1438 CrossRef; (b) R. Sarroukh, E. Goormaghtigh, J.-M. Ruysschaert and V. Raussens, Biochim. Biophys. Acta, Biomembr., 2013, 1828, 2328–2338 CrossRef CAS PubMed.
- V. Castelletto, I. W. Hamley, R. A. Hule and D. J. Pochan, Angew. Chem., Int. Ed., 2009, 48, 2317–2320 CrossRef CAS.
- A. Aggeli, I. A. Nyrkova, M. Bell, R. Harding, L. Carrick, T. C. B. McLeish, A. N. Semenov and N. Boden, Proc. Natl. Acad. Sci. U. S. A., 2001, 98, 11857–11862 CrossRef CAS.
- V. Kayser, D. A. Turton, A. Aggeli, A. Beevers, G. D. Reid and G. S. Beddard, J. Am. Chem. Soc., 2004, 126, 336–343 CrossRef CAS.
- B. Hammouda, J. Appl. Crystallogr., 2010, 43, 716–719 CrossRef CAS.
- C. Yan and D. J. Pochan, Chem. Soc. Rev., 2010, 39, 3528–3540 RSC.
- (a) I. Maity, D. B. Rasale and A. K. Das, Soft Matter, 2012, 8, 5301–5308 RSC; (b) V. Castelletto, C. M. Moulton, G. Cheng, I. W. Hamley, M. R. Hicks, A. Rodger, D. E. López-Pérez, G. Revilla-López and C. Alemán, Soft Matter, 2011, 7, 11405–11415 RSC.
- R. J. Wade and J. A. Burdick, Mater. Today, 2012, 15, 454–459 CrossRef CAS.
- L. A. Schneider, A. Korber, S. Grabbe and J. Dissemond, Arch. Dermatol. Res., 2007, 298, 413–420 CrossRef PubMed.
- J. Branden Tooze, Introduction to Protein Structure, Garland Science, 2nd edn, 1998 Search PubMed.
- S. B. Lowe, V. T. G. Tan, A. H. Soeriyadi, T. P. Davis and J. J. Gooding, Bioconjugate Chem., 2014, 25, 1581–1601 CrossRef CAS.
- (a) 80–90% viability of fibroblasts after 8 days in RGD-doped gel, see: B. L. Farrugia, K. Kempe, U. S. Schubert, R. Hoogenboom and T. R. Dargaville, Biomacromolecules, 2013, 14, 2724–2732 CrossRef CAS PubMed; (b) 81% viability of human mesenchymal stem cells after 4 days in fibronectin-doped gel, see: D. J. Menzies, A. Cameron, T. Munro, E. Wolvetang, L. Grøndahl and J. J. Cooper-White, Biomacromolecules, 2013, 14, 413–423 CrossRef CAS PubMed; (c) 83% viability of fibroblasts after 1 day in RGD-doped gel, see: R. Reeves, A. Ribeiro, L. Lombardo, R. Boyer and J. B. Leach, Polymers, 2010, 2, 252–264 CrossRef CAS PubMed.
- A. Dasgupta, J. H. Mondal and D. Das, RSC Adv., 2013, 3, 9117–9149 RSC.
Footnote |
| † Electronic supplementary information (ESI) available: Gelation times, images of p1 + p2 hydrogels, additional FTIR, SEM, TEM, SAXS and rheology data. See DOI: 10.1039/c5sm02039e |
| This journal is © The Royal Society of Chemistry 2016 |

