 Open Access Article
Creative Commons Attribution 3.0 Unported Licence
Photocharged BiVO4 photoanodes for improved solar water splitting†
Bartek J.
Trześniewski
and
Wilson A.
Smith
*
Delft University of Technology, Faculty of Applied Sciences, Department of Chemical Engineering, Materials for Energy Conversion and Storage (MECS), Julianalaan 136, 2628 BL Delft, The Netherlands. E-mail: W.A.Smith@tudelft.nl
First published on 1st July 2015
Abstract
Bismuth vanadate (BiVO4) is a promising semiconductor material for the production of solar fuels via photoelectrochemical water splitting, however, it suffers from substantial recombination losses that limit its performance to well below its theoretical maximum. Here we demonstrate for the first time that the photoelectrochemical (PEC) performance of BiVO4 photoanodes can be dramatically improved by prolonged exposure to AM 1.5 illumination in the open circuit (OC) configuration. Photoanodes subjected to such light treatment achieve a record photocurrent for undoped and uncatalysed BiVO4 of 3.3 mA cm−2 at 1.23 VRHE. Moreover, photoelectrochemical tests with a sacrificial agent yield significantly enhanced catalytic efficiency over the whole operating potential range, suggesting elimination of major losses at the semiconductor–electrolyte interface. Finally, we demonstrate that this so-called ‘photocharging’ technique induces a considerable cathodic shift in the photocurrent onset potential and increases the photovoltage extracted from BiVO4 photoanodes.
Introduction
Photoelectrochemical (PEC) water splitting offers an efficient and sustainable way to store solar energy in the form of chemical bonds.1–3 One of the most attractive ways to achieve this solar driven water splitting is by using light-absorbing semiconductors to capture and convert sunlight into chemical energy by driving the corresponding water reduction and oxidation reactions. Bismuth vanadate (BiVO4) is a promising n-type semiconducting material for photoelectrochemical water splitting devices due to its ability to absorb visible light (band-gap energy ∼ 2.4 eV), a favorable conduction band edge position (just below the water reduction potential), and its relative stability in near-neutral aqueous environments. Moreover, it is made of cheap, non-toxic, earth-abundant elements and can be easily produced on a large scale. In order to make the production of solar hydrogen with BiVO4 viable, its performance bottlenecks and limitations have to be identified and addressed accordingly.Based on its band gap energy, BiVO4 should be able to produce upwards of ∼7.5 mA cm−2 of photocurrent under AM 1.5 irradiation.4,5 However, to date, this photoanode has achieved far less than its full potential. It has been suggested that BiVO4 suffers from poor surface catalytic activity, and thus many strategies have focused on passivating or putting dedicated oxygen evolution catalysts (OECs) on its surface. The results of both passivation and co-catalysis have achieved significantly enhanced photoactivity at reduced overpotentials, but the mechanism for how these methods work are limited. In fact, a new performance benchmark for BiVO4 photoanodes has recently been set by Kim and Choi,6 who observed photocurrent densities of 1.7 mA cm−2 (at 1.23 VRHE) for undoped nanostructured BiVO4, and 4.5 mA cm−2 (at 1.23 VRHE) for BiVO4 catalysed with a dual layer FeOOH/NiOOH OEC. Many other attempts have been made to improve the surface catalytic reactivity of BiVO4 by the addition of other OEC's such as Co–Pi, Co–Bi and Ni–Bi.7–10 However, strong parasitic light absorption by OECs (up to 20% for layers as thin as 2 nm)11 can make them prohibitive to use in tandem water splitting devices that require illumination through the electrolyte/OEC interface. In addition, the catalytic activity at low bias potentials remains low for photoanodes even when modified with co-catalysts. It is therefore of paramount importance to understand the physical and chemical nature of the semiconductor/electrolyte interface in BiVO4 photoanodes, specifically the role of electronic surface states that may constitute the favorable pathways for unwanted recombination. Therefore new strategies to tackle surface catalytic reactivity are necessary.
In addition to its poor surface catalytic reactivity, BiVO4 also suffers from poor charge separation efficiency due to bulk recombination losses. It has been reported that spray deposited BiVO4 photoanodes have 35% charge separation efficiency at 1.23 VRHE,12 showing that bulk processes are severely limiting its performance. Previous research has aimed at tackling this problem by introducing elemental doping, most notably with W and Mo.12–14 Of particular note, the most significant improvement in the charge separation efficiency was reported by utilizing a novel W-gradient doping profile in the BiVO4, which significantly increased the charge separation efficiency in the bulk of the photoanode.15
Herein we report a new photoanode treatment technique made possible by so-called ‘photocharging’. We demonstrate that the PEC performance of BiVO4 photoanodes can be dramatically improved by prolonged exposure to AM 1.5 illumination in the open circuit (OC) configuration. Such a light treatment results in double the record benchmark photocurrent density for undoped and uncatalyzed BiVO4 at 1.23 VRHE, a 0.3 V cathodic shift of the photocurrent onset potential, and near unity catalytic efficiency in the operational potential range. Preliminary analysis shows that this overall performance enhancement is largely due to improvements in the surface of the BiVO4 photoanodes, though it was also observed that bulk modifications may also play a role in the enhanced activity as well. Ultimately, we demonstrate a novel approach to investigate and improve the nature of the BiVO4/electrolyte interface leading to a new benchmark performance for un-doped and un-catalyzed BiVO4 photoanodes.
Experimental
Preparation of BiVO4 thin film photoanodes
Thin films of 200 nm thick BiVO4 were prepared by spray pyrolysis on FTO coated glass substrates. Details of the deposition procedure are described elsewhere5,12 and are also available in the ESI.† Prior to deposition of the BiVO4, a SnO2 interfacial layer (∼80 nm) was deposited onto the FTO substrate at 425 °C to prevent recombination at the FTO/BiVO4 interface.16 The substrate temperature during spraying of BiVO4 was maintained at 450 °C. After deposition, the samples were further annealed for 2 h in a tube furnace at 450 °C in air.Photoelectrochemical (PEC) measurements
Photoelectrochemical characterization of BiVO4 photoanodes was carried out in an electrochemical cell using a three-electrode configuration. A 0.1 M phosphate buffer (0.1 K–Pi) was used as electrolyte, prepared by dissolving K2HPO4 (98%, Sigma) and KH2PO4 (99%, Sigma) in Milli-Q water (18.2 MΩ cm) to obtain pH 7.2. The potential of the working electrode was controlled by a multi-channel potentiostat (Parstat MC, Princeton Applied Research). An Ag/AgCl electrode (XR300, saturated KCl + AgCl solution (KS120), Radiometer Analytical) and a coiled Pt wire were used as the reference and counter electrodes, respectively. Measurements under illumination were performed with a Newport Sol3A Class AAA solar simulator (type 94023A-SR3) producing simulated AM 1.5 solar illumination (100 mW cm−2). In all the experiments involving illumination, BiVO4 samples were illuminated from the back-side, i.e. the light came through the substrate side first.The photovoltage of BiVO4 photoanodes was investigated with a series of open circuit (OC) measurements; potential of the working electrode (VWE) was monitored in the dark and under AM 1.5 illumination until an equilibrium plateau in the VWE(t) was reached.
The photocharging of BiVO4 photoanodes was performed in OC conditions under illumination. BiVO4 samples were placed in the electrochemical cell and exposed to AM 1.5 light until the plateau of VWE(t) was reached (10 hours on average).
Cyclic voltammetry scans were taken at a scan speed of 50 mV s−1 unless stated otherwise. To examine the catalytic efficiency, 1.5 ml of H2O2 (30%, Merck) was added to the electrolyte solution.
X-ray photoelectron spectroscopy (XPS)
XPS experiment was performed using the Thermo Scientific K-alpha apparatus equipped with an Al K-alpha X-ray Source and a Flood Gun. Parameters used for the measurements were: spot size of 400 μm, pass energy of 50 eV, energy step size of 0.1 eV, dwell time of 50 ms, 10 scans in the vicinity of V2p orbital binding energy. XPS spectra were corrected for the C peak position.Results and discussion
Photoelectrochemical (PEC) measurements
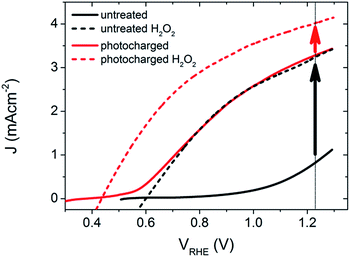
The PEC performance of the untreated BiVO4 photoanodes was first measured under AM 1.5 irradiation to obtain the photocurrent density as a function of the applied potential, as shown in Fig. 1. The untreated samples show a photocurrent onset potential (Von) of ∼0.7 VRHE, and a photocurrent density of 0.8 mA cm−2 at 1.23 VRHE (solid black curve). Within the range of potentials applied, the current density vs. voltage (J–V) curve has a very poor slope, a concave shape, and doesn't obtain a saturated current density, suggesting a substantial amount of surface recombination. It has been previously shown,12 that H2O2 is an excellent hole scavenger for BiVO4 photoanodes in these conditions, and thus it is proposed that when using H2O2 in the electrolyte solution, the performance can be estimated to yield near 100% catalytic efficiency. Therefore, using an electrolyte with H2O2 provides the benchmark for the highest expected activity that these photoelectrodes can achieve if there are no surface recombination losses. When the un-treated BiVO4 photoanodes were measured in an electrolyte containing H2O2, the JV curves show a remarkable, but expected, improvement in both the on-set potential (Von = 0.6 VRHE) and photocurrent density at 1.23 V vs. RHE (J = 3.3 mA cm−2), as shown in the dashed black curve in Fig. 1. The PEC performance of the BiVO4 photoanodes in H2O and in an H2O2 containing electrolyte are used to act as a reference for the activity of our untreated samples in an aqueous solution, and with no surface catalytic losses.After obtaining the JV characteristics of the pure BiVO4 photoanodes, the samples were subjected to a simple pre-treatment technique. The BiVO4 photoanodes were placed in the PEC cell and held in OC conditions (i.e. no applied bias) and exposed to AM 1.5 illumination until an equilibrium potential was observed (10 hours on average). We subsequently refer to this process as photocharging. Immediately following this photocharging treatment, the JV characteristics under AM 1.5 illumination were measured for the treated samples (shown in Fig. 1, red solid curve), and the photocharged photoanodes show strikingly different PEC features than the untreated films.
After the photocharging treatment, the shape of the JV characteristic becomes convex and a record photocurrent of 3.3 mA cm−2 at 1.23 VRHE for undoped and uncatalyzed BiVO4 was achieved. In addition, the treated photoanodes show a substantial cathodic shift of the Von by ∼0.3 V. Remarkably, the J–V of the photocharged photoanode follows almost exactly the photocurrent of the un-treated BiVO4 measured in the presence of H2O2. The shape of the J–V curve suggests17 major suppression of the surface recombination due to the very steep photocurrent slope, relatively low applied potential required to achieve a saturated current density, and convex shape of the curve. The PEC performance of the photocharged BiVO4 samples was similarly tested after adding H2O2 to the electrolyte, as shown in the dashed red curve in Fig. 1. Surprisingly, the JV characteristics under these conditions showed a further decreased onset potential, Von = 0.43 VRHE, and a larger photocurrent density at 1.23 VRHE, J = 4.0 mA cm−2.
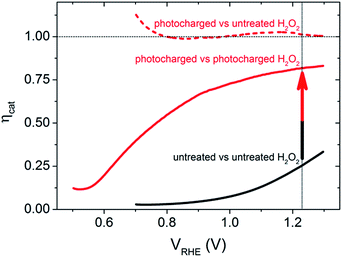
To further quantify the change in the surface reactivity for each of the BiVO4 photoanodes (before and after photocharging), the catalytic efficiency, ηcat, was calculated using the method developed by Dotan et al.,18 where the current density in the normal aqueous solution is directly compared to that obtained in the presence of H2O2, as shown in Fig. 2. It is confirmed that the untreated BiVO4 photoanode has very poor catalytic activity, shown by a very low ηcat (maximum of 25% at 1.23 VRHE). In contrast, the ηcat of the photocharged sample showed significant improvements as shown in the dashed and solid red curves. If the photocharged BiVO4 photoanode was compared to the initial untreated sample measured in H2O2, the dashed red curve in Fig. 2 is obtained, showing unity ηcat across the entire potential range. This is expected since the JV curves overlap for the two samples. However, if the photocharged sample was compared to itself with and without H2O2, the solid red curve in Fig. 2 is obtained. The ηcat for this newly photocharged sample now reaches a maximum of 80% at 1.23 VRHE, and even achieves reasonable efficiencies at lower potentials, with a ηcat of 55% at 0.8 VRHE. These results have three major implications: (1) the photocharging treatment significantly improves the catalytic efficiency of the BiVO4 photoanodes, (2) there are still some surface catalytic losses for photocharged electrodes and (3) a bulk/non-surface related improvement was also achieved. Comparing the solid red curve and the solid black curve in Fig. 2 clearly shows that there is an enhancement in the catalytic efficiency due to the photocharging treatment. However, if the improvement was achieved only due to the modification of the surface of BiVO4, then it would be expected that the performance in a solution containing H2O2 would be identical for the untreated and photocharged samples (dashed black and dashed red in Fig. 1), which is not the case. Therefore, since the JV curves of the photocharged BiVO4 sample and the untreated sample in H2O2 overlap, and there is still a further improvement in current when a photocharged sample is measured in presence of H2O2, there must be a non-catalytic enhancement, which will be discussed later.
The PEC performance of the photocharged photoanodes was found to be stable within 20 voltammetric cycles in the potential range of 0.5–1.3 VRHE, with no observable decrease in the photocurrent density (ESI, Fig. S1†).
However, a photocharged sample left in the electrochemical cell over-night and re-measured on the next day exhibits very similar J–V characteristics to what is measured initially, before photocharging. This shows that dark OC conditions facilitate the deactivation of the improved PEC performance. Nonetheless, the process of photocharging repeated later on is equally effective and results in recovery of the improved performance (ESI, Fig. S2†). This finding may limit this technique to have a lasting effect in a practical device for PEC water splitting, but a prospective challenge for further development would be to ‘lock-in’ the photocharging effect on the photocharged BiVO4 surface.
Photovoltage of BiVO4
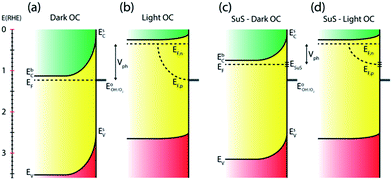
Numerous reports have shown that the performance of metal oxide photoanodes can be greatly hindered by the presence of electronic surface states (SuS).19,20 It has been proposed that the electronic nature of the SuS results in the pinning of the Fermi level (EF), which has a detrimental effect on the obtainable photovoltage (Vph). Likewise, it has been demonstrated that these SuS can be passivated, leading to an increased Vph, a cathodically shifted Von and higher photocurrent densities.21–25 Therefore, to better understand whether the observed change in PEC properties of our BiVO4 photoanodes is related to the presence of SuS, an investigation of the change in Vph for our samples before and after the photocharging treatment has been conducted.The equilibration conditions of n-type semiconductors in aqueous-based electrolytes have been described in detail in previously reported literature.26–28 It has been proposed that in the dark and in an OC configuration and ideal conditions, i.e. with a pristine electrode surface with no surface defect states, the Fermi level (EF) of a photoanode equilibrates with the water oxidation potential ( = 1.23 VRHE) (Fig. 3(a)). Whereas under illumination, the quasi-Fermi level of the electrons (EF,n) shifts towards the conduction band edge (ESC) and quasi-Fermi level of the holes (EF,p) equilibrates with
  (Fig. 3(b)).
However, when surface states with sufficient density (DOS ∼ 1013 to 1014)29 exist at the semiconductor/electrolyte interface, a significant potential drop in the Helmholtz layer is likely to develop.30 Consequently the EF doesn't equilibrate with  and instead aligns with the energy level of the SuS (ESuS)21,28 (Fig. 3(c)). The potential drop in the Helmholtz layer results in a so-called Fermi level pinning effect.31 Under Fermi level pinning conditions, any change in pH or applied potential is accommodated by a change in the occupation of the SuS and a corresponding change in the potential drop across the Helmholtz layer.28 As a result, the Fermi level stays virtually fixed and the degree of band bending remains constant, and a significantly lower photovoltage is obtained.
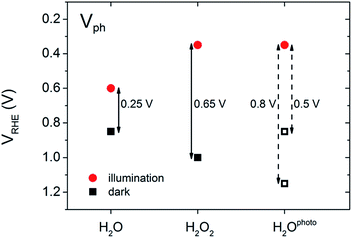
In our experiments, we performed a set of PEC measurements in the OC configuration to investigate the behaviour of our BiVO4 photoanodes in this respect. The potential of the working electrode (VWE) was monitored in the dark and under illumination until a steady state equilibrium was observed, i.e. the potential of the working electrode remained constant over time (ESI, Fig. S3 and S4†). The photovoltage (Vph) was calculated as VWE,dark − VWE,light. Fig. 4 contains a summary of the measured and estimated OC potentials in the dark and under illumination for BiVO4 photoanodes in water (H2O), in the presence of hydrogen peroxide (H2O2) and after photocharging (H2Ophoto).
The equilibrium potential of the untreated BiVO4 photoanode was found to be more negative than the water oxidation potential by ca. 0.4 V. A likely reason for the mismatch between the observed value of EF and  is the presence of SuS's on the BiVO4 surface. These results are in agreement with studies on α-Fe2O3 and TiO2 electrodes,20 where equilibration potentials of ca. 0.8 VRHE have been reported (OC dark conditions), suggesting that this may be an effect typical for metal oxide photoanodes. This consistency implies that SuS are independent of the exact composition of a metal oxide and originate from some surface adsorbate species and/or water oxidation intermediates that bind preferentially to metal oxide surfaces. Furthermore, when a hole scavenger is present in the electrolyte, we observed values of VWE (H2O2 dark) much closer to 1.23 VRHE, i.e. 1.0 VRHE. This can be explained by the fact that H2O2 is not only an efficient acceptor of photogenerated holes, but can also easily donate electrons to the SuS's of BiVO4, as the oxidation potential of H2O2 (0.68 VRHE) is more negative than ESuS.
The dark OC potential of the photocharged anodes could not be directly determined using the standard approach. That's because dark OC conditions facilitate the deactivation of the photocharging effect, therefore the measured dark OC potential corresponds rather to the untreated material. Consequently, two different approaches were used to estimate the photovoltage of the photocharged photoanodes. It's been proposed21 that there is direct correlation between the onset potential and the position of the dark OC potential. Therefore in the first approach the photovoltage was estimated based on the cathodic shift of the onset potential observed for the photocharged anodes. In the second approach the dark OC potential was assumed to be the same as the one of the untreated photoanodes.
Photocharged BiVO4
To further explore the PEC properties of the photocharged BiVO4 photoanodes, dark electrochemical experiments were performed before and after photocharging. Fig. 5 shows three consecutive dark JV scans taken immediately after the photo-induced equilibrium of EF was reached. An oxidation peak can be observed at potentials of about 0.85 VRHE. As such a peak is not present in dark JV curves taken for untreated BiVO4, we conclude that upon exposure to illumination in OC conditions, the electrochemical behaviour of our BiVO4 photoanodes are altered, i.e. they attain some additional negative charge. Once the photoanodes are swept anodically with potential greater than 0.85 VRHE, the electrons are removed, which results in the presence of an oxidation peak in the JV scan. This peak appears to be the largest after the first cycle, and becomes successively smaller after each cycle until after >3 cycles the peak is gone, suggesting that within the range of potentials applied (0.2–2.1 VRHE) and within the timescale of a CV scan, this effect is irreversible without the addition of light. The position of the observed oxidation peak (0.85 VRHE) is consistent with the recorded VWE dark H2O (0.85 VRHE), which directly corresponds to the energy level of the proposed SuS.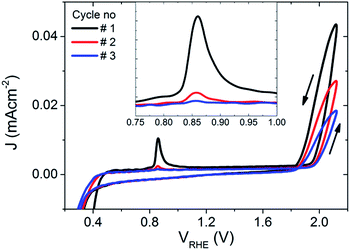 | ||
| Fig. 5 The first three dark JV scans of the BiVO4 photoanode after 10 hours of photocharging, inset: a zoomed in plot around the observed oxidation peak at ∼0.85 VRHE. | ||
Additionally, current densities up to 0.043 mA cm−2 at 2.1 VRHE in the dark can be observed for photocharged BiVO4, suggesting some dark electrocatalytic activity (Fig. 5). Untreated BiVO4 is a very poor electrocatalyst, with virtually no current at 2.1 VRHE in the dark (ESI, Fig. S5†). Even with a thin layer of OEC such as Ni–Bi only 0.011 mA cm−2 can be observed at 2.1 VRHE (ESI, Fig. S5†). It further confirms that photocharging can successfully modify the surface of BiVO4 photoanodes leading to enhanced catalytic activity.
However, it is also possible that the photocharging of BiVO4 photoanodes is a non-surface related phenomenon. For untreated BiVO4 photoanodes, the first voltammetric cycle under illumination always yields the highest photocurrent density, and subsequent cycles show a gradually decreasing performance (Fig. 6(a) inset). Usually from the 5th cycle onwards, the obtained CVs start to overlap as shown in Fig. 6(a), where the blue curve is obtained for all CVs recorded after 5 cycles. Interestingly, this decrease in photocurrent over cycling for untreated BiVO4 is accompanied with a change in the redox waves intensities and positions at low potentials. Initially a small oxidation wave at ∼0.65 VRHE and a reduction wave at ∼0.55 VRHE can be observed. Both waves disappear over cycling and a reduction wave at ∼0.75 VRHE arises instead. Conversely, the photocharging technique leads to the diminishing of this reduction wave at ∼0.75 VRHE, as shown in Fig. 6(b). The observed redox waves have previously been shown to correspond to the reduction and re-oxidation of vanadium V4+/V5+, which may be a bulk process.32 The fact that photocurrent density is related to the intensity of the redox waves, and hence to the concentration of V4+ and V5+ species, suggests that photocharging leads to alteration of the V4+ to V5+ ratio.
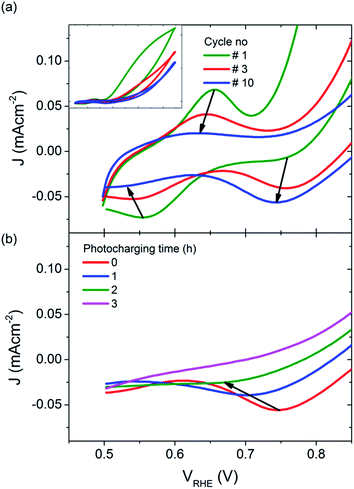 | ||
| Fig. 6 JV scans under illumination, for (a) untreated BiVO4, inset: full potential range, and (b) BiVO4 photocharged for different periods of time (cathodic sweeps only). | ||
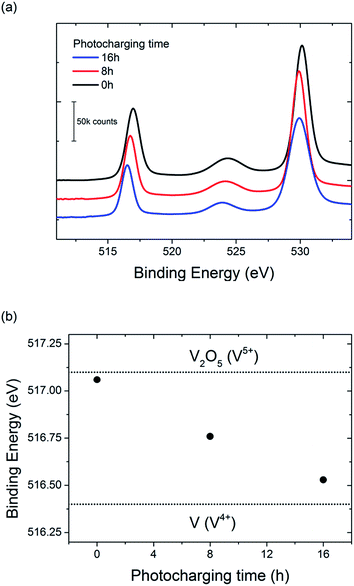
To further investigate the possible change in vanadium oxidation state, XPS measurements were performed on the BiVO4 photoanodes before and after photocharging. Prior to the XPS experiment two samples were photocharged in K–Pi buffer pH 7.2; one for 8 h, and another one for 16 h. One other sample, an untreated one, was tested as a reference. Measurements were focused in the energy range expected for vanadium, and the results are presented in Fig. 7.
A clear shift of the V2p peak towards lower binding energies can be observed for photocharged samples (Fig. 7a). The position of V2p peak as a function of photocharging time is plotted in Fig. 7b. It shows quantitatively that the negative shift of the binding energy for V2p3/2 orbital scales up linearly with photocharging time. Moreover, it has been previously reported33 that the binding energy of vanadium in the 5+ oxidation state is found at 517.1 eV, and is correlated to the V2O5 species, while the binding energy of vanadium in the 4+ oxidation state is 516.4 eV. Comparison of our data with these V2p3/2 references for different oxidation states (dotted lines on Fig. 7b) suggests that photocharging treatment results in gradual reduction of V in our BiVO4 films, i.e. the untreated samples are rich in V in 5+ state, while photocharging results in higher and higher fraction of V4+.
It is important to note that the XPS technique only gives quantitative information about the oxidation state of the surface of the sample, and therefore we cannot conclude that the oxidation state of vanadium changes in the bulk. Ion beam etching was attempted to probe the oxidation state of vanadium at a depth several nanometers below the surface for our samples, but due to the complex morphology and composition of our films, reliable data was not obtainable. Therefore we can conclude that at least the surface vanadium species reduce during the photocharging process, but further investigations are required to determine if the bulk vanadium also reduces.
Material properties of photocharged BiVO4
To probe whether the photocharging treatment leads to any changes in the microstructural, structural and/or chemical properties of our BiVO4 films, a detailed material characterization was performed before and after photocharging. Specifically, the aim was to clarify if the photocharging treatment leads to any corrosion process of BiVO4, enhancement/change in the surface area, or any other surface altering phenomena. The faradaic efficiency is also included to test if the enhancement in photocurrent generation is related to water oxidation and not any other reaction.We investigated the surface morphology before and after photocharging by taking AFM scans of 200 nm thick BiVO4 samples, as shown in ESI Fig. S6 and S7† respectively. From these images, there are no clearly noticeable changes in the surface morphology before and after the treatment. Our AFM investigation suggests that the photocharging treatment does not alter the microstructure of our films, and therefore the observed enhancement in photocurrent appears not to be related to an increased surface roughness or etching induced nano-structuring. Our SEM study further confirms these conclusions. The surface morphology of BiVO4 samples before and after photocharging was investigated by SEM, as shown in ESI Fig. S8 and S9† respectively. Similar to the AFM observations, any qualitative difference in the surface morphology before and after the treatment is not clearly visible.
The crystal structure of BiVO4 before and after photocharging was also investigated by collecting XRD scans (ESI, Fig. S10†). Our spray deposited films show a structure typical for monoclinic scheelite-type BiVO4. Our diffractograms demonstrate that there is no clear difference in the crystal structure between the untreated and photocharged films. This implies that no additional lattice stress or strain inducing defects are responsible for the enhanced performance of the photocharged BiVO4 films.
The chronoamperometric (J–t) tests of photocharged BiVO4 thin films were performed for three different potentials over the course of an hour for each potential step. We choose moderately anodic potentials to avoid any stability issues related to BiVO4 itself, which are more likely to occur at highly oxidative potentials. We also choose these potentials for the sake of applicability of the photocharging treatment. Potentials in the 0.6–1.0 V range are close to the intersection points for a BiVO4/a-Si PV cell tandem device,15 therefore they represent practical operating potentials for a potential bias free solar water splitting device.
The results of the photocurrent stability measurements are presented in ESI Fig. S11.† The photocurrent within the time-frame of our experiment seems to be stable, i.e. for all 3 potentials tested, the J–t curves look fairly flat as a function of time. Larger fluctuations in the photocurrent density at 1.0 VRHE are related to bubble formation. Our results suggest that the enhancement in current due to the photocharging treatment can be sustained for at least several hours. Any decrease in photocurrent of the photocharged BiVO4 held at fixed potential is therefore likely to originate from the instability of the material itself, and not as a result of the photocharging treatment.
To show that the observed enhancement in photocurrent is indeed related to O2 evolution, a gas chromatography (GC) measurement was performed. Given the time resolution of our GC apparatus (18 min) and any potential intrinsic stability issues related to the BiVO4 itself, we performed the GC measurements under a fixed current density (0.65 mA cm−2) rather than at a fixed potential. The outcome of the GC investigation is presented in Fig. 8. All the experimental data points are in the close proximity of the oxygen evolution trend calculated based on the applied current and the GC calibration data. Our results suggest that the faradaic efficiency of the water oxidation process on photocharged BiVO4 photoanodes is close to unity, meaning the enhancement in photocurrent is not related to any other electron pathway or side reaction.
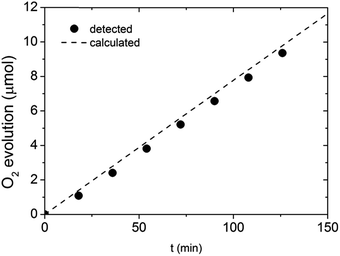 | ||
| Fig. 8 Gas chromatography detection of O2 evolved at photocharged BiVO4 electrode at constant current of 0.65 mA cm−2. | ||
Conclusions
In summary, we showed that prolonged exposure of BiVO4 photoanodes to AM 1.5 illumination in the OC configuration, a technique that we call ‘photocharging’, greatly improves its PEC properties. We found that such light-induced treatment results in a major suppression of surface recombination, and thus a record photocurrent for bare, undoped, uncatalysed BiVO4 photoanodes was achieved. Furthermore, we showed that photocharging induces a significant cathodic shift in the photocurrent onset potential, and an increased photovoltage.According to our results, the photocharging treatment improves both bulk and surface properties of BiVO4. Therefore we hypothesize about the mechanisms related to these two effects. Surface related enhancement could possibly be explained by the fact that photocharging leads to a photo-induced passivation of the surface states at the solid–liquid interface. Such passivation would result in a diminished Fermi level pinning effect and consequently in an increase of the photovoltage. Bulk related effect of photocharging could possibly be explained by reduction of V5+ to V4+ in the bulk of the film. Work is in progress to reveal what is the effect of photocharging on physio-chemical properties of BiVO4, and to further determine the exact mechanism of this process and how it leads to the increased photocatalytic activity.
Acknowledgements
We acknowledge the financial support of the Foundation for Fundamental Research on Matter (FOM TNW 10.327). This work has been done under the agenda of the BioSolarCells Consortium. Helpful discussions with Sixto Gimenez, Moreno de Respinis and Bernard Dam are greatly acknowledged.Notes and references
- M. G. Walter, E. L. Warren, J. R. McKone, S. W. Boettcher, Q. Mi, E. A. Santori and N. S. Lewis, Chem. Rev., 2010, 110, 6446–6473 CrossRef CAS PubMed.
- M. Grätzel, Nature, 2001, 414, 338–344 CrossRef PubMed.
- D. G. Nocera, Acc. Chem. Res., 2012, 45, 767–776 CrossRef CAS PubMed.
- S. Tokunaga, H. Kato and A. Kudo, Chem. Mater., 2001, 13, 4624–4628 CrossRef CAS.
- F. F. Abdi and R. van de Krol, J. Phys. Chem. C, 2012, 116, 9398–9404 CAS.
- T. W. Kim and K. Choi, Science, 2014, 343, 990–994 CrossRef CAS PubMed.
- T. H. Jeon, W. Choi and H. Park, Phys. Chem. Chem. Phys., 2011, 13, 21392–21401 RSC.
- D. K. Zhong, S. Choi and D. R. Gamelin, J. Am. Chem. Soc., 2011, 133, 18370–18377 CrossRef CAS PubMed.
- C. Ding, J. Shi, D. Wang, Z. Wang, N. Wang, G. Liu, F. Xiong and C. Li, Phys. Chem. Chem. Phys., 2013, 15, 4589–4595 RSC.
- S. K. Choi, W. Choi and H. Park, Phys. Chem. Chem. Phys., 2013, 15, 6499–6507 RSC.
- L. Trotochaud, T. J. Mills and S. W. Boettcher, J. Phys. Chem. Lett., 2013, 4, 931–935 CrossRef CAS PubMed.
- F. F. Abdi, N. Firet and R. van de Krol, ChemCatChem, 2013, 5, 490–496 CrossRef CAS PubMed.
- K. P. S. Parmar, H. J. Kang, A. Bist, P. Dua, J. S. Jang and J. S. Lee, ChemSusChem, 2012, 5, 1926–1934 CrossRef CAS PubMed.
- W. Luo, Z. Yang, Z. Li, J. Zhang, J. Liu, Z. Zhao, Z. Wang, S. Yan, T. Yu and Z. Zou, Energy Environ. Sci., 2011, 4, 4046–4051 CAS.
- F. F. Abdi, L. Han, A. H. M. Smets, M. Zeman, B. Dam and R. van de Krol, Nat. Commun., 2013, 4, 2195 Search PubMed.
- Y. Liang, T. Tsubota, L. P. A. Mooij and R. van de Krol, J. Phys. Chem. C, 2011, 115, 17594–17598 CAS.
- J. Reichman, Appl. Phys. Lett., 1980, 36, 574–577 CrossRef CAS PubMed.
- H. Dotan, K. Sivula, M. Grätzel, A. Rothschild and S. C. Warren, Energy Environ. Sci., 2011, 4, 958–964 CAS.
- B. Klahr and T. Hamann, J. Phys. Chem. C, 2014, 118, 10393–10399 CAS.
- C. Du, M. Zhang, J. Jang, Y. Liu, G. Liu and D. Wang, J. Phys. Chem. C, 2014, 118, 17054–17059 CAS.
- C. Du, X. Yang, M. T. Mayer, H. Hoyt, J. Xie, G. McMahon, G. Bischoping and D. Wang, Angew. Chem., Int. Ed. Engl., 2013, 52, 12692–12695 CrossRef CAS PubMed.
- O. Zandi and T. W. Hamann, J. Phys. Chem. Lett., 2014, 5, 1522–1526 CrossRef CAS PubMed.
- D. Eisenberg, H. S. Ahn and A. J. Bard, J. Am. Chem. Soc., 2014, 136, 14011–14014 CrossRef CAS PubMed.
- M. T. McDowell, M. F. Lichterman, J. M. Spurgeon, S. Hu, I. D. Sharp, B. S. Brunschwig and N. S. Lewis, J. Phys. Chem. C, 2014, 118, 19618–19624 CAS.
- X. Yang, R. Liu, C. Du, P. Dai, Z. Zheng and D. Wang, ACS Appl. Mater. Interfaces, 2014, 6, 12005–12011 CAS.
- H. Gerischer, Electrochim. Acta, 1990, 35, 1677–1699 CrossRef CAS.
- M. G. Walter, E. L. Warren, J. R. McKone, S. W. Boettcher, Q. Mi, E. A. Santori and N. S. Lewis, Chem. Rev., 2010, 110, 6446–6473 CrossRef CAS PubMed.
- Photoelectrochemical Hydrogen Production, ed. R. van de Krol and M. Grätzel, Springer US, Boston, MA, 2012, vol. 102 Search PubMed.
- A. J. Bard, A. B. Bocarsly, F. R. F. Fan, E. G. Walton and M. S. Wrighton, J. Am. Chem. Soc., 1980, 102, 3671–3677 CrossRef CAS.
- S. R. Morrison, Electrochemistry at Semiconductor and Oxidized Metal Electrodes, Springer, 1980 Search PubMed.
- I. V. Pleskov, Solar Energy Conversion: A Photoelectrochemical Approach, Springer, 1990 Search PubMed.
- D.-D. Qin, T. Wang, Y.-M. Song and C.-L. Tao, Dalton Trans., 2014, 7691–7694 RSC.
- M. C. Biesinger, L. W. M. Lau, A. R. Gerson and R. S. C. Smart, Appl. Surf. Sci., 2010, 257, 887–898 CrossRef CAS PubMed.
Footnote |
| † Electronic supplementary information (ESI) available. See DOI: 10.1039/c5ta04716a |
| This journal is © The Royal Society of Chemistry 2016 |

