 Open Access Article
Creative Commons Attribution 3.0 Unported Licence
High temperature low vacuum synthesis of a freestanding three-dimensional graphene nano-ribbon foam electrode†
Dale A. C.
Brownson
a,
Luiz C. S.
Figueiredo-Filho
 bc,
Bill L.
Riehl
d,
Bonnie D.
Riehl
d,
Maria
Gómez-Mingot
e,
Jesús
Iniesta
e,
Orlando
Fatibello-Filho
b and
Craig E.
Banks
*a
aFaculty of Science and Engineering, School of Science and the Environment, Division of Chemistry and Environmental Science, Manchester Metropolitan University, Chester Street, Manchester, M1 5GD, UK. E-mail: c.banks@mmu.ac.uk; Web: http://www.craigbanksresearch.com Fax: +44 (0)1612476831; Tel: +44 (0)1612471196
bDepartamento de Química, Universidade Federal de São Carlos, São Carlos, SP, Brazil, P.O. Box 676, 13560-970
cCampus Paranavaí, Institudo Federal do Paraná, 87703-536, Paranavaí, PR, Brazil
dSCNTE LTD., P.O. Box 38, Alpha, OH 45301, USA
ePhysical Chemistry Department and Institute of Electrochemistry, University of Alicante, 03690, San Vicente del Raspeig, Alicante, Spain
First published on 29th January 2016
Abstract
The fabrication of a freestanding three-dimensional (3D) graphene nano-ribbon open cell foam electrode is reported based upon a facile high temperature (1700 °C) low vacuum (50 Torr) process. The graphene nano-ribbon (GNR) foam comprises on average 4 graphene layers and has an O/C ratio of 0.14; a quasi-graphene structure. This unique material is demonstrated to be electrochemically useful, with the electrochemical properties and resultant electroanalytical performance of the novel freestanding 3D GNR foam electrode reported for the first time. Electrochemical characterisation is performed via cyclic voltammetry in aqueous solutions using a range of electro-active redox probes and biologically relevant analytes, namely potassium ferrocyanide(II), hexaammineruthenium(III) chloride, uric acid (UA), acetaminophen (AP) and dopamine hydrochloride (DA). Analytical performance is evaluated and benchmarked through comparisons of the 3D GNR foam to other carbon based 3D foam electrodes, namely pristine graphene and reticulated vitreous carbon (RVC) alternatives. We show that the 3D GNR foam electrode possesses favourable heterogeneous electron transfer (HET) properties when compared to the alternative carbon based 3D foams, likely due to improved coverage of reactive edge plane like-sites/defects on its structure. In terms of the electroanalytical response of the 3D GNR foam electrode, it is found to give rise to an improved linear range and limit of detection towards some analytes; however, in certain cases the alternative carbon based 3D foams out-performed the GNR foam. These findings question the need of ‘only’ fast HET properties and suggest a compromise is required (for improved sensing capabilities to be realised) between HET speeds, the presence/absence of oxygenated species and the accessibility of the electrode's active surface area. This work offers insight to those working in the field of electrochemistry, particularly electroanalysis and those searching for new carbon based 3D foam electrode materials.
Introduction
Graphene and carbon nanotubes (CNTs, molecular-scale tubes of graphitic carbon) have become the focus of intense research in the last decade, particularly in the field of electrochemistry, such as in the development and evaluation of sensors and biosensors for various applications in electroanalysis.1–5 This interest is predominantly due to the outstanding physical and chemical properties that such micro-fabricated carbon nanostructures are reported to possess, such as a high surface area, high mechanical strength, catalytic electron transfer properties, and excellent electrical and thermal conductivities.6,7 Indeed, a plethora of improved electrochemical sensing devices have been reported when utilising CNT based electrodes or quantum dots, for example in fields of clinical, industrial and environmental analysis.7–11 The implementation of such micro-fabricated carbon nanostructures (CNTs and graphene) in the development and fabrication of novel sensing devices has clear potential to revolutionise this field.When utilising CNTs and/or graphene in electrochemical applications there are two main approaches: (i) immobilisation of the chosen nanomaterial onto an electrode surface; and (ii) growth of CNT arrays (or graphene) directly onto a substrate and using this as the electrode itself.7 Case (i) is the most common approach and generally involves dispersing the chosen material into a non-aqueous media followed by agitation from an ultrasonic bath to disperse the nanomaterial suspension.7 An aliquot is then extracted and placed onto the desired working (support) electrode where the solvent evaporates, leaving the nanomaterials immobilised.7 The response of the CNTs/graphene is usually then reported (as superior) in comparison to that of the support material, usually glassy carbon.7 In recent years several support materials have been efficiently utilised to deposit CNTs, such as alumina,12 carbon13 and titanium,9 amplifying their use in many electrochemical systems. However, modifying such surfaces has potential to leave underlying ‘reactive’ surfaces exposed, which can influence and (in specific cases) dominate the observed electrochemistry.7,14,15 Furthermore, modifying the electrode surface in such a way causes uncertainty in the response due to the uncontrolled manner in which modified films are formed and the possible instability of such modified layers;16 meaning that de-convolution of the ‘true’ electrochemical response/properties of the CNTs/graphene utilised is often difficult, giving rise to erroneous data.15,17
With the aforementioned insights in mind, it is evident that in order to appropriately connect to (and electrically ‘wire’) a given nanomaterial, the fabrication of a 3D structure is a suitable option, as per case (ii) mentioned above. The use of carbonaceous three-dimensional (3D) electrodes (such as pristine graphene and reticulated glassy carbon) have been reported previously towards the development of various electroanalytical sensors with beneficial outcomes.18,19 In the search for improved sensor devices and given the reported high level of edge plane sites,18–21 it is worthwhile looking into CNT alternatives, however, a similar material (particularly in terms of edge plane coverage) with less fabrication issues is the graphene nano-ribbon.7,15,22,23
The initial concept for a nano-material carbon-based 3D foam was reported by Chen and co-workers in 2011 with the development of a new class of 3D graphene-based materials.24 The concept and methodology for the synthesis of a 3D CNT foam macrostructure came later and was developed by Pham-Huu et al.25 whom fabricated a 3D CNT foam with relatively high mechanical strength and a high surface area 350 m2 cm−1, which was subsequently used for the adsorption of environmental compounds. Initial research utilising micro-fabricated-carbon based 3D foams focused on their electrochemical energy storage capacities, with Dong et al.26,27 utilising a 3D graphene foam structure as a support for cobalt oxide and separately for zinc oxide super-capacitors with beneficial results. Utilisation of these hybrid structures for electrochemical sensing applications was also reported by the authors; using the zinc oxide modified 3D graphene foam towards the detection of [Fe(CN)6]3+ and dopamine,27 whilst the cobalt oxide modification was shown to be useful for sensing glucose.26 Furthermore, the unmodified/bare 3D graphene foam was reported to be useful for dopamine sensing.28 Interestingly, one of the only electrochemical cases exploring the use of a 3D CNT based electrode is that reporting the synthesis of a graphene–CNT hybrid foam for use in electrochemical sensing.28 The authors found the 3D graphene–CNT electrodes to exhibit a high sensitivity (ca. 470.7 mA M−1 cm−2) and low detection limit (ca. 20 nM) for dopamine detection.28 However, in each of the above literature reports, no comparisons were made with a similar structure, that is, another form of 3D carbon foam (or in the latter case, to that of an independent CNT foam). Furthermore, the freestanding 3D foams utilised were attached to glass sides (or equivalent) for ease of experimentation – where effectively the unique freestanding 3D structure is turned, detrimentally, into a quasi-2D graphene (or CNT) structure! Recently, to overcome these issues a freestanding 3D pristine graphene foam was electrochemically explored in both aqueous and non-aqueous solutions and the responses were compared to a freestanding 3D reticulated vitreous carbon (RVC) foam alternative.29 In aqueous solutions, the 3D graphene foam exhibited poor voltammetric responses when compared to the RVC alternative (due to the presence of quasi-super-hydrophobic behaviour on the former). Consequently, the authors' found the freestanding 3D graphene foam to give rise to significantly improved voltammetric signatures in non-aqueous media (ionic liquids) when compared to that of a freestanding 3D RVC alternative.29 Such work was extended and the electrochemical performance of a pre-treated (to reduce the hydrophobic behaviour) 3D graphene foam was explored towards the detection of uric acid (UA), acetaminophen (AP) and dopamine hydrochloride (DA), with results indicating that the 3D RVC alternative exhibited improved electroanalytical characteristics.30 This initial work highlights the importance of performing appropriate control experiments. It is these key comparisons that are explored in this paper towards a new 3D carbon foam alternative, utilising a graphene nano-ribbon (GNR) structure (similar to that of CNTs).
In this paper, we report a mild method to synthesis a freestanding 3D graphene nano-ribbon open cell foam electrode based upon a facile high temperature (1700 °C) low vacuum (50 Torr) process. The electrochemical performance of the material is explored with control experiments using pristine graphene and RVC based 3D foam alternative electrodes. We offer insights into the origins of the electrochemical properties observed.
Experimental details
All chemicals were of analytical grade (or higher) and were used as received from Sigma-Aldrich without any further purification. All solutions were prepared with deionised water of resistivity not less than 18.2 MΩ cm and were vigorously degassed prior to electrochemical measurements with high purity, oxygen free nitrogen.Voltammetric measurements were performed using an ‘Autolab PGSTAT 101’ (Metrohm Autolab, The Netherlands) potentiostat. All measurements were conducted using a three electrode system. A platinum wire and a saturated calomel electrode (SCE) (Radiometer, Copenhagen, Denmark) were used as counter and reference electrodes respectively, with variable working electrodes employed; which were either a freestanding 3D GNR foam, a freestanding 3D pristine graphene foam, or a freestanding 3D reticulated vitreous carbon (RVC) foam alternative (see below and ref. 29 and 30 for further details and for full characterisation of both the pristine graphene and RVC working electrode materials). Where voltammetric scan rate studies are employed within the main text, the following increments were utilised within the specific ranges stated: 5, 10, 25, 50, 75, 100, 150, 200, 300, 400 and 500 mV s−1.
Scanning electron microscope (SEM) images and surface element analysis were obtained with a JEOL JSM-840 model equipped with an X-ray detector for the EDX microanalysis. Transmission electron microscope (TEM) images were obtained using a JEOL JEM-2010 (Oxford, Inca Energy TEM 100). Raman spectra were recorded using LabRam (Jobin-Ivon), with a confocal microscope (×100 objective) spectrometer with a He–Ne laser at 632 nm excitation at a very low laser power level (0.9 mW) to avoid any heating effect. X-ray photoelectron spectroscopy (XPS, K-Alpha, Thermo Scientific) was also used. All spectra were collected using Al–K radiation (1486.6 eV), monochromatized by a twin crystal monochromator, yielding a focused X-ray spot with a diameter of 400 μm, at 3 mA × 12 kV. The alpha hemispherical analyser was operated in the constant energy mode with survey scan pass energies of 200 eV to measure the whole energy band and 50 eV in a narrow scan to selectively measure the particular elements. Thus, XPS was used to provide the chemical bonding state as well as the elemental composition. Charge compensation was achieved with the system flood gun that provides low energy electrons and low energy argon ions from a single source.
The freestanding 3D graphene nano-ribbon (GNR) open cell foam electrode was fabricated from Duocell silicon carbide foam of 100 pores per inch, which was obtained from ERG Aerospace (Oakland, CA) and sliced using a wet diamond saw to a thickness of 2 mm, a width of 10 mm, and a length of 25 mm. The silicon carbide foam is comprised of a RVC core, on which crystalline beta-SiC is vapour deposited. Pieces were then washed in isopropyl alcohol, prior to being rinsed with deionised water. After cleaning, oxides were etched from the surface using 5 min 25% HF, then rinsed thoroughly with deionised water again. Pieces were then dried using isopropyl alcohol, and immediately placed in a custom fabricated vacuum graphite resistance furnace for conversion. Upon reaching 10 Torr, the furnace was steadily ramped to 1700 °C. The pieces were annealed at 50 Torr for 8 hours, before the furnace was allowed to cool to 100 °C under vacuum. Pieces were then removed and stored in a glass vile to be assembled into electrodes.
The freestanding 3D graphene foam electrode was fabricated as reported and described previously,29,30 which involves using a nickel skeleton (that will define the resulting 3D graphene macrostructure, i.e. pore size etc.). Carbon atoms are introduced via decomposition of methane (ca. 1% volume) at ca. 1000 °C under ambient pressure where graphene films become precipitated upon the nickel surface (a chemical vapour deposition (CVD) process). The underlying nickel skeleton/scaffold is then coated with poly(methyl methacrylate) (PMMA) to reduce the likelihood of the structure collapsing whilst the nickel is etched in 3 M HCl at 80 °C for 12 hours. The PMMA is then removed via washing the sample with hot acetone; note that if the PMMA is not used the resulting structure is significantly deformed. To confirm that both the PMMA and nickel are removed, energy-dispersive X-ray (EDX) spectroscopy and X-ray photoelectron spectroscopy (XPS) are conducted. Note that due to the etching, that is, a continuous film of graphene completely encapsulating the nickel surface, some of the macrostructure needs to be broken to allow the etching solution to penetrate, however, this process appears not to be substantially extrusive as to dramatically change the resulting freestanding 3D graphene macrostructure (see ref. 29). Following fabrication the 3D graphene foam was carefully cut/shaped (average dimensions: 0.80 cm × 1.00 cm × 0.12 cm) appropriately for use as an electrode material after which a 60 second pre-treatment step was utilised, involving washing with acetone, in order to improve the wettability of the 3D graphene foam (as shown in the literature),30 after this process it receives a new nomenclature 3D pre-treated graphene foam (3D PTGR).
Full physical characterisation of the 3D graphene foam has been reported previously.29,30 XPS analysis of the 3D graphene foam after pre-treatment (acetone washing) revealed a composition of 87% carbon (70% at 284.6/285.6 eV, characteristic of graphitic groups, and 17% at ca. 288 eV which corresponds to C–O and C![[double bond, length as m-dash]](https://www.rsc.org/images/entities/char_e001.gif) O bonds respectively) and 13% oxygen (8% at 532.4 eV corresponding to C–OH bonds and 5% at 533.9 eV which corresponds to groups such as C
O bonds respectively) and 13% oxygen (8% at 532.4 eV corresponding to C–OH bonds and 5% at 533.9 eV which corresponds to groups such as C![[double bond, length as m-dash]](https://www.rsc.org/images/entities/char_e001.gif) O and C–O). Raman analysis shows two characteristic peaks: a single peak at ca. 1581 cm−1 (G band) and another peak at ca. 2684 cm−1 (2D (G′) band), which does not exhibit a D band (ca. 1330 cm−1).31 The absence of a D band in the Raman spectra and the presence of the characteristic peaks expected indicate the presence of quasi-graphene that is of high quality and is defect free (no basal crystal defects).16,29,30,32
O and C–O). Raman analysis shows two characteristic peaks: a single peak at ca. 1581 cm−1 (G band) and another peak at ca. 2684 cm−1 (2D (G′) band), which does not exhibit a D band (ca. 1330 cm−1).31 The absence of a D band in the Raman spectra and the presence of the characteristic peaks expected indicate the presence of quasi-graphene that is of high quality and is defect free (no basal crystal defects).16,29,30,32
For further comparison of the 3D GNR foam, a freestanding 3D RVC – a micro-porous, glassy carbon material – was employed (The Electrosynthesis Company Inc., Lancaster, NY, USA) which has been characterised and extensively utilised in electrochemistry (essentially a glassy carbon foam electrode),30 particularly in industrial scale-up. Other than preparation for use as an electrode (average dimensions: 1.0 cm × 1.0 cm × 0.5 cm) this foam was utilised as received from the supplier without any further modification. Full physical characterisation of the 3D RVC foam has been previously reported.29,30 However, Raman spectroscopy analysis showed two characteristic bands: D (1321 cm−1) and G (1593 cm−1) and a wide G′ band at ca. 2800 cm−1, which as reported widely in the literature is consistent with a glassy carbon (RVC) structure.31 De-convolution of the XPS spectra for the RVC foam indicated a composition of 88.8% carbon (69.2% at 284.6/285.6 eV, characteristic of graphitic groups, and 15.6% at 286 eV, 4% at 289 eV and 17% at ca. 288 eV which corresponds to C![[double bond, length as m-dash]](https://www.rsc.org/images/entities/char_e001.gif) O and O
O and O![[double bond, length as m-dash]](https://www.rsc.org/images/entities/char_e001.gif) C–O groups respectively). The oxygen content of 9.6% comprised of 7.2% at 531.7 eV corresponding to C–OH bonds and 2.4% at 533.3 eV, which corresponds to groups such as C
C–O groups respectively). The oxygen content of 9.6% comprised of 7.2% at 531.7 eV corresponding to C–OH bonds and 2.4% at 533.3 eV, which corresponds to groups such as C![[double bond, length as m-dash]](https://www.rsc.org/images/entities/char_e001.gif) O, O
O, O![[double bond, length as m-dash]](https://www.rsc.org/images/entities/char_e001.gif) C–O or C–O bonds.
C–O or C–O bonds.
Current density is presented in all of the figures in this paper, that is, the 3D GNR, graphene and RVC foams are normalised (current density, A cm−3) in terms of their volume to allow direct comparison. Additionally, since the average pore size of the 3D GNR and 3D PTGR foams is found to correspond ca. 200 μm, and that of the 3D RVC foam is ca. 400 μm, a correction factor is applied by dividing the current density of the PTGR and GNR foams by a factor of two to allow direct comparison of the alternative RVC foam.33
Results and discussion
Physicochemical characterisation
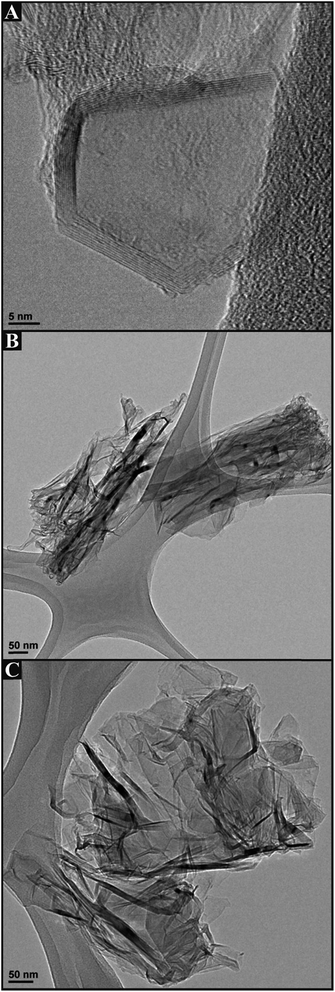
We first consider the structural characterisation of the freestanding 3D GNR foam macrostructure via SEM as depicted in Fig. 1, which reveals the 3D GNR foam to exhibit a well-defined 3D macro-porous structure with an average pore diameter of ca. 200 μm. Closer inspection reveals a smooth surface at the thin GNR skeleton, which appears to assume a similar surface topology and architecture to that of the 3D PTGR and RVC foam substrates previously reported in ref. 29 and 30. Analysis of the surface microstructure features evident in Fig. 1C reveals the surface to comprise a dense mesh of agglomerated GNRs, which are an inherent property of the interconnected 3D scaffold structure, a characteristic which aligns well with previous literature concerning the fabrication of a CNT based 3D foam electrode.28Fig. 2 depicts TEM images of the 3D GNR foam, where it is evident that the graphitic material consists of a mixture of single- and few-layer graphene sheets, which are of narrow/thin width and thus align structurally with the definition of ‘graphene nano-ribbons’.34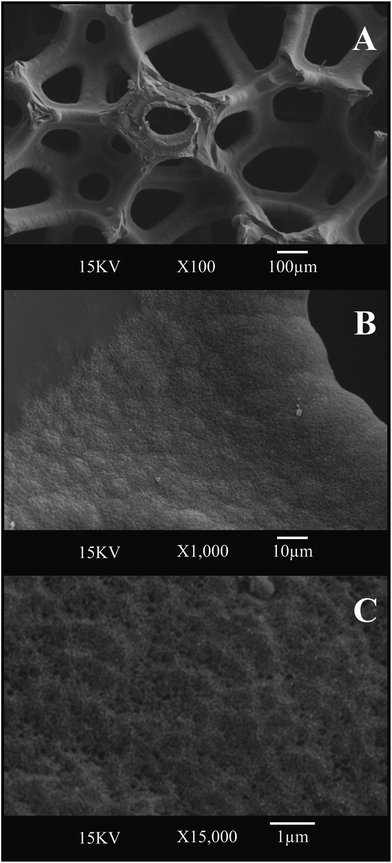 | ||
Fig. 1 SEM images of the freestanding 3D GNR foam at an increasingly higher magnification, (A) ×100, (B) ×1000 and (C) ×15![[thin space (1/6-em)]](https://www.rsc.org/images/entities/char_2009.gif) 000. 000. | ||
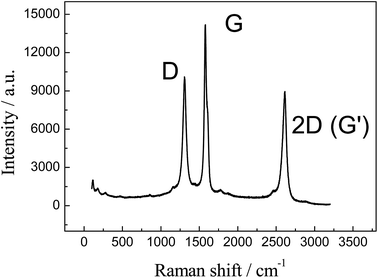
Further characterisation of the 3D GNR foam is presented in Fig. 3 where the Raman spectra reveals three characteristic peaks at ca. 1300, 1575 and 2600 cm−1, which are due to the D, G and 2D (G′) bands respectively.35,36 The position and relative intensities of the characteristic peaks represent the presence of few-layer graphene sheets (as expected), likely that of around 4 graphene layers thick.28,35 Raman spectroscopy is instrumental in characterising the structure and defects of graphitic forms of carbon, such as graphene and CNTs. The G band is an intrinsic feature attributed to the tangential stretch modes and it is present in all sp2 carbon materials,35 in this case it is related to finite size effects and the presence of vacancies, impurities or other defects in the graphitic structure which breaks the symmetry of the graphene.35,37As such, the D to G band intensity ratio can be used to estimate the crystalline quality of graphene, where this ratio is the usual measurement for graphitic ordering (lower D to G band ratios indicate that the graphene possesses a high degree of order, within the range 0.15–0.5).35,38 In our case the ratio was found to be 0.71, which shows a medium quantity of edge plane like-structural defects on the graphene structure. However, given insights from the TEM images above, the Raman spectra likely indicates the presence of graphene nano-ribbons, where the high intensity D band is present due to the thin width of the graphene sheet and consequential large edge plane contribution to its structure.34,39
Last, XPS analysis was performed on the 3D GNR foam (see Fig. S1 of the ESI†), revealing a composition of 82.05% carbon (79.08% at 284.5 eV, which is characteristic of graphitic groups, and 2.97% at ca. 287 eV, which corresponds to C–O and C![[double bond, length as m-dash]](https://www.rsc.org/images/entities/char_e001.gif) O bonds respectively) and 11.85% oxygen (9.81% at 532.3 eV corresponding to C–OH bonds and 2.04% at 533.5 eV which corresponds to groups such as C
O bonds respectively) and 11.85% oxygen (9.81% at 532.3 eV corresponding to C–OH bonds and 2.04% at 533.5 eV which corresponds to groups such as C![[double bond, length as m-dash]](https://www.rsc.org/images/entities/char_e001.gif) O and C–O). The graphitic carbon contribution is as expected with respect to the GNR's structural configuration (as confirmed via SEM, TEM and Raman analysis, see Fig. 1–3), with a small number of oxygenated surface groups populating the surface (O/C ratio: 0.14). In addition to contributions from atomic carbon and oxygen, note that XPS analysis also revealed a small percentage of atomic sulphur (0.44%), chlorine (0.46%), fluorine (0.66%), nitrogen (1.34%) and silicon (3.2%), which likely arise via the fabrication and sample treatment processes in addition to background contributions and thus are not expected to influence the electrochemical performances herein.
O and C–O). The graphitic carbon contribution is as expected with respect to the GNR's structural configuration (as confirmed via SEM, TEM and Raman analysis, see Fig. 1–3), with a small number of oxygenated surface groups populating the surface (O/C ratio: 0.14). In addition to contributions from atomic carbon and oxygen, note that XPS analysis also revealed a small percentage of atomic sulphur (0.44%), chlorine (0.46%), fluorine (0.66%), nitrogen (1.34%) and silicon (3.2%), which likely arise via the fabrication and sample treatment processes in addition to background contributions and thus are not expected to influence the electrochemical performances herein.
Electrochemical characterisation
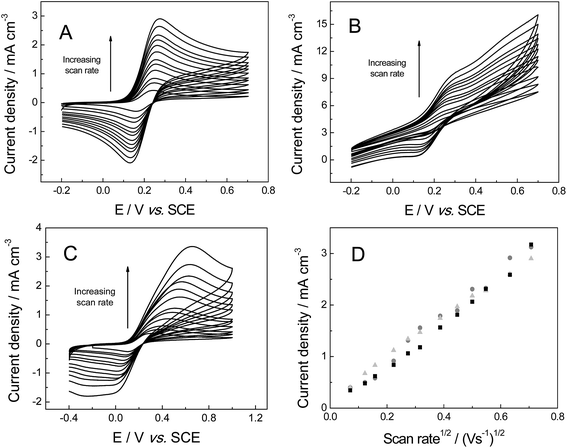
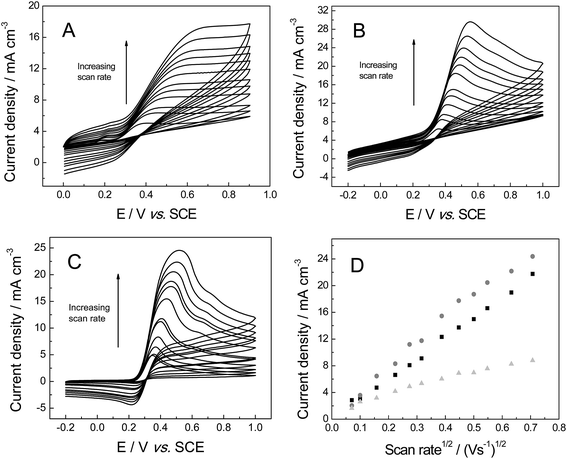
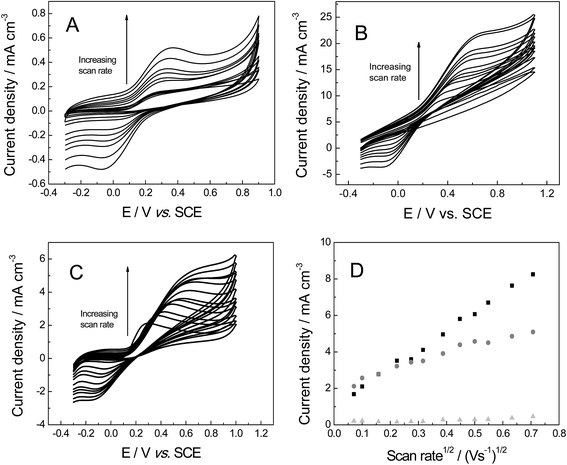
The electrochemical properties of the freestanding 3D graphene nano-ribbon (GNR) foam electrode are first evaluated using the inner-sphere electron transfer redox probe potassium ferrocyanide(II) in pH 7 phosphate buffer solution (PBS) with 0.1 M KCl electrolyte. Fig. 4 depicts typical cyclic voltammetric profiles obtained utilising the 3D GNR, 3D PTGR and RVC foam electrodes at varying scan rates. Analysis of the voltammetric profiles exhibited at a fixed scan rate of 100 mV s−1 demonstrates a well-defined pair of redox peaks, with a peak-to-peak separation (ΔEP) of ca. 83.0, 62.2 and 420.0 mV (vs. SCE) observed for the freestanding 3D GNR, 3D PTGR and RVC foams respectively. Given that smaller ΔEP values are indicative of more favourable electrochemical interactions at an electrode surface, it is initially apparent that both the 3D GNR and 3D PTGR graphene foams possess enhanced heterogeneous electron transfer (HET) kinetics relative to the RVC foam alternative.6,40The voltammetric peak height (IP) was monitored/analysed as a function scan rate (v), with a plot of IP(anodic)versus v0.5 revealing the following trends: 3D GNR foam, IP (A cm−3) = 3.82 × 10⁻³ (A cm−3)/(V s−1)0.5 + 2.30 × 10⁻⁴ (A cm−3) (R2 = 0.995); 3D PTGR, IP (A cm−3) = 4.47 × 10⁻³ A (V s−1)0.5 + 4.76 × 10⁻⁷ (A cm−3) (R2 = 0.991); and RVC foam, IP (A cm−3) = 4.36 × 10⁻³ (A cm−3)/(V s−1)0.5 + 8.95 × 10⁻⁵ (A cm−3) (R2 = 0.994). As is expected for the case of the semi-infinite diffusion model (as governed by the Randles–Ševćik equation), analysis log![[thin space (1/6-em)]](https://www.rsc.org/images/entities/char_2009.gif) IPversus log
IPversus log![[thin space (1/6-em)]](https://www.rsc.org/images/entities/char_2009.gif) v revealed the gradients of 0.43 (GNR), 0.49 (PTGR) and 0.50 (RVC), which in combination with the linear responses evident above indicate that a diffusional process is occurring and confirm the lack of thin-layer effects (the redox probe/analyte does not become trapped within the freestanding 3D foam network/structure of any electrode during measurements). Initial comparisons of the (A cm−3)/(V s−1)0.5 values obtained at each of the electrodes of interest indicate that the 3D GNR foam is likely to offer similar analytical signals (IP) when contrasted to the alternative 3D carbon foams. This is as expected given the general improvements observed in the electrochemical signatures at the 3D GNR foam (see Fig. 4); however, the electroanalytical performance of the foams will be studied in more detail later. Note the significant behavioural difference between the various freestanding 3D carbon foams. A resistive profile is observed in the case of the pristine graphene foam, which is likely a result of the pre-treatment step with acetone,30 which is required given the high hydrophobicity possessed by the untreated 3D graphene foam (precluding its use in aqueous solutions)29 and will likely detrimentally effect the pristine graphene foam's electroanalytical performance in aqueous solutions.
v revealed the gradients of 0.43 (GNR), 0.49 (PTGR) and 0.50 (RVC), which in combination with the linear responses evident above indicate that a diffusional process is occurring and confirm the lack of thin-layer effects (the redox probe/analyte does not become trapped within the freestanding 3D foam network/structure of any electrode during measurements). Initial comparisons of the (A cm−3)/(V s−1)0.5 values obtained at each of the electrodes of interest indicate that the 3D GNR foam is likely to offer similar analytical signals (IP) when contrasted to the alternative 3D carbon foams. This is as expected given the general improvements observed in the electrochemical signatures at the 3D GNR foam (see Fig. 4); however, the electroanalytical performance of the foams will be studied in more detail later. Note the significant behavioural difference between the various freestanding 3D carbon foams. A resistive profile is observed in the case of the pristine graphene foam, which is likely a result of the pre-treatment step with acetone,30 which is required given the high hydrophobicity possessed by the untreated 3D graphene foam (precluding its use in aqueous solutions)29 and will likely detrimentally effect the pristine graphene foam's electroanalytical performance in aqueous solutions.
Electron transfer at the ferro-/ferri-cyanide redox probe is known to be complex on carbon surfaces, influenced by specific surface sites, and is consequently termed as an ‘inner-sphere’ redox probe;6,29 thus the voltammetric responses observed in Fig. 4 can likely be attributed to both a combination of electronic factors and specific surface interactions arising from two differing contributions, which are not easily de-convoluted. In order to greater understand the responses observed above we thus turn to exploring the voltammetric characteristics of our freestanding 3D foam electrodes towards an ‘outer-sphere’ redox probe which does not have any surface sensitivity and depends exclusively on electronic factors.6,29
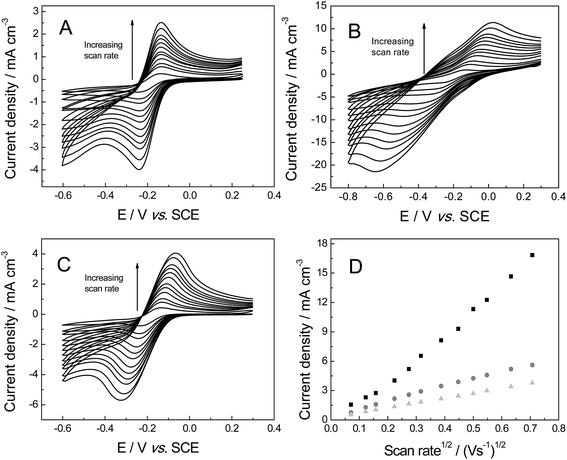
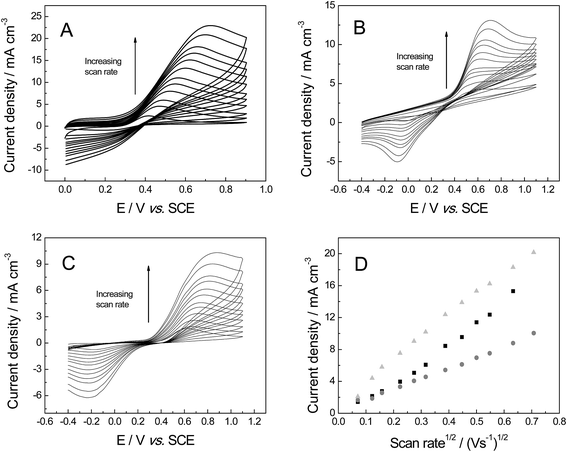
The voltammetric response of the freestanding 3D foam electrodes was next sought towards 1 mM hexaammineruthenium(III) chloride in pH 7 PBS (0.1 M KCl), which has been shown to exhibit reversible voltammetry (involving an ‘outer-sphere’ one electron transfer process) on carbon surfaces.41 The voltammetric response of each electrode is shown in Fig. 5, where reversible profiles are evident. Similar to when the ferro-/ferri-redox probe was utilised above, the ΔEP values recorded at 100 mV s−1 (vs. SCE) reveal a large variation at each of the electrode materials (values were ca. 94.2, 160.0 and 402.4 mV for the GNR, PTGR and RVC foams respectively). Given the outer-sphere nature of the redox probe utilised, this large dissimilarity indicates that the HET rates are distinct for each of the 3D foam electrodes, with the GNR foam (possessing the smallest ΔEP, as represented by the increased reversibility of the redox probe at this electrode material (see Fig. 5)) likely to possess the most favourable (fastest) HET properties/kinetics. Furthermore, a range of 3D GNR electrodes were fabricated (see Experimental section) and the stability of these electrodes explored in 1 mM hexaammineruthenium(III) chloride in pH 7 PBS (0.1 M KCl). The peak current was evaluated and found to have a % relative standard deviation (% RSD) of 3.2% (N = 5). In terms of long-term stability, we have tested the performance of our fabricated material as long as 9 months previous and found no degradation in the 3D GNR foam structure nor in its electrochemical response.
In order to determine the distinct electrochemical properties at each of the electrode materials of interest, the observed standard HET rate constant, ko, was next estimated. The Nicholson method, which applies to quasi-reversible systems as utilised herein, was implemented over the scan rate range of 5–500 mV s−1 using the following equation:42,43
| Ψ = ko[πDnυF/(RT)]−1/2 | (1) |
| Ψ = (−0.6288 + 0.0021X)/(1 − 0.017X) | (2) |
Analysis of the above ko values indicates that the 3D GNR foam possesses the most favourable electron transfer properties and has an electronic structure superior to the alternative foams. These results can be explained via the different levels of edge/basal plane at each of the foam electrodes.44,45 With the slow HET properties observed at the PTGR due to low edge plane content (as expected for the true structural geometry of pristine graphene)6,17,46 and the fast HET kinetics occurring at the RVC and GNR foams likely due to their improved geometric structures with elevated levels of electrochemically reactive edge plane like-sites/defects;6,17,46 thus showing improved HET rates. Recent research shows that the electrochemical performance of GNR based electrodes depends directly on the orientation (such as vertically aligned) and chemical functionalization of these nanostructures.47 It is important to note that the edge plane defect sites are responsible for the electron transfer activity observed in the GNR,48,49 the improved electrochemical response is due to the high density of sp2 edge planes at the tips of the nano ribbons and if oxygen functional groups are present. There is extensive literature on carbonaceous materials which reports that the edge plane defects are particularly more reactive than basal plane.6,48–52 Thus in terms of HET rates, the freestanding 3D GNR foam appears beneficial over that of the commonly utilised alternative RVC foam and additionally in comparison to the newly emerged graphene alternative for the aforementioned reasons.
In terms of the electroanalytical signal produced (IP, see Fig. 5D) the 3D GNR and 3D RVC foams appear to exhibit currents with similar magnitudes, with, the 3D PTGR foam possessing a further enhanced signal in this case. The lack of a greatly enhanced analytical-related performance at the 3D GNR foam (over that of the carbon alternatives) is unexpected given the improved HET kinetics observed at the macro-porous 3D electrode in both of the cases studied thus far. One would expect the analytical response of both (untreated and pre-treated) pristine graphene foams to be lower than the 3D RVC, however, the pre-treatment step has likely improved the wettability of the 3D GNR, which in turn gives rise to beneficial characteristics (previously inhibited by the super-hydrophobic surface). We explore this in greater detail (the electroanalytical response, and observed currents) below.
Electroanalytical applications
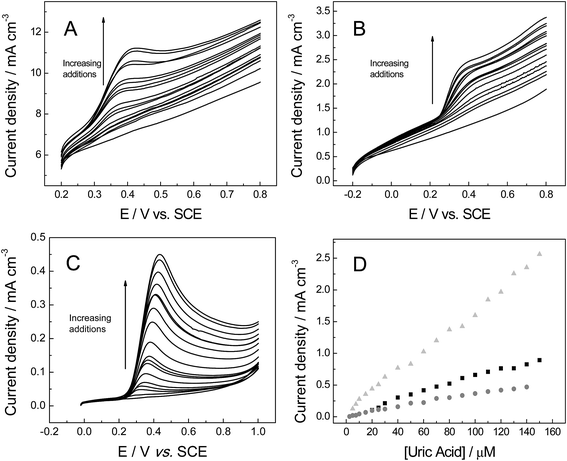
In order to ascertain the electroanalytical performance of the freestanding 3D graphene nano-ribbon (GNR) foam electrode, we next considered the electrochemistry of three important organic molecules.The kinetic parameters of uric acid (UA) were first explored in pH 7 PBS (0.1 M KCl). Fig. 6A–C show voltammetric profiles of UA at the various 3D foam electrodes in addition to a plot of peak current versus square-root of the voltammetric scan rate (Fig. 6D). At each of the three foams all the equations were linear: IP (A cm−3) = 1.09 × 10⁻² (A cm−3)/(V s−1)0.5 + 1.57 × 10⁻³ (A cm−3) (R2 = 0.989) for 3D GNR, IP (A cm−3) = 3.01 × 10⁻² (A cm−3)/(V s−1)0.5 + 1.08 × 10⁻⁴ (A cm−3) (R2 = 0.991) 3D PTGR and IP (A cm−3) = 3.53 × 10⁻² (A cm−3)/(V s−1)0.5 + 6.59 × 10⁻⁴ (A cm−3) (R2 = 0.993) for RVC foam electrodes. Analysis of the potentials at which the oxidation peaks occur reveals the values of ca. 497, 418 and 394 mV for 3D GNR, 3D PTGR and RVC electrodes respectively (at 100 mV s−1). This shows non-concordance between the ko values determined above for each proposed electrode. This likely arises due to UA being highly sensitive to surface oxygenated species, where improved voltammetry has been reported at electrochemically activated electrodes and at electrode surfaces with large O/C ratios.53
Attention was next turned to exploring the electroanalytical response arising from successive additions of UA into a pH 7 PBS (as shown in Fig. 7). Fig. 7D depicts the response of the peak height (IP) as a function of UA concentration at each of the electrode materials of interest. It is readily evident that linear responses are observed over the concentration range studied (2.5 to 150 μM). Contrasting the performance of the electrodes, the 3D GNR foam presents a linear concentration range of 5.0 to 150 μM IP (A cm−3) = 0.87 × 10⁻⁴ + 1.61 × 10+1 [UA] (M), (R2 = 0.995), while the 3D PTGR foam shows a distinct linear range from 20 to 150 μM IP (A cm−3) = 4.34 × 10⁻⁵ + 0.59 × 10+1 [UA] (M), (R2 = 0.982), and the linear equation for the electroanalytical response using 3D RVC foam was IP (A cm−3) = 1.38 × 10⁻⁵ + 3.39 [UA] (M), R2 = 0.988, from 2.5 to 120 μM.
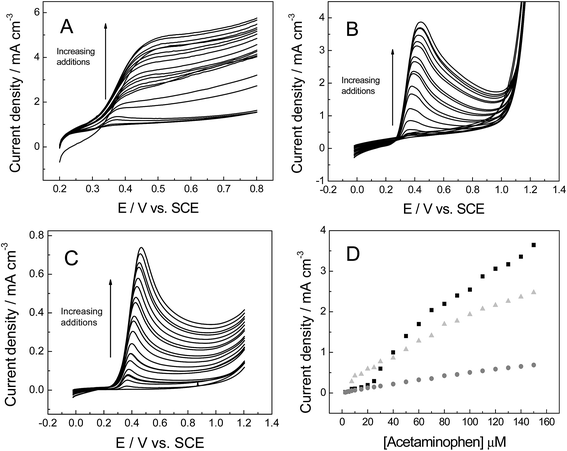
Following with the experiments using organic molecules, the response of acetaminophen (AP) is next considered, which is widely used in electroanalysis due to it being one of the most popular drugs sold in the world.54 1 mM AP (in pH 7 PBS, 0.1 M KCl) was applied in order to check the voltammetric behaviour towards the various 3D foam electrodes (Fig. 8A–C), including the evaluation of the kinetic parameters. The following equations were obtained when plotting anodic peak current versus square-root of the scan rate, as shown in Fig. 8D: IP (A cm−3) = 2.76 × 10⁻² (A cm−3)/(V s−1)0.5 + 1.16 × 10⁻³ (A cm−3) (R2 = 0.993) 3D GNR, IP (A cm−3) = 2.49 × 10⁻² (A cm−3)/(V s−1)0.5 −1.17 × 10⁻³ (A cm−3) (R2 = 0.987) 3D PTGR foam and IP (A cm−3) = 1.32 × 10⁻² (A cm−3)/(V s−1)0.5 + 4.17 × 10⁻⁴ (A cm−3) (R2 = 0.991) for the 3D RVC foam. Analysis of the oxidation peak for AP reveals the values of ca. 522, 577 and 703 mV for 3D GNR, 3D PTGR and 3D RVC electrodes respectively (at 100 mV s−1). These results correspond well the ko values determined previously and thus the HET properties exhibited by the electrodes. This is likely because AP is relatively insensitive to oxygenated species present on the electrode surface,55 similar to the hexaammineruthenium(III) chloride probe. However, the results are in non-concordance with the ko value estimated for 3D RVC foam, likely due to unfavourable surface interactions with the analyte in question.
The voltammetric peak height (IP) was monitored as a function of AP concentration (Fig. 9) and was found to be linear over the range: 2.5 to 150 μM for three different materials, for 3D GNR foam electrode was IP (A cm−3) = 2.81 × 10⁻⁴ + 15.61 [AP] (M), R2 = 0.987, the calibration plot for 3D PTGR show two distinct linear ranges from 2.5 to 25 μM IP (A cm−3) = −9.01 × 10⁻⁶ + 11.25 [AP] (M); R2 = 0.953 and 30 to 150 μM IP (A cm−3) = 1.69 × 10⁻⁴ + 23.75 [AP]; R2 = 0.977 and for RVC foam electrode was IP (A cm−3) = 3.01 × 10⁻⁵ + 4.60 [AP] (M); R2 = 0.995.
The last organic probe used was dopamine (DA), which is an important catecholamine neurotransmitter that plays a vital role in humans.56 Abnormal DA levels have been associated with neurological disorders (Parkinson's disease and schizophrenia).56 For DA the cyclic voltammograms show a diffusional process (Fig. 10), with a linear plot of peak current versus square-root of the scan rate observed: IP (A cm−3) = + 5.81 × 10⁻⁴ (A cm−3)/(V s−1)0.5 + 1.62 × 10⁻⁵ (A cm−3); (R2 = 0.993) for 3D GNR foam; IP (A cm−3) = + 1.02 × 10⁻² (A cm−3)/(V s−1)0.5 + 1.03 × 10⁻² (A cm−3) (R2 = 0.995) IP (A) = 0.52 × 10⁻² A (V s−1)0.5 + 4.53 × 10⁻⁴ A (R2 = 0.992) at the 3D PTGR foam; and IP (A cm−3) = + 4.54 × 10⁻³ (A cm−3)/(V s−1)0.5 + 2.10 × 10⁻³ (A cm−3) (R2 = 0.986) for the 3D RVC foam. The electrochemistry of DA has been reported previously, where slow electrode kinetics were observed when there was a lack of adsorption sites on the electrode surface (for example on boron-doped diamond)57 and we infer that this is likely the case for 3D electrodes explored herein. The investigation of where DA's oxidation peak occurs indicates the following values, ca. 281, 478 and 469 mV for the 3D GNR, 3D PTGR and 3D RVC electrodes respectively, which is in agreement with the ko values determined previously.
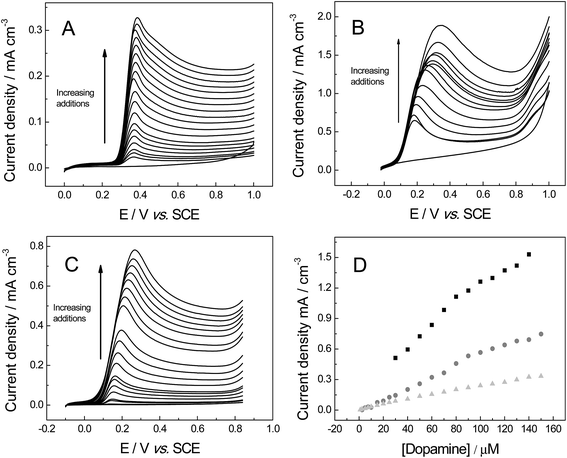
Fig. 11 investigates the electroanalytical response from successive additions of DA into a pH 7 PBS, where the 3D GNR foam, 3D PTGR foam and 3D RVC foam electrodes are utilised. Fig. 11D depicts the plot of the anodic current versus DA concentration, at each of the electrode materials of interest. It is evident that linear responses for our novel 3D GNR foam show an improved linear range (1.0 to 150 μM) when the performance is contrasted against the 3D PTGR (25 to 150 μM) and the 3D RVC foam (2.5 to 150 μM) alternatives. Note that the following linear coefficients were recorded, R2 = 0.995, 0.975 and 0.983 for the 3D GNR, 3D PTGR and 3D RVC foams respectively.
Electroanalytical summary/discussion
Table 1 summarises the analytical performance in terms of the sensitivity and LODs (three-sigma) towards the target analytes for the electrode materials studied (3D GNR foam vs. 3D PTGR foam vs. 3D RVC foam). In terms of the electroanalytical response of our newly fabricated novel 3D GNR foam electrode, it was shown to give rise to an improved linear range and limit of detection towards some analytes (UA and AP); however, in certain cases the alternative carbon based 3D foams out-performed the GNR foam. The beneficial response observed at the GNR foam occurs where the electrochemical response is predominantly dictated by the HET properties and the electronic state of the electrode material. This improved performance therefore corresponds well with the favourable electrochemical properties determined at our GNR foam, likely due to the high edge plane content of the graphene nano-ribbon structure. The poor performance at DA is likely due to influences of the oxygenated species present (or those lacking) on the 3D GNR foam in comparison to the other foams which may possess more favourable functionalization (such that adsorption sites are more readily realised, giving rise to improved electroanalytical performance).55 These findings question the need of ‘only’ fast heterogeneous electron transfer kinetics and suggest a compromise is needed between electron transfer speeds, the presence/absence of oxygenated species and the accessibility of the electrode's active surface area for improved sensing capabilities to be realised.| Analyte | Electrode material | Sensitivity/A M−1 | LOD (3σ)/μM |
|---|---|---|---|
| UA | 3D GNR | 16.10 | 1.1 (±0.1) |
| 3D PTGR | 5.91 | 5.0 (±0.4) | |
| 3D RVC | 3.39 | 0.8 (±0.2) | |
| AP | 3D GNR | 15.61 | 0.7 (±0.1) |
| 3D PTGR | 11.25 | 0.8 (±0.1) | |
| 3D RVC | 4.60 | 0.8 (±0.2) | |
| DA | 3D GNR | 2.22 | 0.7 (±0.2) |
| 3D PTGR | 9.52 | 6.4 (±0.3) | |
| 3D RVC | 5.31 | 0.9 (±0.2) |
Conclusions
The fabrication of a freestanding 3D graphene nano-ribbon (GNR) open cell foam electrode is reported. The synthesis is based upon a facile high temperature (1700 °C) low vacuum (50 Torr) process producing a 3D GNR foam comprising on average 4 graphene layers with an O/C ratio of 0.14; thus is a quasi-graphene structure with similar characteristics to that of carbon nanotubes (CNTs). This work has, for the first time, explored the electrochemical properties and resultant electroanalytical performance of this novel 3D GNR foam electrode and critically compared/contrasted the response to other available foam materials, such as 3D PTGR and RVC foam electrodes. Electrochemical characterisation revealed the 3D GNR foam to possess favourable HET properties when compared to the alternative carbon based 3D foams, which was attributed to the relative coverage of reactive edge plane like-sites/defects on its structure. In terms of the electroanalytical response of the 3D GNR foam electrode, it was shown to give rise to an improved linear range and limit of detection towards some analytes; however, in certain cases the alternative carbon based 3D foams out-performed the GNR foam. Our findings indicate that a compromise may sometimes be required (for improved sensing capabilities to be realised) between HET speeds, the presence/absence of oxygenated species and the accessibility of the electrode's active surface area; all of which would depend on the target analyte of interest. The 3D GNR foam electrode is a promising and beneficial architecture for possible future enhancements in the field of electrochemistry, namely as a catalyst support for energy applications (i.e. oxygen reduction reaction) or unmodified for sensing applications where interferences and applications into a real matrix/sample will need to be performed.Acknowledgements
D. A. C. Brownson acknowledges funding from the Ramsay Memorial Fellowships Trust.References
- G. G. Wildgoose, C. E. Banks, H. C. Leventis and R. G. Compton, Microchim. Acta, 2006, 152, 187–214 CrossRef CAS.
- K. P. Gong, Y. M. Yan, M. N. Zhang, L. Su, S. X. Xiong and L. Q. Mao, Anal. Sci., 2005, 21, 1383–1393 CrossRef CAS PubMed.
- J. Wang, Electroanalysis, 2005, 17, 7–14 CrossRef CAS.
- L. Agui, P. Yanez-Sedeno and J. M. Pingarron, Anal. Chim. Acta, 2008, 622, 11–47 CrossRef PubMed.
- M. Trojanowicz, TrAC, Trends Anal. Chem., 2006, 25, 480–489 CrossRef CAS.
- D. A. C. Brownson, D. K. Kampouris and C. E. Banks, Chem. Soc. Rev., 2012, 41, 6944–6976 RSC.
- J. P. Metters and C. E. Banks, Vacuum, 2012, 86, 507–519 CrossRef CAS.
- B. C. Janegitz, L. C. S. Figueiredo-Filho, L. H. Marcolino-Junior, S. P. N. Souza, E. R. Pereira-Filho and O. Fatibello-Filho, J. Electroanal. Chem., 2011, 660, 209–216 CrossRef CAS.
- L. C. S. Figueiredo-Filho, T. A. Silva, F. C. Vicentini and O. Fatibello-Filho, Analyst, 2014, 139, 2842–2849 RSC.
- L. L. C. Garcia, L. C. S. Figueiredo-Filho, G. G. Oliveira, O. Fatibello-Filho and C. E. Banks, Sens. Actuators, B, 2013, 181, 306–311 CrossRef CAS.
- H. Hou, C. E. Banks, M. Jing, Y. Zhang and X. Ji, Adv. Mater., 2015, 27, 7861–7866 CrossRef CAS PubMed.
- Y. H. Chin, J. L. Hu, C. S. Cao, Y. F. Gao and Y. Wang, Catal. Today, 2005, 110, 47–52 CrossRef CAS.
- C. Pham-Huu, R. Vieira, B. Louis, A. Carvalho, J. Amadou, T. Dintzer and M. J. Ledoux, J. Catal., 2006, 240, 194–202 CrossRef CAS.
- D. A. C. Brownson and C. E. Banks, Phys. Chem. Chem. Phys., 2011, 13, 15825–15828 RSC.
- D. A. C. Brownson and C. E. Banks, The Handbook of Graphene Electrochemistry, Springer Publishing, London, UK, 2014 Search PubMed.
- E. P. Randviir, D. A. C. Brownson, J. P. Metters, R. O. Kadara and C. E. Banks, Phys. Chem. Chem. Phys., 2014, 16, 4598–4611 RSC.
- D. A. C. Brownson, L. J. Munro, D. K. Kampouris and C. E. Banks, RSC Adv., 2011, 1, 978–988 RSC.
- S.-H. Park, K.-H. Kim, K. C. Roh and K.-B. Kim, J. Porous Mater., 2013, 20, 1289–1297 CrossRef CAS.
- A. Ambrosi, A. Bonanni and M. Pumera, Nanoscale, 2011, 3, 2256–2260 RSC.
- R. R. Moore, C. E. Banks and R. G. Compton, Anal. Chem., 2004, 76, 2677–2682 CrossRef CAS PubMed.
- A. J. S. Ahammad, J. J. Lee and M. A. Rahman, Sensors, 2009, 9, 2289–2319 CrossRef PubMed.
- J. Campos-Delgado, J. M. Romo-Herrera, X. Jia, D. A. Cullen, H. Muramatsu, Y. A. Kim, T. Hayashi, Z. Ren, D. J. Smith, Y. Okuno, T. Ohba, H. Kanoh, K. Kaneko, M. Endo, H. Terrones, M. S. Dresselhaus and M. Terrones, Nano Lett., 2008, 8, 2773–2778 CrossRef CAS PubMed.
- L. Chico, H. Santos, A. Ayuela, W. Jaskólski, M. Pelc and L. Brey, Acta Phys. Pol., A, 2010, 118, 433–441 CAS.
- Z. P. Chen, W. C. Ren, L. B. Gao, B. L. Liu, S. F. Pei and H. M. Cheng, Nat. Mater., 2011, 10, 424–428 CrossRef CAS PubMed.
- Y. F. Liu, H. Ba, D. L. Nguyen, O. Ersen, T. Romero, S. Zafeiratos, D. Begin, I. Janowska and P. H. Cuong, J. Mater. Chem. A, 2013, 1, 9508–9516 CAS.
- X. C. Dong, Y. F. Cao, J. Wang, M. B. Chan-Park, L. H. Wang, W. Huang and P. Chen, RSC Adv., 2012, 2, 4364–4369 RSC.
- X. C. Dong, X. W. Wang, L. H. Wang, H. Song, H. Zhang, W. Huang and P. Chen, ACS Appl. Mater. Interfaces, 2012, 4, 3129–3133 CAS.
- X. Dong, Y. Ma, G. Zhu, Y. Huang, J. Wang, M. B. Chan-Park, L. Wang, W. Huang and P. Chen, J. Mater. Chem., 2012, 22, 17044–17048 RSC.
- D. A. C. Brownson, L. C. S. Figueiredo, X. B. Ji, M. Gomez-Mingot, J. Iniesta, O. Fatibello, D. K. Kampouris and C. E. Banks, J. Mater. Chem. A, 2013, 1, 5962–5972 CAS.
- L. C. S. Figueiredo-Filho, D. A. C. Brownson, O. Fatibello-Filho and C. E. Banks, Electroanalysis, 2014, 26, 93–102 CrossRef CAS.
- Y. Wang, D. C. Alsmeyer and R. L. McCreery, Chem. Mater., 1990, 2, 557–563 CrossRef CAS.
- L. C. S. Figueiredo, D. A. C. Brownson, M. Gomez-Mingot, J. Iniesta, O. Fatibello and C. E. Banks, Analyst, 2013, 138, 6354–6364 RSC.
- J. M. Friedrich, C. Ponce-De-Leon, G. W. Reade and F. C. Walsh, J. Electroanal. Chem., 2004, 561, 203–217 CrossRef CAS.
- L. Jiao, L. Zhang, X. Wang, G. Diankov and H. Dai, Nature, 2009, 458, 877–880 CrossRef CAS PubMed.
- S. Costa, E. Borowiak-Palen, M. Kruszynska, A. Bachmatiuk and R. J. Kalenczuk, Mater. Sci., 2008, 26, 433–441 CAS.
- M. S. Dresselhaus, A. Jorio, M. Hofmann, G. Dresselhaus and R. Saito, Nano Lett., 2010, 10, 751–758 CrossRef CAS PubMed.
- A. Jorio, M. A. Pimenta, A. G. Souza, R. Saito, G. Dresselhaus and M. S. Dresselhaus, New J. Phys., 2003, 5, 139 CrossRef.
- M. A. Pimenta, G. Dresselhaus, M. S. Dresselhaus, L. G. Cancado, A. Jorio and R. Saito, Phys. Chem. Chem. Phys., 2007, 9, 1276–1291 RSC.
- L. M. Malard, M. A. Pimenta, G. Dresselhaus and M. S. Dresselhaus, Phys. Rep., 2009, 473, 51–87 CrossRef CAS.
- D. A. C. Brownson and C. E. Banks, Phys. Chem. Chem. Phys., 2012, 14, 8264–8281 RSC.
- R. L. McCreery, Chem. Rev., 2008, 108, 2646–2687 CrossRef CAS PubMed.
- D. A. C. Brownson, P. J. Kelly and C. E. Banks, RSC Adv., 2015, 5, 37281–37286 RSC.
- R. S. Nicholson, Anal. Chem., 1965, 37, 1351–1355 CrossRef CAS.
- T. J. Meyer and H. Taube, Inorg. Chem., 1968, 7, 2369 CrossRef CAS.
- E. J. F. Dickinson, J. G. Limon-Petersen, N. V. Rees and R. G. Compton, J. Phys. Chem. C, 2009, 113, 11157–11171 CAS.
- D. A. C. Brownson, S. A. Varey, F. Hussain, S. J. Haigh and C. E. Banks, Nanoscale, 2014, 6, 1607–1621 RSC.
- A. Chou, T. Bocking, N. K. Singh and J. J. Gooding, Chem. Commun., 2005, 842–844 RSC.
- T. A. Silva, H. Zanin, F. C. Vicentini, E. J. Corat and O. Fatibello-Filho, Analyst, 2014, 139, 2832–2841 RSC.
- C. E. Banks, T. J. Davies, G. G. Wildgoose and R. G. Compton, Chem. Commun., 2005, 829–841 RSC.
- S. C. S. Lai, A. N. Patel, K. McKelvey and P. R. Unwin, Angew. Chem., Int. Ed., 2012, 51, 5405–5408 CrossRef CAS PubMed.
- K. K. Cline, M. T. McDermott and R. L. McCreery, J. Phys. Chem., 1994, 98, 5314–5319 CrossRef CAS.
- F. C. Vicentini, A. E. Ravanini, L. C. S. Figueiredo-Filho, J. Iniesta, C. E. Banks and O. Fatibello-Filho, Electrochim. Acta, 2015, 157, 125–133 CrossRef CAS.
- D. A. C. Brownson, M. Gomez-Mingot and C. E. Banks, Phys. Chem. Chem. Phys., 2011, 13, 20284–20288 RSC.
- M. E. Bosch, A. J. R. Sánchez, F. S. Rojas and C. B. Ojeda, J. Pharm. Biomed. Anal., 2006, 42, 291–321 CrossRef CAS PubMed.
- D. A. C. Brownson, C. W. Foster and C. E. Banks, Analyst, 2012, 137, 1815–1823 RSC.
- R. M. Wightman, L. J. May and A. C. Michael, Anal. Chem., 1988, 60, A769 CrossRef.
- M. C. Granger, M. Witek, J. S. Xu, J. Wang, M. Hupert, A. Hanks, M. D. Koppang, J. E. Butler, G. Lucazeau, M. Mermoux, J. W. Strojek and G. M. Swain, Anal. Chem., 2000, 72, 3793–3804 CrossRef CAS PubMed.
Footnote |
| † Electronic supplementary information (ESI) available. See DOI: 10.1039/c5ta08561f |
| This journal is © The Royal Society of Chemistry 2016 |

