Modulating high-energy visible light absorption to attain neutral-state black electrochromic polymers†
Wei Teng
Neo
ab,
Ching Mui
Cho
a,
Zugui
Shi
a,
Soo-Jin
Chua
ac and
Jianwei
Xu
*ad
aInstitute of Materials Research and Engineering, A*STAR (Agency for Science, Technology and Research), 3 Research Link, Singapore 117602, Singapore. E-mail: jw-xu@imre.a-star.edu.sg
bNUS Graduate School for Integrative Sciences and Engineering, National University of Singapore, 28 Medical Drive, Singapore 117456, Singapore
cDepartment of Electrical and Computer Engineering, National University of Singapore, 4 Engineering Drive 3, Singapore 117583, Singapore
dDepartment of Chemistry, National University of Singapore, 3 Science Drive 3, Singapore 117543, Singapore
First published on 12th November 2015
Abstract
Neutral-state black diketopyrrolopyrrole (DPP)-based conjugated polymers with the colour channels a* from −3 to 0 and b* from −2 to −7 are achieved by incorporating an additional donor segment – dialkoxythiophene (DalkOT), which leads to the enhancement in blue-wavelength absorption. The polymers display black-to-transmissive grey electrochromic switching with good redox stability.
Neutral-state coloured polymers that can switch to transmissive states1–4 upon an electrical bias are highly attractive as they are suitable for numerous applications such as e-papers, electronic tags and ophthalmic lenses.5 This is especially for black polymers, which for a period of time, have remained elusive due to the necessity of complete absorption of light by the materials across the entire visible region. In recent years, great success has been achieved by utilizing the subtractive colour mixing theory which makes use of the simultaneous absorptions of light over multiple wavelength ranges.6,7 To this end, several means have been employed. These include copolymerizing two or more monomers,8–13 blending9 or stacking multiple polymer films physically.9,14–17 In the synthesis of copolymers, the donor–acceptor approach has been exceptionally important and useful due to the presence of characteristic dual absorptions in the resulting polymers. Tuning of the positions and relative intensities of the dual absorptions by modulating the donor-to-acceptor ratio as well as the chemical structure of the polymers allows the facile manipulation of colours. Empirically, it appears that the absorption profiles of the resultant polymers are highly correlated to the sum of the individual absorption spectra of the constituting conjugated donor–donor and donor–acceptor segments,11,13 with slight shifts in the absorption peaks, relative intensities and possible broadening of the bands.12
In our recent studies, we reported two series of high-performance electrochromic donor–acceptor polymers based on DPP, which have not been fully examined in this field.18,19 Low bandgap polymers with tunable neutral-state hues ranging from green, blue to magenta were achieved by copolymerizing with different donor moieties such as ethylenedioxythiophene (EDOT) and propylenedioxythiophene (ProDOT). Among them, one of the DPP and ProDOT-based copolymer (herein named DPP ProDOT) exhibits a dark bluish-black hue (a* = 3, b* = −18). The cause of the blue hue observed by the human eye is the lack of strong absorption of visible light within the 390–500 nm wavelength range. Inspired, we aim to obtain neutral-state black polymers by regulating absorptions of light in the short wavelengths through fine structural modifications. Typically, polymers composed of DalkOT exhibit blue-shifted absorptions in comparison to those made up of ProDOT.20 For instance, a homopolymer of DalkOT is orange in its neutral state21 whereas the ProDOT counterpart with identical ethylhexyloxy side chains shows a red hue, with a 60 nm bathochromic shift in absorption maximum (543 versus 483 nm).22 Hence, we hypothesized that by substituting some of the ProDOT units with DalkOT, the void at the high-energy visible region will be filled up. Moreover, the addition of a new unit will lead to new interacting conjugated segments with absorptions at different wavelength regions. The merging of discrete and localized absorptions into a broad band will ideally result in black polymers. The optimization of the composition of the monomers was carried out by systematically adjusting the ratio between ProDOT (monomer 2) and DalkOT (monomer 3) while keeping the amount of thiophene-flanked DPP (monomer 1) the same across three copolymers (see Scheme 1).
The synthetic route leading to polymers P1–P3 is shown in Scheme 1. All polymers were synthesized via the classic Stille coupling reaction and were obtained in good yields. The molecular weights of the polymers were also measured by gel permeation chromatography, and it was found that the polymers possess high number-average molecular weights in the range of 69–77 kg mol−1 and the polydispersity index between 1.66 and 1.72 (see ESI†). The polymers also display good thermal stability in nitrogen with decomposition temperatures between 358 and 369 °C (Fig. S7, ESI†).
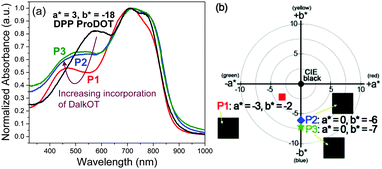
Through the incorporation of the DalkOT moiety into the random polymers, the extent of backbone planarity and effective conjugation are observed to be minimally reduced as the optical band gap (1.40–1.42 eV) and absorption onset (872–883 nm) remain relatively unchanged across P1–P3 and in comparison to DPP ProDOT (1.39 eV, 889 nm) as seen from the UV-vis absorption spectra in film states (Fig. 1a). Nevertheless, distinct changes in the absorption spectra were observed. Upon the increasing addition of DalkOT, the initial peak of DPP ProDOT at 572 nm depletes and a new absorption band around 350–520 nm was formed. The new hypsochromically-shifted band broadens and grows in intensity, which allows the entire visible spectrum (390–700 nm) to be almost covered. From computational studies, it is revealed that the conjugated segments comprising of DalkOT exhibit slightly larger torsional strain in comparison to that of ProDOT, which may have led to marginal blueshifts in the absorption of the former. The calculated absorption spectrum of the molecular DalkOT-embedded segment also displays an increased number of allowed electronic transitions with high oscillator strengths within the 240–320 nm region (see ESI†) which, upon further conjugation along the polymer chains, may have red-shifted to form the broad band across 350–520 nm as observed in the experimental spectra.
 | ||
| Fig. 1 (a) Normalized absorption spectra of P1–P3 thin films relative to DPP ProDOT. (b) Colorimetric (L*a*b*) values and photographs (inset) of near-black P1–P3 ECDs. | ||
As the bandgaps and frontier molecular orbital energy levels are determined from the long-wavelength absorption which is largely governed by the intramolecular charge transfer interaction between the donor and the electron-accepting DPP unit, the constant donor-to-acceptor ratio employed for P1–P3 should result in highly similar electronic energy profiles. This is in line with cyclic voltammetric studies which reveal comparable oxidation onsets (Fig. S9 and Table S1, ESI†). The shallow-lying highest occupied molecular orbital (HOMO) levels in the range of −4.98–−5.06 eV, which translate to low operation potentials, are favourable for electrochromic applications.
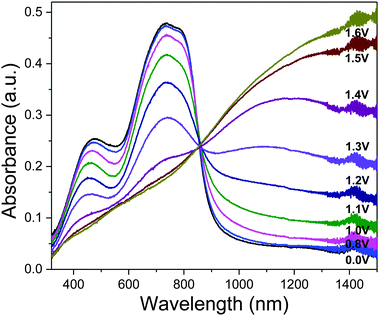
For the characterization of the colorimetric and electrochromic properties of the polymers, P1–P3 solutions were spray-cast onto indium tin oxide (ITO)-coated glass slides. Absorption/transmission type electrochromic devices (ECDs) were subsequently fabricated. A detailed procedure for the device fabrication is provided in the experimental section. The resultant P1–P3 ECDs obtained from films spray-cast to around 1.0 a.u. exhibit near-black hues as determined by the L*a*b* colorimetric measurements (based on the Commission Internationale de I'Eclairage CIE 1976 L*a*b* model). P1, P2 and P3 reveal a* and b* values of as low as (−3, −2), (0, −6) and (0, −7), respectively which are closer to the true black (a* = 0, b* = 0) than most reported ‘black’ polymers mentioned earlier (Fig. 1b). This is achieved in spite of the rather uneven absorption intensities throughout the visible wavelength region, which suggests that a completely uniform, level absorbance across the visible spectrum is unnecessary to induce near-black hues. The extent of light absorption in the short-wavelength region can be slightly compromised, as it is compensated by the reduced sensitivity of the human eye towards blue light.23 The optical changes for the ECD were probed by in situ spectroelectrochemistry in which the UV-visible-NIR absorption spectra were recorded as a function of applied potential from 0.0 V to 1.6 V. For all polymers P1–P3, the ground-state absorption bands across the visible region deplete progressively upon electrochemical oxidation with the concomitant formation of a low-energy broad band in the NIR region from 1000 to 1500 nm due to the generation of positively-charged polarons (Fig. 2 and Fig. S10, ESI†). Above 1.6 V, spectral changes are minimal, suggesting that the optimal operating potential for the devices is around 1.6 V. In the fully oxidized states, P1–P3 reveal light grey transmissive hues due to the presence of residual tailing into the visible region.
 | ||
| Fig. 2 Spectroelectrochemical spectra of P1 as the electroactive layer in an ECD measured at various applied potentials. The duration at which each potential was applied is held for 100 s. | ||
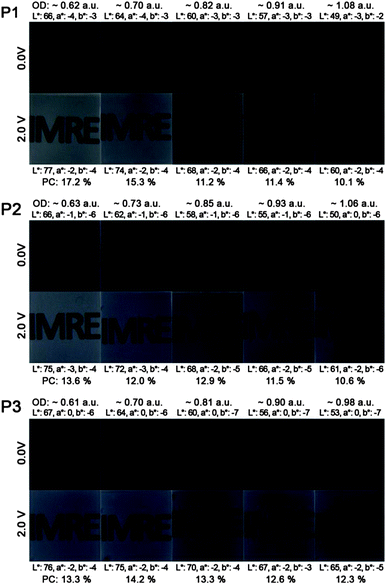
Fig. 3 illustrates the photos and L*a*b* values of P1–P3 ECDs in their neutral (0.0 V) and oxidized (2.0 V) states across a series of films spray-cast to varying optical densities (∼0.6 to 1.0 a.u.). For all the polymers, an increase in the optical densities of the films gives rise to a lowering of the L* value (from around 66–67 in the thinnest film to 49–53 in the thickest film), while the a* and b* values display little or no change. Upon oxidation, the L* value increases due to the heightened level of transmissivity of the devices whereas negligible changes to both a* and b* values are observed. This signifies that the absorptions in the visible region of P1–P3 are depleted equally during electrochromic oxidation and the switching of the ECDs transits across multiple shades of grey. In the case of unequal depletion of the visible absorption bands, the generated oxidized hues will display different colour tones and significant shifts in both a* and b* values. For a more meaningful determination of the degree of optical change in black-to-transmissive switching P1–P3, the photopic contrasts (PC)24 are calculated as the difference in transmittance between the neutral and oxidized states integrated over the visible spectrum (400–700 nm) instead of a single wavelength typically employed for electrochromic studies. The transmittance spectra of the ECDs are taken from the measurements of the colorimeter instead of the UV-vis-NIR spectrophotometer to take into account the emittance of the light source and sensitivity of the human eye across different wavelengths. Across polymers P1 to P3, the photopic contrasts generally decrease with increasing film thickness as a result of increased residual absorption. Maximum contrasts of about 17.2, 13.6 and 14.2% were obtained for P1 to P3 respectively, for films spray-cast to 0.6–0.7 a.u. (Fig. 3).
 | ||
| Fig. 3 Photos, L*a*b* values and photopic contrasts (PC) of P1–P3 ECDs at various optical densities in their neutral and oxidized states. | ||
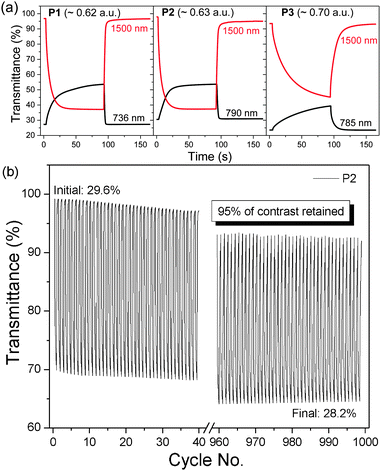
As an approximation for the switching behaviour and kinetics of the ECDs, the transmittance values are recorded at two different wavelengths (P1: 736, 1500 nm, P2: 790, 1500 nm, P3: 785, 1500 nm) as the devices are subjected to square-wave potential-steps between +1.6 and −1.6 V (Fig. 4a). Polymer films with absorbance of around 0.6–0.7 a.u. were employed. Both P1 and P2 reveal similar switching properties with NIR (1500 nm) contrast of up to 60% and switching speeds in the range of a few to tens of seconds (time taken to reach 95% of the full switch). In contrast, P3 displays lower optical contrast and slower speeds, which is presumably due to the increased torsional strain that hampers the planarization of the polymer backbone for delocalization of charge carriers during electrochemical oxidation.21 A detailed summary of the electrochromic performance of P1–P3 ECDs is given in Table S2 (ESI†). Further analysis on the redox stability of P1–P3 ECDs was carried out by monitoring the change in optical contrasts at 1500 nm as the devices were repeatedly cycled between +1.6 and −1.6 V at 20 s residence time. A break-in period of 20 cycles was allowed for all devices. All the ECDs, despite being fabricated without encapsulation, exhibit a gradual drop in optical contrasts and at the end of 1000 redox cycles, about 70, 95 and 95% of the initial contrasts were retained for P1, P2 and P3 respectively (Fig. 4b and Fig. S11, ESI†).
In conclusion, we have demonstrated a strategy to modulate visible light absorptions in the high-energy blue-wavelength region. The approach of incorporating the DalkOT moiety to a series of DPP-based random polymers produced neutral-state black polymers with broad visible absorptions and low bandgaps. Fully functional electrochromic black-to-transmissive grey devices with reasonable optical/photopic contrasts, switching speeds and ambient redox stabilities were also demonstrated. Further material and device optimization can be carried out to enhance the photopic contrasts and switching kinetics.
Experimental
Materials
All chemicals, including monomer 4, were purchased from commercial sources and used as received unless otherwise noted.Synthesis of monomers
The syntheses of monomers 1 and 2 have been reported previously.19 2,5-Dibromo-3,4-ditetradecyloxythiophene (monomer 3) was synthesized according to a reported method,25 followed by bromination with NBS.Synthesis of polymers P1–P3
Monomers 1 (0.03 mmol), 2 (0.05 mmol), 3 (0.02 mmol) and 4 (0.1 mmol) were dissolved in 12 mL of toluene, and the mixture was stirred and purged with argon for approximately 15 min. Subsequently, Pd(PPh3)4 (2.5 mol%) was added to the reaction flask. Purging with argon was continued for 15 min and the mixture was then heated to 110 °C for 48 h. After cooling to room temperature, the solvent was removed under reduced pressure. The residue was then precipitated in methanol. Subsequently, the polymer was collected by suction filtration and subjected to Soxhlet extraction with acetone, hexane and chloroform. The chloroform fraction was concentrated and evaporated to dryness to afford P1, a black solid. P2 and P3 were prepared using the same method, at the respective feed ratios of 2 and 3 stated in Scheme 1.P1: yield 60%. 1H NMR (main signals) (400 MHz, CDCl3): δ (ppm) 4.34–3.88 (br, m), 3.70–3.35 (br, m), 1.58 (br, m), 1.27 (br, m), 0.88 (br, s). GPC using PMMA in THF as standard: (Mn = 69.3k, Mw = 115.3k, PDI = 1.66).
P2: yield 60%. 1H NMR (main signals) (400 MHz, CDCl3): δ (ppm) 4.35–3.84 (br, m), 3.70–3.37 (br, m), 1.60 (br, m), 1.28 (br, m), 0.88 (br, s). GPC using PMMA in THF as standard: (Mn = 77.4k, Mw = 133.3k, PDI = 1.72).
P3: yield 64%. 1H NMR (main signals) (400 MHz, CDCl3): δ (ppm) 4.34–3.85 (br, m), 3.70–3.33 (br, m), 1.58 (br, m), 1.27 (br, m), 0.88 (br, s). GPC using PMMA in THF as standard: (Mn = 74.4k, Mw = 125.0k, PDI = 1.68).
Electrochromic device fabrication
ITO-coated glass substrates (15 Ω sq−1, 35 × 30 × 1.1 mm) were purchased from Xinyan Technology Ltd. Prior to use, ITO/glass substrates were cleaned by successive ultrasonication in acetone, isopropyl alcohol and distilled water, and blown dry with N2. Polymer solutions of P1–P3 were prepared at a concentration of 10 mg mL−1 in 1![[thin space (1/6-em)]](https://www.rsc.org/images/entities/char_2009.gif) :
:![[thin space (1/6-em)]](https://www.rsc.org/images/entities/char_2009.gif) 3 (v/v) chloroform
3 (v/v) chloroform![[thin space (1/6-em)]](https://www.rsc.org/images/entities/char_2009.gif) :
:![[thin space (1/6-em)]](https://www.rsc.org/images/entities/char_2009.gif) chlorobenzene. Polymer films were prepared by spray-casting the prepared solutions onto the ITO substrates to the desired optical density using a commercial airbrush operated at 12 psi. Excessive polymer edges were subsequently removed by swabbing with chloroform using a cotton bud to obtain an active area of 2 × 2 cm2. On a second piece of the ITO substrate, an area of 2 × 2 cm2 was blocked out using a parafilm. The total thickness of the parafilm spacer and the barrier was kept constant at 0.01′′. 250 μL of the gel electrolyte (0.512 g of lithium perchlorate and 2.8 g of poly(methyl methacrylate) (Mw = 120
chlorobenzene. Polymer films were prepared by spray-casting the prepared solutions onto the ITO substrates to the desired optical density using a commercial airbrush operated at 12 psi. Excessive polymer edges were subsequently removed by swabbing with chloroform using a cotton bud to obtain an active area of 2 × 2 cm2. On a second piece of the ITO substrate, an area of 2 × 2 cm2 was blocked out using a parafilm. The total thickness of the parafilm spacer and the barrier was kept constant at 0.01′′. 250 μL of the gel electrolyte (0.512 g of lithium perchlorate and 2.8 g of poly(methyl methacrylate) (Mw = 120![[thin space (1/6-em)]](https://www.rsc.org/images/entities/char_2009.gif) 000 g mol−1) in 6.65 mL of propylene carbonate and 28 mL of dry acetonitrile (ACN)) was pipetted within the area and left to dry for 5 minutes. The device was fabricated by assembling the two ITO/glass substrates together with the polymer film and the gel electrolyte in contact. All fabrication steps were carried out under ambient conditions.
000 g mol−1) in 6.65 mL of propylene carbonate and 28 mL of dry acetonitrile (ACN)) was pipetted within the area and left to dry for 5 minutes. The device was fabricated by assembling the two ITO/glass substrates together with the polymer film and the gel electrolyte in contact. All fabrication steps were carried out under ambient conditions.
Instrumentation
The 1H NMR spectra were recorded in CDCl3 using a Bruker Avance 400 MHz spectrometer. Gel permeation chromatography was carried out using an Alliance Waters 2690 system with HPLC grade THF as the eluent and calibrated against poly(methyl methacrylate) (PMMA). Polymers at 5 mg mL−1 concentration were prepared and filtered prior to sample injection. TGA was performed under nitrogen at a heating rate of 20 °C min−1 using a Perkin Elmer TGA-7 thermal analyzer. All UV-vis/UV-vis-NIR absorption spectra were recorded using a Shimadzu UV-3600 UV-vis-NIR spectrophotometer. Cyclic voltammetry experiments were carried out using an Autolab PGSTAT128N potentiostat. Measurements were done in a MBraun LABmaster 130 glove box, in a three-electrode cell configuration with polymer-coated glassy carbon, Pt wire and Ag wire as the working, counter and pseudo-reference electrodes respectively. A 0.1 M LiClO4/ACN electrolyte/solvent couple was used and all measurements were recorded at 50 mV s−1. The pseudo-reference electrode was calibrated against the ferrocene/ferrocenium redox couple. All electrochromic studies were performed in situ, using both the potentiostat and the spectrophotometer. CIE L*, a*, b* values of the devices were reported under outdoor daylight illumination (65/10°) and measured using Hunterlab ColorQuest XE.Acknowledgements
The authors would like to acknowledge the financial support from the Agency for Science, Technology and Research (A* STAR) and the Ministry of National Development (MND) (Green Building Joint Grant No. 1321760011, Singapore). This work was also supported by the A*STAR Computational Resource Centre through the use of its high performance computing facilities. We would like to thank Dr Lin Tingting for the computational calculations.Notes and references
- X. Chen, H. Liu, Z. Xu, S. Mi, J. Zheng and C. Xu, ACS Appl. Mater. Interfaces, 2015, 7, 11387–11392 CAS.
- X. Chen, Z. Xu, S. Mi, J. Zheng and C. Xu, New J. Chem., 2015, 39, 5389–5394 RSC.
- W. T. Neo, K. H. Ong, T. T. Lin, S.-J. Chua and J. Xu, J. Mater. Chem. C, 2015, 3, 5589–5597 RSC.
- Q. Ye, W. T. Neo, T. Lin, J. Song, H. Yan, H. Zhou, K. W. Shah, S. J. Chua and J. Xu, Polym. Chem., 2015, 6, 1487–1494 RSC.
- R. J. Mortimer, Annu. Rev. Mater. Res., 2011, 41, 241–268 CrossRef CAS.
- G. Sonmez, Chem. Commun., 2005, 5251–5259 RSC.
- G. Sonmez, H. B. Sonmez, C. K. F. Shen and F. Wudl, Adv. Mater., 2004, 16, 1905–1908 CrossRef CAS.
- P. Shi, C. M. Amb, E. P. Knott, E. J. Thompson, D. Y. Liu, J. Mei, A. L. Dyer and J. R. Reynolds, Adv. Mater., 2010, 22, 4949–4953 CrossRef CAS PubMed.
- S. V. Vasilyeva, P. M. Beaujuge, S. Wang, J. E. Babiarz, V. W. Ballarotto and J. R. Reynolds, ACS Appl. Mater. Interfaces, 2011, 3, 1022–1032 CAS.
- G. Oktem, A. Balan, D. Baran and L. Toppare, Chem. Commun., 2011, 47, 3933–3935 RSC.
- K.-R. Lee and G. A. Sotzing, Chem. Commun., 2013, 49, 5192–5194 RSC.
- P. M. Beaujuge, S. Ellinger and J. R. Reynolds, Nat. Mater., 2008, 7, 795–799 CrossRef CAS PubMed.
- M. çli, M. Pamuk, F. Algı, A. M. Önal and A. Cihaner, Org. Electron., 2010, 11, 1255–1260 CrossRef.
- H. Shin, Y. Kim, T. Bhuvana, J. Lee, X. Yang, C. Park and E. Kim, ACS Appl. Mater. Interfaces, 2012, 4, 185–191 CAS.
- E. Unur, P. M. Beaujuge, S. Ellinger, J.-H. Jung and J. R. Reynolds, Chem. Mater., 2009, 21, 5145–5153 CrossRef CAS.
- G. Ding, C. M. Cho, C. Chen, D. Zhou, X. Wang, A. Y. X. Tan, J. Xu and X. Lu, Org. Electron., 2013, 14, 2748–2755 CrossRef CAS.
- C. M. Amb, J. A. Kerszulis, E. J. Thompson, A. L. Dyer and J. R. Reynolds, Polym. Chem., 2011, 2, 812–814 RSC.
- J. Z. Low, W. T. Neo, Q. Ye, W. J. Ong, I. H. K. Wong, T. T. Lin and J. Xu, J. Polym. Sci., Part A: Polym. Chem., 2015, 53, 1287–1295 CrossRef CAS.
- W. T. Neo, Z. Shi, C. M. Cho, S.-J. Chua and J. Xu, ChemPlusChem, 2015, 80, 1298–1305 CrossRef CAS.
- J. A. Kerszulis, K. E. Johnson, M. Kuepfert, D. Khoshabo, A. L. Dyer and J. R. Reynolds, J. Mater. Chem. C, 2015, 3, 3211–3218 RSC.
- A. L. Dyer, M. R. Craig, J. E. Babiarz, K. Kiyak and J. R. Reynolds, Macromolecules, 2010, 43, 4460–4467 CrossRef CAS.
- B. D. Reeves, C. R. G. Grenier, A. A. Argun, A. Cirpan, T. D. McCarley and J. R. Reynolds, Macromolecules, 2004, 37, 7559–7569 CrossRef CAS.
- M. W. Levine and J. M. Shefner, Fundamentals of Sensation and Perception, Brooks/Cole, 1991 Search PubMed.
- I. F. Perepichka and D. F. Perepichka, Handbook of Thiophene-Based Materials: Applications in Organic Electronics and Photonics, 2 Volume Set, Wiley, 2009 Search PubMed.
- W. T. Neo, C. M. Cho, J. Song, J. M. Chin, X. Wang, C. He, H. S. O. Chan and J. Xu, Eur. Polym. J., 2013, 49, 2446–2456 CrossRef CAS.
Footnote |
| † Electronic supplementary information (ESI) available: Polymer characterization, cyclic voltammograms, optical and electrochemical properties, spectroelectrochemical graphs, stability and electrochromic performance of ECDs, computational calculations. See DOI: 10.1039/c5tc02883c |
| This journal is © The Royal Society of Chemistry 2016 |


