A highly defective mesoporous carbon – ionic liquid paste electrode toward the sensitive electrochemical determination of rutin
Nourali
Mohammadi
a,
Narmin Bahrami
Adeh
*a and
Mostafa
Najafi
*b
aIranian Research & Development Center for Chemical Industries (IRDCI), Academic Center for Education, Culture and Research (ACECR), Karaj, Iran. E-mail: b_adeh@yahoo.com
bDepartment of Chemistry, Faculty of Science, Imam Hossein University, Tehran, 16597, Iran. E-mail: mnajafi@ihu.ac.ir
First published on 29th November 2016
Abstract
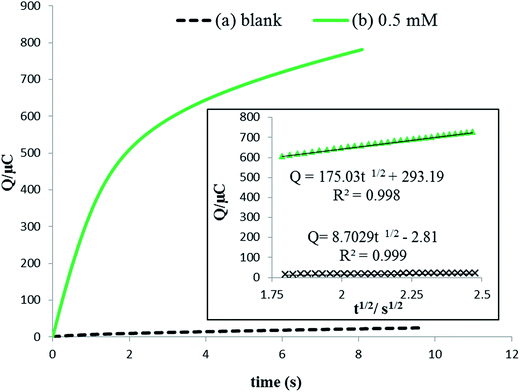
In this paper, a highly defective mesoporous carbon (DMC) and room temperature ionic liquid 1-butyl-3-methylimidazolium hexafluorophosphate (BMIM·PF6) were applied to fabricate a novel carbon paste electrode for the electrochemical sensing of rutin. The electrochemical properties of rutin on the modified electrode (IL/DMC/PE) were carefully investigated by cyclic voltammetry, electrochemical impedance spectroscopy and chronocoulometry. Electrochemical parameters of rutin on the surface of the modified electrode were determined with the electron transfer coefficient (α) as 0.53, the electron transfer number (n) as 2, the heterogeneous electron transfer rate constant (ks) as 37.1 s−1, the diffusion coefficient as 1.34 × 10⁻⁴ cm2 s−1 and saturated absorption capacity as 10.9 nmol cm−2. Under the optimal conditions, rutin could be detected in the concentration range from 0.008 μmol L−1 to 4.0 μmol L−1 with the detection limit as 1.17 nmol L−1 (S/N = 3) by square-wave voltammetry. The proposed sensor was further applied successfully for the determination of rutin content in some real samples, including Ruta graveolens extract, pharmaceutical tablets and orange juice.
1. Introduction
Rutin (3′,4′,5,7-tetrahydroxyflavone 3β-D-rutinoside) is one of the most bioactive flavonoids, also named vitamin P. It is found in many nutrimental plants such as Ruta graveolens and is an important component of plant-based foods and beverages. Some clinical investigations demonstrate that rutin has a broad range of medical functions, such as diluting the blood and reducing blood pressure and as a hemostatic, antitumor, and anti-bacterial drug and an anti-oxidant.1–3 Therefore, it has been widely used clinically as a pharmaceutical product4 and various preparations containing rutin have been approved as medicine worldwide.5 Hence, the quantitative determination of rutin is of considerable interest and different analytical techniques, including capillary electrophoresis,6 high-performance liquid chromatography (HPLC),7 spectrophotometry,8 sequential injection analysis9 and chemiluminescence10 have been applied to determine rutin in pharmaceutical drugs and biological samples. However, some of the mentioned methods often involve complicated operations, high consumption of toxic organic solvents, somewhat high-cost instruments, as well as technical personnel. Hopefully, electrochemical-based sensors are provided with some merits, such as a rapid and simple procedure, fast response, low cost, and in situ experimentation. Owing to phenolic hydroxyl groups in the structure of rutin, it is an electroactive material, which can be detected by electrochemical methods.11–18Mesoporous carbon materials due to unique structural features such as a high accessible surface area, good conductivity, a large pore volume, chemical inertness, thermal and mechanical stability, and a wide electrochemical stability window have attracted remarkable interest in different fields. Their applications have been expended in water purification,19 energy storage/conversion,20,21 catalysis,22 and gas storage.23 Moreover, the fabrication of an electrochemical sensing device applying mesoporous carbon as a recognition element has aroused great interest recently. For instance, Zhou et al. reported a label-free determination of lead ions by decorated gold nanoparticles on the surface of ordered mesoporous carbon.24 In another work, a CMK-3 modified carbon paste electrode was applied for the electroanalytical detection of bisphenol A.25 In addition, Yang et al. utilized a Prussian blue/ordered mesoporous carbon composite as a conductive support for the preparation of a metolcarb imprinted sensor.26
The presence of structural defects significantly alters the properties of carbon nanostructures. The results of the recent literature have confirmed that vacancy defects can serve as favorable sites for the electron transfer as well as adsorption sites which are beneficial for the fabrication of energy storage and electrochemical sensing devices. For example, an improved heterogeneous electron transfer rate toward the electrochemical reaction of ferrocenemethanol,27 oxygen,28 and nitrate29 was reported at the surface of defective nanocarbon-based electrodes. Also, the results of theoretical efforts predicted the favorable adsorption of Li+, Na+, and Ca2+ ions on the defective sites of graphene sheets.30–33 Generally, structural defects were induced by ion irradiation and chemical treatments.27,34–36 Also, recently we introduced a facile and mass-producible method for the synthesis of a highly defective mesoporous carbon.37
Carbon paste electrodes (CPEs), a homogenized paste constructed of carbon powder and a suitable organic liquid, have been widely used in electrochemical determination, thanks to their advantages such as low cost, ease of fabrication, large potential window, and simple surface renewal process.38–41 However, the paraffin oil used as the conventional organic liquid is a non-conductive material, which to some extent attenuates the electrochemical performance of the CPE. Room temperature ionic liquids (RTILs), possessing unique physicochemical properties such as high ionic conductivity, wide electrochemical windows, high viscosity and negligible vapor pressure have attracted significant attention as an alternative binder in the carbon paste matrix. In this sense, room temperature ionic liquid-based electrochemical sensors were developed for the rapid and sensitive electrochemical determination of different environmental and biological species.42–44
In this paper, a novel modified carbon paste electrode (denoted as IL/DMC/PE) was fabricated using a highly defective mesoporous carbon (DMC) and RTIL (BMIM·PF6) and its applicability toward the electrochemical determination of rutin was carefully investigated. Experimental parameters of the analytical procedure were optimized and the method was successfully used for the quantification of rutin content in Ruta graveolens extract, pharmaceutical tablets and orange juice. The obtained results indicate that the proposed sensor exhibits excellent sensitivity, selectivity, reproducibility and stability for the detection of rutin.
2. Experimental
2.1. Materials
Graphite powder (extra pure; particle size < 50 μm) was supplied by Merck. Commercial grade of fumed silica (N-20; average particle size: 15 nm; surface area: 185 m2 g−1) was purchased from Wacker, Germany. BMIM·PF6 was obtained from Kimia Exir, Iran. Paraffin oil was of analytical reagent grade and was obtained from Samchun Chemical Co., Ltd., South Korea. Rutin was of analytical grade and was supplied by Sigma. All other chemicals were of analytical reagent grade and were used as received. CMK-3 was a kind gift from IUST University, which had been synthesized using a previously reported method.452.2. Synthesis of highly defective mesoporous carbon (DMC)
DMC was synthesized using our previously described report.37 Briefly, a homogeneous mixture containing 2 grams of sucrose, 5.0 grams of KNO3, 4 grams of nanosilica and 100 mL of deionized water was prepared and then dried at 80 °C for 10 h. The obtained solid was first precarbonized at 140 °C for 3 hours and then main carbonization was performed at 800 °C for 1 h under flowing Ar. Finally, the desired carbon powder was obtained by etching the silica template via reflux at 80 °C in 1 M solution of NaOH.2.3. Preparation of working electrodes
In order to study the electrochemical behavior of the synthesized material, the appropriate paste electrodes were constructed. The desired modified electrode (IL/DMC/PE) was constructed by hand-mixing 0.35 g of graphite powder, 0.15 g of DMC, 0.1 g of BMIM·PF6, and 0.4 g of mineral oil thoroughly in a mortar to form a homogeneous paste, which was firmly packed into one end of a poly-amide tube (an internal diameter of 2.5 mm) with a copper wire inserted through the opposite end to establish an electrical contact. The DMC/PE modified electrodes were prepared by mixing 0.15 g of DMC, 0.35 g of graphite powder, and 0.50 g of paraffin oil. The conventional graphite paste electrode (CPE) was fabricated by mixing of 0.70 g of graphite and 0.30 g of mineral oil. The IL/CPE was prepared by mixing 0.70 g of graphite, 0.1 g of BMIM·PF6, and 0.20 g of mineral oil. Also, for the sake of comparison, the paste electrode of a commonly used mesoporous carbon, CMK-3, was constructed by mixing 0.15 g of CMK-3, 0.35 g of graphite powder, and 0.50 g of paraffin oil and the obtained electrode was denoted as CMK/PE.Prior to use, the surfaces of the obtained electrodes were smoothed on a piece of smooth paper. The electrochemical experiments were conducted on a potentiostat/galvanostat (SP150, Biologic, France). A traditional three-electrode cell was used for all electrochemical experiments with a carbon paste electrode as the working electrode, platinum wire as the auxiliary electrode and an Ag/AgCl electrode (saturated with KCl) as the reference electrode.
2.4. Preparation and analysis of real samples
500 mg of dried leaves of Ruta graveolens were dispersed in a solution of 100 mL ethanol. The resulting mixture was sonicated for 20 min and then filtered through a filter paper. The obtained filtrate was transferred to a centrifuge tube, and centrifuged at 3000 rpm for 5 min. The obtained extract was diluted using B–R buffer just prior to electrochemical analysis. The orange juice was bought from a local supermarket. The sample was filtered with a filter paper and then diluted with B–R buffer. Also, two rutin tablets (label amount: 20 mg per tablet) were ground into powder, and then a precise amount of the powder was dissolved in ethanol. The obtained filtrate was diluted quantitatively using B–R buffer just prior to electrochemical analysis. For comparison purposes, the prepared samples were also analyzed using the HPLC method. HPLC analysis was carried out on an Agilent HPLC instrument equipped with a diode array detector and XDB-C18 analytical column (250 mm × 4.6 mm × 5 μm). The mobile phase was [0.1% v/v acetic acid![[thin space (1/6-em)]](https://www.rsc.org/images/entities/char_2009.gif) :
:![[thin space (1/6-em)]](https://www.rsc.org/images/entities/char_2009.gif) acetonitrile (75
acetonitrile (75![[thin space (1/6-em)]](https://www.rsc.org/images/entities/char_2009.gif) :
:![[thin space (1/6-em)]](https://www.rsc.org/images/entities/char_2009.gif) 25, v/v)] and its flow rate was kept constant at 1.0 mL min−1.
25, v/v)] and its flow rate was kept constant at 1.0 mL min−1.
3. Results and discussion
3.1. Structural characterization
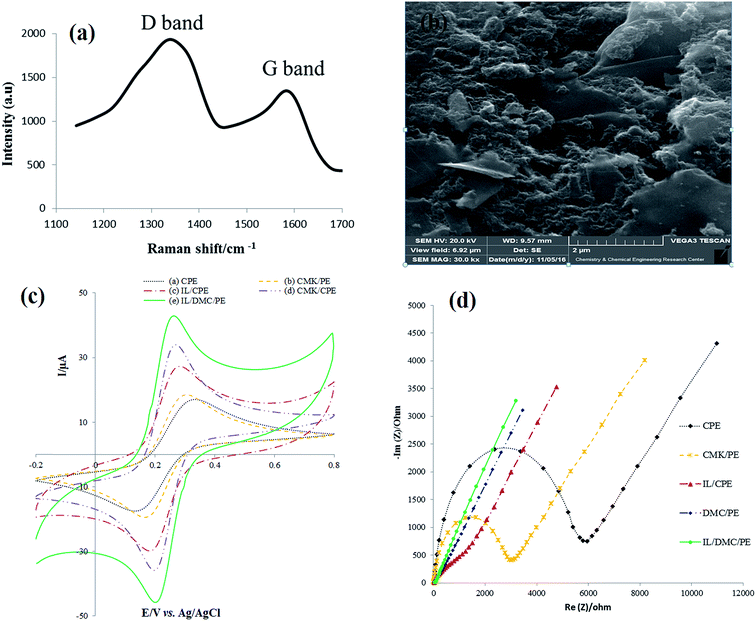
As shown in Fig. 2a, the Raman spectra of DMC exhibit the presence of D and G bands located at 1384 and 1595, respectively. The D line is attributed to the presence of the defects in typical graphite layers, and the G line corresponds to the E2g phonon of the stretching vibration modes of C![[double bond, length as m-dash]](https://www.rsc.org/images/entities/char_e001.gif) C bonds. This means that the relative intensity ratio of the D and G lines (ID/IG ratio) is proportional to the number of defect sites in the carbon nanostructure.46 The value of 1.6 for ID/IG clearly indicates the highly defective nature of the synthesized material. The SEM image of the surface of the IL/DMC/PE is presented in Fig. 1b. As shown in the figure, it can be seen that DMC particles were distributed uniformly on the electrode surface, indicating that DMC was successfully modified on the DMC/IL/PE.
C bonds. This means that the relative intensity ratio of the D and G lines (ID/IG ratio) is proportional to the number of defect sites in the carbon nanostructure.46 The value of 1.6 for ID/IG clearly indicates the highly defective nature of the synthesized material. The SEM image of the surface of the IL/DMC/PE is presented in Fig. 1b. As shown in the figure, it can be seen that DMC particles were distributed uniformly on the electrode surface, indicating that DMC was successfully modified on the DMC/IL/PE.
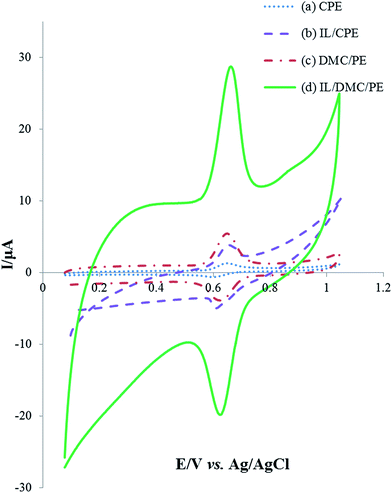 | ||
| Fig. 2 Cyclic voltammograms of 25 μmol L−1 rutin in B–R buffer solution (pH = 2.0) at different prepared electrodes at the scan rate of 50 mV s−1. | ||
3.2. Electrochemical characterization of the modified electrode
The electrochemical behavior of the as-prepared paste electrodes was investigated by cyclic voltammetry and electrochemical impedance spectroscopy employing Fe(CN)63−/4− as the electrochemical probe. As shown in Fig. 1c, a couple of well-defined redox peaks were obtained for the different paste electrodes. However, there are significant differences in the peak-to-peak potential separations (ΔEp). The ΔEp values of the CPE, CMK/PE, IL/CPE, DMC/PE and IL/DMC/PE were calculated to be 125, 107, 93, 65 and 63 mV, respectively. The obtained results indicate a significant improvement in the electron transfer kinetics at the surface of the DMC/PE and IL/DMC/PE. Also, the redox current responses were increased at the surface of the DMC/PE and IL/DMC/PE in comparison to the other electrodes. The improvement in the electrochemical behavior of DMC-based electrodes is attributed to the presence of a large number of structural defects which can serve as active sites for electrochemical reactions. As revealed by Raman spectroscopy (Fig. 1a), the ratio of ID/IG in the Raman spectra of DMC was determined to be 1.6 while its value for CMK-3 is about 0.85.47Electrochemical impedance spectroscopy (EIS) is a helpful technique to probe the interfacial changes during the modification process, where the semicircle portion observed at high frequencies in the Nyquist plots (Rrealvs. Rimaginary) corresponds to the charge transfer resistance (Rct), while the linear portion at lower frequencies represents the mass-diffusion limited process. The Nyquist diagrams of different constructed electrodes in 1.0 mmol L−1 [Fe(CN)6]3−/4− solution were recorded with the frequencies swept from 200k to 0.1 Hz and the results are shown in Fig. 1d. As depicted in the figure, the bare CPE showed the largest semicircle. After CMK-3, IL, DMC and IL/DMC were modified into paste electrodes a significant decrease in the semicircle diameter occurred. The charge transfer resistances of the modified electrodes were calculated by fitting the impedance spectra to the well-known Randles equivalence circuit model. The Rct values of the CPE, CMK/PE, IL/CPE, DMC/PE and IL/DMC/PE were determined to be 5170, 2660, 332, 39 and 18 Ω, respectively. Such low charge resistance value at the surface of the DMC/PE and DMC/IL/PE clearly indicates that the presence of DMC and BMIM·PF6 can effectively accelerate the electron transfer rate of redox reactions.
The electrochemical behavior of 25 μmol L−1 rutin at the surface of different electrodes was investigated using cyclic voltammetry in a pH 2.0 Britton–Robinson buffer solution with the results shown in Fig. 3. A pair of well-defined redox peaks appeared on each electrode which indicated that the electrochemical reaction of rutin was realized. Compared with the bare CPE, IL/CPE and DMC/PE, the electrochemical response on the IL/DMC/PE increased about 18.2, 5.4 and 4.3 times, respectively. As seen in the figure, the background current was increased by the modification of the paste electrode by the IL; therefore different amounts of the IL (2, 5, 7.5, 10, 12.5 and 15%) were used in the fabrication of the modified electrode. The CV results (data not shown) showed that the optimum signal to noise ratio was obtained when the amount of IL was 10%. Also, the peak-to-peak separation (ΔEp) was determined to be 52, 44, 35 and 33 mV at the surface of the CPE, IL/CPE, DMC/PE and IL/DMC/PE, respectively. It can be concluded that DMC and the IL on the electrode surface could act as an effective mediator to facilitate the redox reaction of rutin, which could be attributed to charge interactions between the IL and rutin, which accumulated rutin at the electrode surface. Therefore, the IL/DMC/PE was examined as a novel platform for the sensitive determination of rutin.
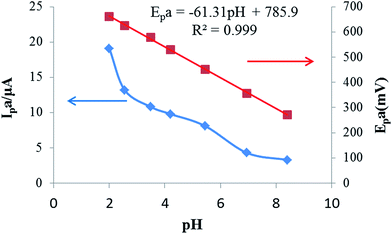 | ||
| Fig. 3 Effects of the pH value on the oxidation peak currents and peak potentials of 25 μmol L−1 rutin on the IL/DMC/PE. Scan rate: 50 mV s−1. | ||
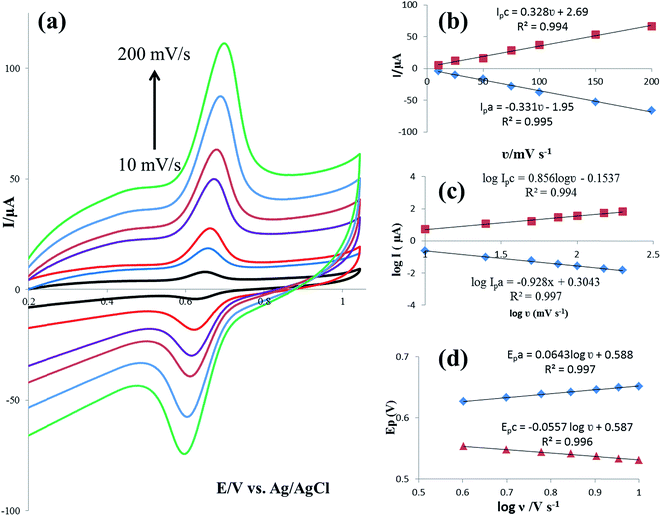
The effective surface area of the constructed electrodes was further examined by recording CVs of 1 mmol L−1 K3[Fe(CN)6] at different potential scan rates. The calculations were performed according to the Randles–Servick equation:48
| Ip = 2.69 × 10⁵AD1/2n3/2Cυ1/2 | (1) |
3.3. Study of experimental parameters
In order to calculate the electrochemical parameters, variation of the peak potentials with the logarithm of scan rate was further plotted according to the following Laviron's equations:50
 | (2) |
 | (3) |
 | (4) |
![[thin space (1/6-em)]](https://www.rsc.org/images/entities/char_2009.gif) log
log![[thin space (1/6-em)]](https://www.rsc.org/images/entities/char_2009.gif) υ (V s−1) (R2 = 0.996) and Epc (V) = 0.587 − 0.0557
υ (V s−1) (R2 = 0.996) and Epc (V) = 0.587 − 0.0557![[thin space (1/6-em)]](https://www.rsc.org/images/entities/char_2009.gif) log
log![[thin space (1/6-em)]](https://www.rsc.org/images/entities/char_2009.gif) υ (V s−1) (R2 = 0.997). Therefore, the values of α, n and ks were evaluated to be 0.53, 1.97, and 37.1 s−1, respectively. The obtained value of the electron transfer rate constant is higher than that of other reported ones,11,15 which indicates that the modified electrode effectively promotes the electron transfer between the substrate and the electrode.
υ (V s−1) (R2 = 0.997). Therefore, the values of α, n and ks were evaluated to be 0.53, 1.97, and 37.1 s−1, respectively. The obtained value of the electron transfer rate constant is higher than that of other reported ones,11,15 which indicates that the modified electrode effectively promotes the electron transfer between the substrate and the electrode.
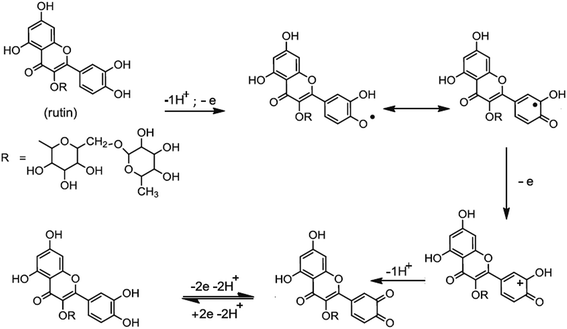
Based on the obtained experimental results and the literature reports,13–15 the mechanism of electro-oxidation for rutin is first a predissociation of a proton to form the monoanionic species, which is then oxidized to give a radical. The resulting radical rapidly undergoes a second electronic transfer to form a carbocation, which is rapidly dehydrated to yield the final product of 3′,4′-diquinone. The formed 3′,4′-diquinone is then reduced into rutin during the reverse scan (Fig. 5).
 | (5) |
3.4. Analytical figures of merit
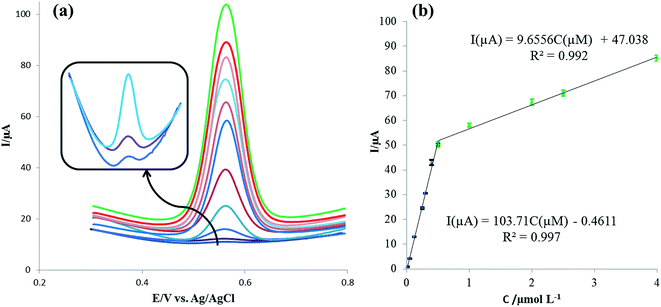
Square-wave voltammetry (SWV) was applied for the sensitive determination of rutin with the voltammograms of different rutin concentrations on the IL/DMC/PE as shown in Fig. 8a. Under the optimized experimental conditions, the oxidation signal of rutin increased linearly in the range of 0.008 μmol L−1 to 4.0 μmol L−1 with two linear segments (Fig. 8b). In the range from 0.008 to 0.5 μmol L−1 the linear regression equation was calculated as Ip (μA) = 103.71C (μmol L−1) − 0.4611 (R2 = 0.997) and in the range from 0.5 to 4.0 μmol L−1 the linear regression equation was obtained as Ip (μA) = 9.656C (μmol L−1) + 47.378 (R2 = 0.992). Moreover, the limit of detection was calculated to be 1.17 nmol L−1 at the signal to noise ratio of 3 (S/N = 3). The analytical parameters for the electrochemical detection of rutin using different electrodes are summarized in Table 1. As shown in the table, the presented method with a simple electrode preparation offered considerable improvement in terms of sensitivity. Also, a lower or comparable detection limit and reasonable linear range were obtained. These results indicated that the IL/DMC/PE is an appropriate platform for the sensitive detection of rutin.| Sensor | Linear range (μmol L−1) | Detection limit (nmol L−1) | Sensitivity (μA/μmol L−1) | Real sample | Ref. |
|---|---|---|---|---|---|
| GR-MnO2/CILE | 0.01–500 | 2.73 | 2.38 | Tablet | 11 |
| PAO-GR/CILPE | 0.03–800 | 8.33 | 9.53 | Tablet | 12 |
| Fe2O3/RGO/GCE | 0.015–18.0 | 9.8 | 14.36 | Tablet | 13 |
| YHCFNPs/CRGO/CPE | 0.002–4.0 | 0.82 | 11.1 | Tablet | 14 |
| PEDOT/GO/GC | 0.004–60.0 | 1.25 | 10.43 | Tablet | 15 |
| CueCS/MWCNT/GCE | 0.05–100.0 | 10.0 | 0.456 | Fruits | 16 |
| SMWCNT-PEDOT-IL | 1.0–14.0 | 77.0 | — | Black tea | 17 |
| GS/GCE | 0.010–1.25 | 3.2 | — | Chinese medicines | 18 |
| IL/DMC/PE | 0.008–4.0 | 1.17 | 103.7 | Ruta extract, orange juice, tablet | This work |
The relative standard deviation (RSD) of five sequential measurements of the response currents towards 0.05 μmol L−1 rutin with the same electrode was found to be about 2.5%, indicating the good repeatability of the presented sensor. The electrode to electrode reproducibility gave a satisfactory RSD value of 4.0% for the determination of 0.05 μmol L−1 rutin at five independently fabricated electrodes. Also, the long-term stability of the presented sensor was verified, since the oxidation current response for 0.1 μmol L−1 remained 95% of its initial value after one month storage under ambient conditions.
The effects of some potential interference that may be present in the herbal samples, in the determination of rutin were investigated. For this purpose, square-wave voltammograms of 0.05 μmol L−1 rutin in the absence and presence of various common interfering substances were recorded. The results indicated that 50-fold of K+, Na+, NO3−, anetole, ascorbic acid, cuminaldehyde, eugenol, and hydroquinone did not interfere the detection with the signal deviation below 10%. On the other hand, a 50-fold concentration of uric acid had a high influence impact on the voltammetric response of rutin. The obtained results indicated that the IL/DMC/PE might be suitable for the selective determination of rutin in real samples.
3.5. Real sample analysis
The applicability of the developed senor was tested by the determination of rutin content in different real samples, including Ruta graveolens extract, pharmaceutical tablets and orange juice. Table 2 lists the determination results with the recoveries obtained by the standard addition method. The recovery results of the electrochemical sensor were in the range from 99.8 to 104.9%. Also, the results obtained using the voltammetric method are comparable with those obtained from HPLC. It can be concluded that the proposed electrochemical sensor could be utilized for the reliable determination of rutin in real samples.| Sample | Voltammetric method | HPLC method | ||||
|---|---|---|---|---|---|---|
| Added (μM) | Found (μM) | Recovery (%) | RSD (%) | Added (μM) | Found (μM) | |
| Ruta graveolens extract | — | 0.0270 | — | 3.08 | — | 0.0284 |
| 0.020 | 0.0469 | 99.8 | 3.54 | |||
| 0.10 | 0.131 | 103.1 | 3.25 | |||
| Pharmaceutical tablet | — | 0.05 | — | 2.58 | — | 0.0491 |
| 0.02 | 0.0723 | 103.3 | 3.11 | |||
| 0.10 | 0.157 | 104.6 | 2.97 | |||
| Orange juice | — | 0.0115 | — | 2.87 | — | 0.0108 |
| 0.020 | 0.0330 | 104.8 | 3.69 | |||
| 0.10 | 0.117 | 104.9 | 4.25 | |||
4. Conclusions
In this study, a very simple and supersensitive sensor for the electrochemical determination of rutin based on a highly defective mesoporous carbon (DMC) and room temperature ionic liquid (BMIM·PF6) was developed. The synthesis of DMC was performed using sucrose as a carbon source, nanosilica as a hard template, and KNO3 as a defect causing agent. The modified paste electrode was fabricated by the mixing of graphite (35%), DMC (15%), BMIM·PF6 (10%) and mineral oil (40%). Taking the structural advantages of DMC and good conductivity of the IL, the proposed sensor exhibited unique electrochemical activity towards rutin. The electrochemical behavior of rutin on the surface of the modified electrode was carefully investigated with the electrochemical parameters calculated. The electrochemical process is quasi-reversible and presents the feature of an adsorption-controlled system. The proposed sensor exhibited excellent characteristics, such as high sensitivity, wide linear calibration range, low detection limit, long-term stability, simplicity and low cost. Finally, the developed sensor was successfully applied to the determination of rutin in different real samples including Ruta graveolens extract, pharmaceutical tablets and orange juice. Therefore, the excellent electrochemical performance of the IL/DMC/PE makes it a promising candidate for applications in the field of electrochemical sensors.Acknowledgements
This work was supported by Iranian Research & Development Center for Chemical Industries (IRDCI), and the authors gratefully acknowledge their financial support.References
- S. Kaur and A. Muthuraman, Life Sci., 2016, 150, 89–94 CrossRef CAS PubMed.
- A. Ganeshpurkar and A. K. Saluja, Saudi Pharm. J., 2016 DOI:10.1016/j.jsps.2016.04.025.
- R. Tian, W. Yang, Q. Xue, L. Gao, J. Huo, D. Ren and X. Chen, Eur. J. Pharmacol., 2016, 771, 84–92 CrossRef CAS PubMed.
- W. Q. Sun and J. F. Sheng, in Handbook of Natural Active Constituents, Chinese Medicinal Science and Technology Press, Beijing, 1998, p. 2240 Search PubMed.
- I. Erlund, T. Kosonen, G. Alfthan, J. Mäenpää, K. Perttunen, J. Kenraali, J. Parantainen and A. Aro, Eur. J. Clin. Pharmacol., 2000, 56, 545–553 CrossRef CAS PubMed.
- A. Kicel, A. Owczarek, P. Michel, K. Skalicka-Wózniak, A. K. Kiss and M. A. Olszewska, Ind. Crops Prod., 2015, 76, 86–94 CrossRef CAS.
- J. Magnuszewska and T. Krogulec, Anal. Chim. Acta, 2013, 786, 39–46 CrossRef CAS PubMed.
- H. Wu, M. Chen, Y. Fan, F. Elsebaei and Y. Zhu, Talanta, 2012, 88, 222–229 CrossRef CAS PubMed.
- Z. Legnerová, D. Šatínsky and P. Solich, Anal. Chim. Acta, 2003, 497, 165–174 CrossRef.
- A. Gong, W. Ping, J. Wang and X. Zhu, Spectrochim. Acta, Part A, 2014, 122, 331–336 CrossRef CAS PubMed.
- W. Suna, X. Wang, H. Zhu, X. Sun, F. Shi, G. Li and Z. Sun, Sens. Actuators, B, 2013, 178, 443–449 CrossRef.
- W. Sun, Y. Wang, S. Gong, Y. Cheng, F. Shi and Z. Sun, Electrochim. Acta, 2013, 109, 298–304 CrossRef CAS.
- Y. Wu, C. Hu, M. Huang, N. Song and W. Hu, Ionics, 2015, 21, 1427–1434 CrossRef CAS.
- S. Yang, G. Li, G. Wang, J. Zhao, Z. Qiao and L. Qu, Sens. Actuators, B, 2015, 206, 126–132 CrossRef CAS.
- K. Zhang, J. Xu, X. Zhu, L. Lu, X. Duan, D. Hu, L. Dong, H. Sun, Y. Gao and Y. Wu, J. Electroanal. Chem., 2015, 739, 66–72 CrossRef CAS.
- M. B. Gholivand, L. Mohammadi-Behzad and H. Hosseinkhani, Anal. Biochem., 2016, 493, 35–43 CrossRef CAS PubMed.
- E. Nagles and O. García-Beltrán, Food Anal. Methods, 2016, 9, 3420–3427 CrossRef.
- X. Yang, J. Long and D. Sun, Electroanalysis, 2016, 28, 83–87 CrossRef CAS.
- Y. Kim, J. Bae, H. Park, J. K. Suh, Y. W. You and H. Choi, Water Res., 2016, 101, 187–194 CrossRef CAS PubMed.
- J. Wang, H. L. Xin and D. Wang, Part. Part. Syst. Charact., 2014, 31, 515–539 CrossRef CAS.
- W. Xin and Y. Song, RSC Adv., 2015, 5, 83239–83285 RSC.
- N. Pal and A. Bhaumik, RSC Adv., 2015, 5, 24363–24391 RSC.
- W. Wang and D. Yuan, Sci. Rep., 2014, 4, 5711–5718 CAS.
- Y. Zhou, L. Tang, G. Zeng, C. Zhang, X. Xie, Y. Liu, J. Wang, J. Tang, Y. Zhang and Y. Deng, Talanta, 2016, 146, 641–647 CrossRef CAS PubMed.
- Y. Li, X. Zhai, X. Liu, L. Wang, H. Liu and H. Wang, Talanta, 2016, 148, 362–369 CrossRef CAS PubMed.
- Y. Yang, Y. Cao, X. Wang, G. Fang and S. Wang, Biosens. Bioelectron., 2015, 64, 247–254 CrossRef CAS PubMed.
- J. H. Zhong, J. Zhang, X. Jin, J. Y. Liu, Q. Li, M. H. Li, W. Cai, D. Y. Wu, D. Zhan and B. Ren, J. Am. Chem. Soc., 2014, 136, 16609–16617 CrossRef CAS PubMed.
- D. H. Lim and J. Wilcox, J. Phys. Chem. C, 2012, 116, 3653–3660 CAS.
- K. Kamiya, K. Hashimoto and S. Nakanishi, ChemElectroChem, 2014, 1, 858–862 CrossRef CAS.
- X. Fan, W. T. Zheng and J. L. Kuo, ACS Appl. Mater. Interfaces, 2012, 4, 2432–2438 CAS.
- D. Datta, J. Li and V. B. Shenoy, ACS Appl. Mater. Interfaces, 2014, 6, 1788–1795 CAS.
- P. C. Tsai, S. C. Chung, S. k. Lin and A. Yamada, J. Mater. Chem. A, 2015, 3, 9763–9768 CAS.
- D. Xu, J. Zhao and X. Wang, J. Nanopart. Res., 2013, 15, 1590–1599 CrossRef.
- M. M. Lucchese, F. Stavale, E. H. Martins Ferreira, C. Vilani, M. V. O. Moutinho, R. B. Capaz, C. A. Achete and A. Jorio, Carbon, 2010, 48, 1592–1597 CrossRef CAS.
- M. M. Ugeda, I. Brihuega, F. Guinea and J. M. Gómez-Rodríguez, Phys. Rev. Lett., 2010, 104, 096804–096811 CrossRef CAS PubMed.
- M. A. Hoefer and P. R. Bandaru, J. Appl. Phys., 2010, 1, 108–115 Search PubMed.
- N. Mohammadi, N. Bahrami Adeh and M. Najafi, RSC Adv., 2016, 6, 33419–33425 RSC.
- I. Svancara, K. Vytras, K. Kalcher, A. Walcarius and J. Wang, Electroanalysis, 2009, 7, 7–28 CrossRef.
- M. A. Mohamed, A. M. Yehia, C. E. Banks and N. K. Allam, Biosens. Bioelectron., 2016 DOI:10.1016/j.bios.2016.10.025.
- M. A. Mohamed, N. S. Abdelwahab and C. E. Banks, Anal. Methods, 2016, 8, 4345–4353 RSC.
- M. A. Mohammed, A. K. Attia and H. M. Elwy, Electroanalysis, 2016 DOI:10.1002/elan.201600311.
- K. Fan and J. Wu, Anal. Methods, 2013, 5, 5146–5153 RSC.
- Y. Ya, T. Wang, L. Xie, J. Zhu, L. Tang, D. Ning and F. Yan, Anal. Methods, 2015, 7, 1493–1498 RSC.
- J. Ren, J. Gu, L. Tao, M. Yao, X. Yang and W. Yang, Anal. Methods, 2015, 7, 8094–8099 RSC.
- S. Jun, S. H. Joo, R. Ryoo and M. Kruk, J. Am. Chem. Soc., 2000, 122, 10712–10713 CrossRef CAS.
- L. G. Cancado, A. Jorio, E. H. Martins Ferreira, F. Stavale, C. A. Achete, R. B. Capaz, M. V. O. Moutinho, A. Lombardo, T. S. Kulmala and A. C. Ferrari, Nano Lett., 2011, 11, 3190–3196 CrossRef CAS PubMed.
- M. Baikousi, A. B. Bourlinos, A. Douvalis, T. Bakas, D. F. Anagnostopoulos, J. Tuček and M. A. Karakassides, Langmuir, 2012, 28, 3918–3930 CrossRef CAS PubMed.
- A. J. Bard and L. R. Faulkner, in Electrochemical Methods–fundamentals and Applications, John Wiley and Sons, New York, 2000 Search PubMed.
- S. J. Konopka and B. McDuffie, Anal. Chem., 1970, 42, 1741–1746 CrossRef CAS.
- E. Laviron, J. Electroanal. Chem., 1979, 101, 19–28 CrossRef CAS.
- F. C. Anson, Anal. Chem., 1964, 36, 932–934 CrossRef CAS.
| This journal is © The Royal Society of Chemistry 2017 |

