 Open Access Article
Creative Commons Attribution 3.0 Unported Licence
Nanostructure of the H-terminated p-Si(111)/ionic liquid interface and the effect of added lithium salt†
Viktor
Hoffmann
a,
Abhishek
Lahiri
*a,
Natalia
Borisenko
*a,
Timo
Carstens
a,
Giridhar
Pulletikurthi
a,
Andriy
Borodin
a,
Rob
Atkin
b and
Frank
Endres
*a
aInstitute of Electrochemistry, Clausthal University of Technology, Arnold-Sommerfeld-Strasse 6, 38678 Clausthal-Zellerfeld, Germany. E-mail: abhishek.lahiri@tu-clausthal.de; natalia.borissenko@tu-clausthal.de; frank.endres@tu-clausthal.de
bPriority Research Centre for Advanced Fluids and Interfaces, Newcastle Institute for Energy and Resources, The University of Newcastle, Callaghan 2308, NSW, Australia
First published on 25th November 2016
Abstract
Ionic liquids are potential electrolytes for safe lithium-ion batteries (LIB). Recent research has probed the use of silicon as an anode material for LIB with various electrolytes. However, the nanostructure of the ionic liquid/Si interface is unknown. The present communication probes the hydrogen terminated p-Si(111) interface using atomic force microscopy (AFM) in 1-ethyl-3-methylimidazolium bis(trifluoromethlysulfonyl)amide ([EMIm]TFSA) and 1-butyl-1-methylpyrrolidinium bis(trifluoromethlysulfonyl)amide ([Py1,4]TFSA). AFM measurements reveal that the imidazolium cation adsorbs at the H-Si(111)/[EMIm]TFSA interface leading to an ordered clustered facet structure of ∼3.8 nm in size. In comparison, the Si(111)/[Py1,4]TFSA interface appeared the same as the native surface in argon. For both pure ILs, repulsive forces were measured as the tip approached the surface. On addition of LiTFSA attractive forces were measured, revealing marked changes in the interfacial structure.
Ionic liquids (ILs) are pure salts that are liquid at temperatures below 100 °C, typically formed from organic cations and anions. By changing the ion structures, the physicochemical properties as well as the electrochemical properties can be tuned.1–4 On account of their non-inflammability, wide electrochemical windows, low vapour pressures and good ionic conductivity, ILs are considered as potential electrolytes for safe lithium ion batteries.5–7 For batteries, the solid–electrolyte interface (SEI) plays an important role in both charge and mass transfer processes. It is therefore important to understand the IL/battery electrode SEI.
In most cases, multiple liquid layers are present at solid/IL interfaces, quite distinct from the double layer structure found in aqueous systems.4 In general, the IL interface can be classified into three zones: the innermost (Stern) layer, wherein the ion layer is in direct contact with the electrode surface; the bulk phase, where the degree of ion amphiphilicity plays a decisive role in the configuration of the bulk liquid region; and the transition zone between the innermost layer and the bulk phase.8 Addition of co-solvents9 or salts10 significantly affects the structure of solid/IL interfaces, and several studies have probed the effect of water on solid/IL interfaces.11–14 Amplitude modulated atomic force microscopy (AM-AFM) images have revealed the potential dependent structure of the highly oriented pyrolytic graphite (HOPG)/[EMIm]TFSA interface, and the effect of added Li+ and Cl− ions.15 The HOPG intercalation process of LiTFSA in N-methyl-N-propylpyrrolidinium bis(fluorosulfonyl)amide ([Py1,3]FSA) and in N-methyl-N-propylpiperidinium bis(trifluoromethylsulfonyl)amide ([Py1,3]TFSA) has been probed using in situ STM as a function of potential.16 It was found that in pure ionic liquids the cations intercalate the HOPG resulting in exfoliation of the HOPG layers. However, the presence of the FSA anion significantly suppressed the exfoliation process due to the formation of a protective layer. Spontaneous exfoliation of graphene from HOPG into IL solution has been imaged using AM-AFM.17
Recently, the Si(111)/IL interface was examined using X-ray scattering and reflection high energy electron diffraction (RHEED).18,19 X-ray scattering studies suggested crowding of IL ions on the Si(111) interface as the silicon roughness increased. Watanabe et al.19 reported a very low double layer capacitance (1.3 μF cm−2) for [EMIm]TFSA. RHEED investigations showed that H-terminated Si(111) retained its structure before and after heat treatment with the ionic liquid, which is consistent with ILs interacting weakly with Si(111) surfaces.
In this manuscript, soft contact20 AFM imaging is used to probe the hydrogen (H)-terminated p-Si(111) interface in [EMIm]TFSA and [Py1,4]TFSA at the open circuit potential (OCP). Along with AFM images, the interfacial structure is probed using force–distance profiles and infrared spectroscopy. The influence of added LiTFSA is also reported.
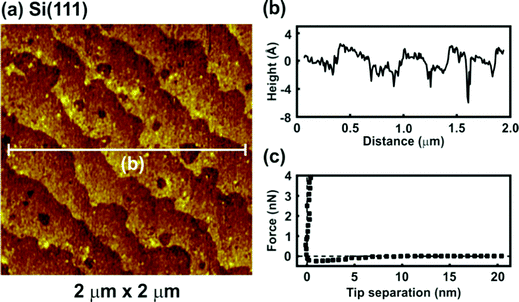
All images were obtained during soft contact AFM imaging by scanning from the bottom to the top of the image at a scan rate of 4 Hz and an image resolution of 256 pixels per line. The AFM topographic image of H-terminated p-Si(111) under argon is presented in Fig. 1. The pure H-Si(111) structure is characterized by large terraces (Fig. 1a) separated by steps of about 310 pm in height (Fig. 1b), which is in good agreement with the expected step height of 313 pm for the Si(111) double-layer periodicity. The terraces of the Si(111) surface are rather rough and zooming in shows that monolayer deep pits are present. Such pits are typical for hydrogen-terminated Si(111) due to the H-related states of the monohydride (SiH) and/or trihydride (SiH3) phases on Si(111).21,22 Furthermore, contaminations adsorbed during the wet treatment processes could also be present on the surface. The force versus separation curve for an AFM tip approaching the H-Si(111) surface reveals that in argon the jump-to-contact region is ascribed to a small attractive force due to van der Waals attractions between the tip and the surface (Fig. 1c).
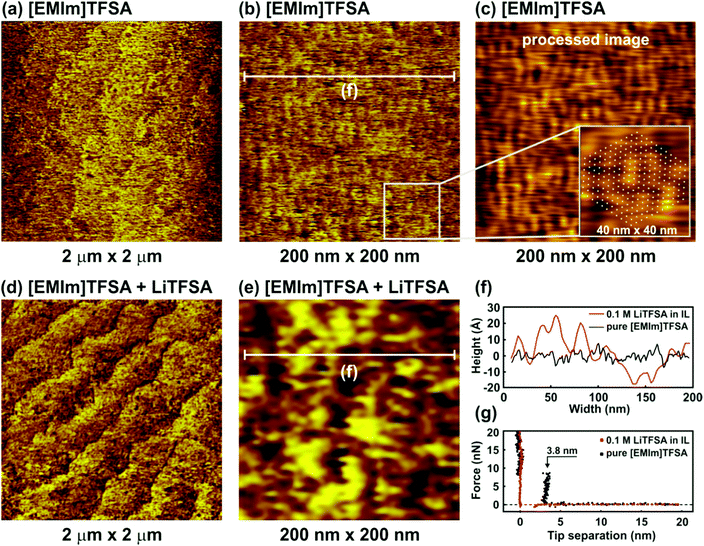
Fig. 2 shows the nanostructure of the IL/Si(111) interface in pure [EMIm]TFSA and in the presence of 0.1 M LiTFSA at the OCP. The terrace-like Si(111) structure can be recognized both in the case of the pure IL and in the presence of the Li salt (Fig. 2a and d). However, in general, the surface becomes very rough and the atomic steps cannot be distinguished clearly. Higher magnification 200 nm × 200 nm images of the terrace are presented in Fig. 2b and e. In the case of pure [EMIm]TFSA a periodic facet structure can be identified (Fig. 2b). To obtain a more pronounced periodic structure, the original topographic image was processed by Fast Fourier Transformation (FFT) with a threshold filter followed by an Inverse Fast Fourier Transformation (IFFT) to return a topographic image (Fig. 2c).
The processed image contains only periodic components with an amplitude larger than the selected threshold value of 0.007. The average width of each facet is about 3.7 nm (Fig. 2f, black curve), which is significantly larger than the dimensions of individual IL cations (0.3 nm) and anions (0.5 nm) and even that of an IL ion pair (0.8 nm). The obtained structure reproduces the subcell lattice of the Si(111) 7 × 7 surface reconstruction, which is shown in the 40 nm × 40 nm inset in Fig. 2c (white points). The force–separation profile reveals the existence of one adsorbed interfacial layer (Fig. 2g, black dots) with a width of about 3.8 ± 0.1 nm, which is similar to the spacing between facets in the AFM image. Furthermore, on continuous scanning, it is observed that the ordered structure is removed. However, the structure can be reobtained on imaging the same site after a while, which suggests that the clusters are not very strongly adsorbed to the H-terminated Si(111). For imidazolium ILs, nano-sized ordered domains have been shown experimentally using X-ray diffraction and transmission electron microscopy (TEM).23,24 Bovio et al.25 observed a solid like imidazolium ionic liquid layer on oxidized Si(110) with a lateral dimension of 1–20 μm and a height of above 50 nm. From TEM, clusters of 2–5 nm size were observed particularly on the holes of the carbon nanotubes and were related to the carbon nanotube surface induced ordering mechanism.24 Therefore, in the case of H-Si(111), the H-termination might have induced ordering of imidazolium IL by van der Waals interaction19 and suggests a structure formed from many ions or ion pairs. On addition of 0.1 M LiTFSA, the facet structure disappears completely (Fig. 2e) and the surface becomes rougher (Fig. 2f, red curve), meaning that the image quality decreases (zooming in did not improve clarity). No push throughs are found in the force–distance profiles, which means that the rough “layer” interacts weakly with the surface (Fig. 2g, red dots). These results show that the addition of LiTFSA disrupts interactions between the surface and the IL, which weakens the interfacial structure significantly, which is consistent with earlier reports.10
To evaluate interactions between the ILs and H-terminated Si(111), infrared spectroscopy in an attenuated total reflectance (ATR) mode was performed. The IR spectrum of the H-Si(111) substrate does not reveal any specific peaks. However, if the thin layer of the IL is placed onto the substrate, a well-known multi-phonon absorption spectrum of silicon is obtained26,27 in the case of both the [Py1,4]TFSA and [EMIm]TFSA ionic liquids (Fig. S1, ESI†). In general, the IR spectra of confined ILs are different from those of the bulk.28,29 The IR spectra of [EMIm]TFSA and of a thin film of [EMIm]TFSA on H-Si(111) in the ranges of 1000–1400 cm−1 and 2700–3200 cm−1, where the differences were observed, are shown in Fig. 3a and b, respectively.
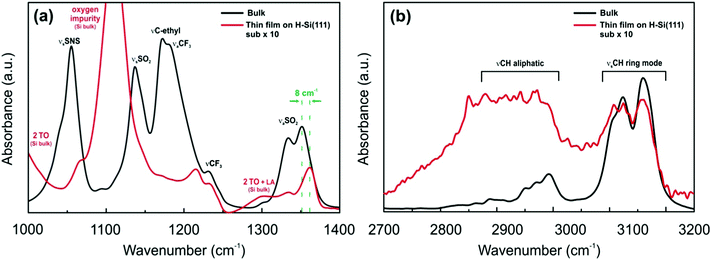 | ||
| Fig. 3 FTIR spectra of [EMIm]TFSA (black line) and [EMIm]TFSA on H-Si(111) (red line) (a) between 1000 and 1400 cm−1 wavenumbers and (b) between 2700 and 3200 cm−1 wavenumbers. | ||
The spectrum of a [EMIm]TFSA thin film on H-Si(111) is completely different to its corresponding bulk spectrum. The intensities of SNS, νsSO2, and νC–C of the ethyl group and νaCF3 are drastically reduced to ∼10%. Furthermore, the asymmetric stretching mode of SO2 at 1353 cm−1 is blue shifted by ∼8 cm−1 (Fig. 3a). In the case of the cation the intensities of the peaks between 2700 and 3200 cm−1 decrease and an additional broad wave between 2800 and 3000 cm−1 (Fig. 3b) occurs which indicates a possible interaction of the IL cation with the H-terminated Si(111) surface. This might be due to the interaction with the C2(H) proton of the 1,3-dialkylimidazolium ring and H-Si(111). The presented IR results reveal that there is an interaction between IL ions and the H-Si(111) surface, which leads to the formation of the ordered facet structure present in the AFM images.
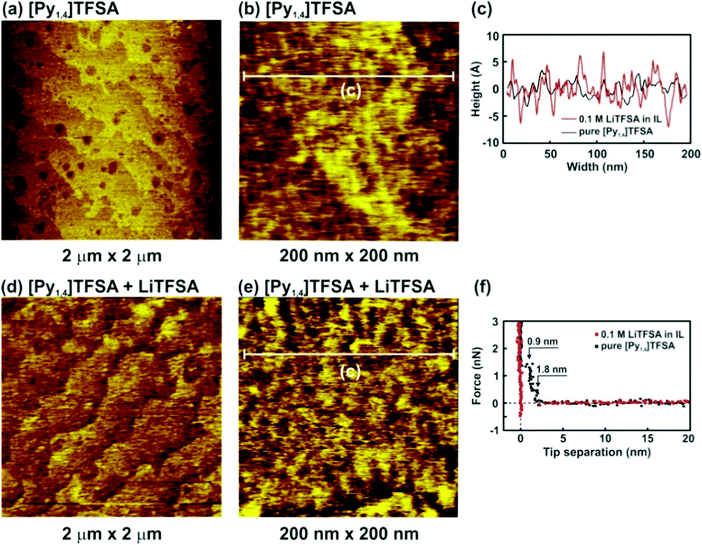
Fig. 4 presents the nanostructure of the IL/H-Si(111) interface in pure [Py1,4]TFSA and in the presence of 0.1 M LiTFSA at the OCP. In the case of pure [Py1,4]TFSA a typical terrace-like Si(111) structure with a step height of 310 nm is obtained (Fig. 4a). However, a higher magnification image shows that a rough layer is present on the surface of the terraces (Fig. 4b and c, black curve). The force–separation profile reveals the presence of two interfacial layers at 1.8 nm and 0.9 nm (Fig. 4f, black dots), which corresponds well with the diameter of the IL ion pair (0.8 nm). The interfacial layers of [Py1,4]TFSA are weaker than for [EMIm]TFSA (∼9 nN), and only ∼1.5 nN force is needed to rupture the innermost layer. The quality of the images decreases significantly with addition of 0.1 M LiTFSA (Fig. 4d). The roughness of the “layer” that is present on the surface increases (Fig. 4e and c, red curve). As for LiTFSA the force–separation profile does not reveal the existence of any interfacial layers (Fig. 4f, red dots).
The [Py1,4]TFSA/H-Si(111) interface was also evaluated by IR spectroscopy. Fig. 5 compares the IR spectra of bulk [Py1,4]TFSA and a thin film of [Py1,4]TFSA on H-Si(111). The intensities of the anion and cation peaks are drastically reduced to ∼10% if a thin layer of the IL is placed onto the substrate. Similar to [EMIm]TFSA, the asymmetric stretching mode of SO2 at 1353 cm−1 is also blue shifted by ∼6 cm−1 (Fig. 5a). In the region between 2700 and 3100 cm−1 an additional peak at 2852 cm−1 is observed that can be related to the interaction between the H-termination of Si(111) with the [Py1,4] cation. In situ AFM force–distance profiles show that in the case of [Py1,4]TFSA only ∼1.5 nN force is required to remove the innermost layer from the surface compared to ∼9 nN force for [EMIm]TFSA. This also signifies that the interaction of [Py1,4]TFSA is much weaker compared to [EMIm]TFSA.
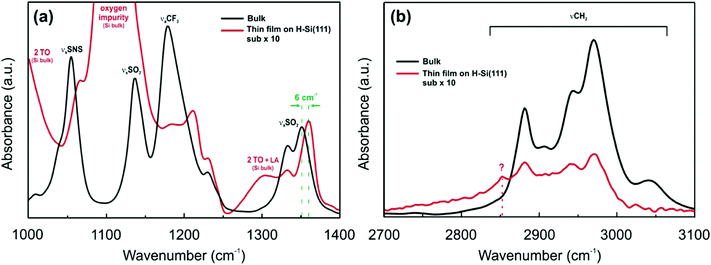 | ||
| Fig. 5 FTIR spectra of [Py1,4]TFSA (black line) and [Py1,4]TFSA on H-Si(111) (red line) (a) between 1000 and 1400 cm−1 wavenumbers and (b) between 2700 and 3100 cm−1 wavenumbers. | ||
In conclusion, the AFM results show that the IL/H-Si(111) interface is complex and depends on the IL cation structure. In the case of [EMIm]TFSA, an ordered structure with a lateral dimension of 3.8 nm was present at the H-Si(111) surface, which is much greater than the dimension of the IL cation, anion, or ion pair. IR spectra reveal a strong interaction, and probably a structural change, between [EMIm]+ and the H-Si(111) surface. Force–distance profiles reveal that the interfacial structures are much stronger for [EMIm]TFSA than for [Py1,4]TFSA: 9 nN is needed to rupture the innermost layer in [EMIm]TFSA, while only 1.5 nN is required to push through the innermost layer in [Py1,4]TFSA. The addition of 0.1 M LiTFSA weakens the interfacial nanostructure. In general, both AFM and IR results reveal that some unusual interactions take place between the cation of the IL and H-Si(111) which requires further studies.
Acknowledgements
The authors would like to thank Mrs Karin Bode, Institute of Inorganic Chemistry (Prof. A. Adam), for help with IR measurements. This research was supported by DFG EN 370/25-1. RA acknowledges the Australian Research Council for a Future Fellowship.References
- H. Tokuda, K. Hayamizu, K. Ishii, M. Abu Bin Hasan Susan and M. Watanabe, J. Phys. Chem. B, 2004, 108, 16593–16600 CrossRef CAS.
- H. Tokuda, K. Hayamizu, K. Ishii, M. Abu Bin Hasan Susan and M. Watanabe, J. Phys. Chem. B, 2005, 109, 6103–6110 CrossRef CAS PubMed.
- S. Zhang, N. Sun, X. He, X. Lu and X. Zhang, J. Phys. Chem. Ref. Data, 2006, 35, 1475–1517 CrossRef CAS.
- R. Hayes, G. G. Warr and R. Atkin, Chem. Rev., 2015, 115, 6357–6426 CrossRef CAS PubMed.
- M. Armand, F. Endres, D. R. MacFarlane, H. Ohno and B. Scrosati, Nat. Mater., 2009, 8, 621–629 CrossRef CAS.
- A. Lewandowski and A. Świderska-Mocek, J. Power. Sources, 2009, 194, 601–609 CrossRef CAS.
- M. Galinski, A. Lewandowski and I. Stepniak, Electrochimica Acta, 2006, 51, 5567–5580 CrossRef CAS.
- R. Hayes, S. Imberti, G. G. Warr and R. Atkin, Phys. Chem. Chem. Phys., 2011, 13, 3237–3247 RSC.
- A. Elbourne, S. Cronshaw, K. Voitchovsky, G. G. Warr and R. Atkin, Phys. Chem. Chem. Phys., 2015, 17, 26621–26628 RSC.
- R. Hayes, N. Borisenko, B. Corr, G. B. Webber, F. Endres and R. Atkin, Chem. Commun., 2012, 48, 10246–10248 RSC.
- T. Cui, A. Lahiri, T. Carstens, N. Borisenko, G. Pulletikurthi, C. Kuhl and F. Endres, J. Phys. Chem. C, 2016, 120, 9341–9349 CAS.
- H.-W. Cheng, P. Stock, B. Moeremans, T. Baimpos, X. Banquy, F. U. Renner and M. Valtiner, Adv. Mater. Inter., 2015, 2, 1500159 CrossRef.
- K. Sakai, K. Okada, A. Uka, T. Misono, T. Endo, S. Sasaki, M. Abe and H. Sakai, Langmuir, 2015, 31, 6085–6091 CrossRef CAS PubMed.
- Z. Wang, H. Li, R. Atkin and C. Priest, Langmuir, 2016, 31, 8818–8825 CrossRef PubMed.
- A. Elbourne, S. McDonald, K. Voïchovsky, F. Endres, G. G. Warr and R. Atkin, ACS Nano, 2015, 9, 7608–7620 CrossRef CAS PubMed.
- X. Hu, C. Chen, J. Yan and B. Mao, J. Power. Sources, 2015, 293, 187–195 CrossRef CAS.
- A. Elbourne, B. McLean, K. Voïchovsky, G. G. Warr and R. Atkin, J. Phys. Chem. Lett., 2016, 7, 3118–3122 CrossRef CAS PubMed.
- M. Chu, M. Miller and P. Dutta, ACS Cent. Sci., 2016, 2, 175–180 CrossRef CAS PubMed.
- K. Watanabe, S. Maruyama and Y. Matsumoto, Chem. Phys. Lett., 2016, 655–656, 6–10 CrossRef CAS.
- H. N. Patrick, G. G. Warr, S. Manne and I. A. Aksay, Langmuir, 1997, 13, 4349–4356 CrossRef CAS.
- Y. Morita, K. Miki and H. Tokumoto, Jpn. J. Appl. Phys., 1991, 30, 3570–3574 CrossRef CAS.
- M. Kageshima, H. Yamada, Y. Morita, H. Tokumoto, K. Nakayama and A. Kawazu, Jpn. J. Appl. Phys., 1993, 32, L1321–L1323 CrossRef CAS.
- A. Triolo, O. Russina, H.-J. Bleif and E. Di Cola, J. Phys. Chem. B, 2007, 111, 4641–4644 CrossRef CAS PubMed.
- S. Chen, K. Kobayashi, R. Kitaura, Y. Miyata and H. Shinohara, ACS Nano, 2011, 5, 4902–4908 CrossRef CAS PubMed.
- S. Bovio, A. Podesta, C. Lenardi and P. Milani, J. Phys. Chem. B, 2009, 113, 6600–6603 CrossRef CAS PubMed.
- F. A. Johnson, Proc. Phys. Soc., 1959, 73, 265–272 CrossRef CAS.
- M. M. Pradhan, R. K. Garg and M. Arora, Infrared Physics, 1987, 27, 25–30 CrossRef CAS.
- F. Shi and Y. Deng, Spectrochim Acta., 2005, 62, 239–244 CrossRef PubMed.
- O. Höfft, S. Bahr and V. Kempter, Langmuir, 2008, 24, 11562–11566 CrossRef PubMed.
Footnote |
| † Electronic supplementary information (ESI) available: Experimental and sample preparation. See DOI: 10.1039/c6cp06306c |
| This journal is © the Owner Societies 2017 |

