Electrode–particle impacts: a users guide
Stanislav V.
Sokolov
,
Shaltiel
Eloul
,
Enno
Kätelhön
,
Christopher
Batchelor-McAuley
and
Richard G.
Compton
*
Department of Chemistry, Physical and Theoretical Chemistry Laboratory, Oxford University, South Parks Road, Oxford OX1 3QZ, UK. E-mail: richard.compton@chem.ox.ac.uk
First published on 22nd November 2016
Abstract
We present a comprehensive guide to nano-impact experiments, in which we introduce newcomers to this rapidly-developing field of research. Central questions are answered regarding required experimental set-ups, categories of materials that can be detected, and the theoretical frameworks enabling the analysis of experimental data. Commonly-encountered issues are considered and presented alongside methods for their solutions.
1 Introduction
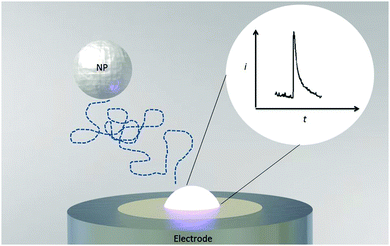
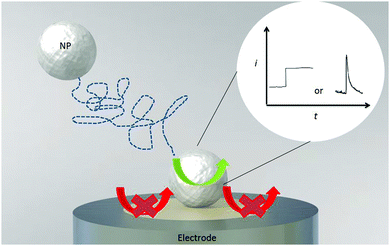
The nano-impact method is a powerful tool that enables the characterisation of individual particulate nano-objects in solution and study of their reactivity. During a typical experiment an electrode under potential control is immersed into a solution containing a freely-diffusing analyte. By virtue of their Brownian motion, the analyte particles (often nanoparticles) will stochastically collide with and impact on the electrode surface where they may for instance adsorb, react, or enable a catalytic reaction. The presence of the analyte can then be recognised in the electrode current and properties of the analyte particle population may be extracted from the measurement.1–6The general experimental setup for most types of impact experiments involves a three electrode system with a working electrode of micron dimensions (typically an embedded microdisc) held at a potential at which the reaction of interest takes place, an inert counter electrode and a reference electrode (typically a Saturated Calomel Electrode7 (SCE) in aqueous solutions). Supporting electrolyte is used to improve the conductivity of the solution and to compress the double layer at the electrode.8,9 Consequently, the interfacial electric field is confined to within close proximity to the electrode. Current transients are recorded and characteristic ‘spikes’ (blips) or ‘steps’ are observed as a result of collisions of diffusing analyte particles at the electrode. The technique has been applied to a wide range of entities ranging from inorganic/organic nanoparticles10–18 to complex structures such as viruses,19,20 bacteria21,22 and red blood cells.23 In addition voltammograms can be recorded at single particles as demonstrated by Li et al. for the case of hydrogen oxidation on palladium functionalised carbon nanotubes.24
A number of overviews of recent advances in nanoparticle electrochemistry1–4 are available. The present work is intended to complement the excellent review5 by Rees et al. in PCCP with the main aim of highlighting relevant theoretical models, addressing experimental challenges, and providing a guide to experiment design. Initially we describe different types of experimental systems, after which we discuss the theoretical modeling of diffusive nanoparticle transport to an electrode. We then proceed with a discussion of various design features of the experimental set-up, including particle characterization tools, potentiostat requirements, types of electrodes, and the choice of the supporting electrolyte. The final sections provide examples of the systems that have been investigated to date and by an outlook on the future of this promising research field.
1.1 Type of impacts
Modern nano-impact experiments are based on pioneering experiments by Micka25 in Prague as early as 1956 who used mercury electrodes to study insoluble HgS, PbS, CuS and Ag2O particles suspended in water. Micka observed a cathodic peak in a classic damped polarographic wave in a stirred solution which was due to multiple simultaneous collisions of the particles. An example of such polarogram is shown in Fig. 1 and corresponds to the reduction of multiple colliding HgS particles in a stirred solution. Similar observations were later made by Jones and Kaye,26 who investigated the undamped response and observed large, sharp current spikes as a result of multiple simultaneous collisions of carbon particles taking place. The observed undamped polarogram is shown in Fig. 2.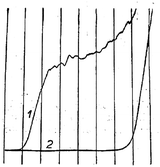 | ||
| Fig. 1 Damped polarograms of HgS particles in solution as recorded by Micka,25 (1) stirred solution (2) unstirred solution. | ||
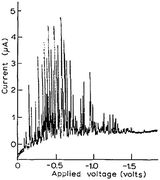 | ||
| Fig. 2 Undamped polarogram of a stirred suspension of 0.01% activated charcoal in 0.1 M KCl solution as recorded by Jones and Kaye.26 | ||
Practical applications of electrode particle electrochemistry were introduced by Moller in 197127 and further advanced by Holland and Feinerman, who developed a device which involved a turntable holding immobilized silver bromide particles and a platinum needle electrode. The turntable was rotated slowly and upon contact with the electrode, silver bromide particles were reduced, thereby allowing the grain size to be determined.28,29 This equipment found significant use in the photographic industry for the characterisation of micron and sub-micron sized AgBr particles. Fig. 3 shows the particle size analyzer device developed and the electrode mount. It is insightful to note that the authors discussed the possibility of studying silver particles using the same technique by reversing the polarity of the electrode.28 Almost 25 years passed before further developments took place. Heyrovsky et al. again in Prague conducted polarographic experiments using particles of TiO2, SnO2 and Fe2O3 and observed the ensemble current response arising from the catalytic reduction of H+ at impacting particles.30–33 In contrast recent work has focused on studying the response of single particle collisions.
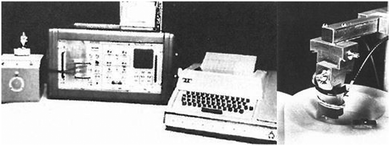 | ||
| Fig. 3 Automatic particle size analyzer for AgBr particles as designed by Holland and Feinerman.28 | ||
Electrode/particle collisions are herein classified into four broad categories depending on the reaction taking place: direct Faradaic, mediated Faradaic, capacitive, and blocking impacts. Various impact events are capable of providing diverse specific information regarding the nature of the impacting particle, the kinetics of the electron transfer,34,35 and the catalytic activity of a given particle. However, in order to understand the nature of relevant physiochemical processes in nano-impacts it is essential to consider the effects of the double layer, the charge transfer mechanisms, and the surface reactions involving the impacting particles. We first provide an overview of the types of impacts by comparing and contrasting capacitive and direct Faradaic impacts, before we proceed to discuss mediated Faradaic and blocking impacts.
| AgN − Ne− → NAg+ | (1) |
If the particle is oxidized (or reduced) completely, then the integral of the current passed during an impact event gives the overall charge transferred, which allows the number of silver atoms contained within a particle to be measured. Typical dissolution behavior is observed for metallic nanoparticles such as silver,37 gold,38,39 nickel40,41 and copper,42 while in other cases the particle can be converted to water soluble compounds (for example reduction of indigo to leuco-indigo13). Assuming the density of the material is not significantly altered from that of the bulk then the particle's individual volume can be directly evaluated. Under the assumption of spherical geometry this allows the effective radius of the particle to be ascertained:
 | (2) |
2 Theory
Experimental data acquired in nano-impact experiments reflects the complex interplay of various physical effects, which most significantly include the particle's mass transport, its charge transfer characteristics at the electrode, and the effect of the employed analogue and digital measurement equipment. Understanding the influence of these key factors is crucial for interpretation of experimental data. In the following we separately review the underlying physical concepts. We commence the section with a discussion of the relevant mass transport mechanisms and an introduction to the most significant theoretical models thereof. These models are then further elucidated from a statistical physics point of view, where we investigate the mass transport with respect to first passage statistics to provide guidelines to experimentalists: in sensing applications, nano-impact experiments can, for instance, be used to determine the concentration of an analyte in solution counting the number of observed impacts in a defined time interval. Since this measured number is non-trivially linked to the mass transport model and subject to stochastic fluctuations, we herein provide look-up tables that immediately link both the analyte concentration and the number of observed impacts for common experimental conditions. Subsequently, we briefly discuss the influence of analogue laboratory equipment on measured data and elucidate related challenges and opportunities in the analysis of spike shapes in chronoamperometric measurements.2.1 Mass transport
Nano-impact experiments are typically carried out in solutions with high electrolyte concentrations. This is mainly due to two reasons: on the one hand, such electrolyte concentrations elevate the conductivity of the solution to a level that allows good coupling between the solution- and the reference potential throughout the entire bulk. On the other hand, the electrolyte enables the formation of double layers near charged surfaces, which establishes the sharp potential drop at the charged electrode that is required to drive the chemical reactions during the impact. In addition, the formation of double layers effectively screens all electric fields in solution, which crucially influences the mass transport of nano-scaled analytes in the nano-impact method: though the freely-diffusing analyte may frequently be located near charged surfaces, it is not affected by electromigration forces as double layers typically feature thicknesses of only a few Ångströms, if high electrolyte concentrations are present. Furthermore, the influence of convection is negligible in many nano-impact experiments and can be neglected to good approximation. This approximation is on the one side due to the small size of the system and on the other due to the only small change in the density of the analyte during the reaction. Hence, the mass transport of the analyte often does not require solving Nernst–Planck– and Navier–Stokes equation but can be fully described by the diffusion equation | (3) |
 the position at which c is evaluated, and Dij is the tensor of the diffusion coefficient. For the case of isotropic diffusion, i.e. the diffusion characteristics do not change with the direction of the diffusion and the diffusion coefficient is independent from the diffusing object's position, eqn (3) simplifies to the more commonly known form:
 | (4) |
 | (5) |
 | (6) |
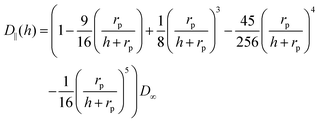 | (7) |
Once found on the basis of eqn (3) or (4), the mass transport equations can be solved via a variety of analytical, computational, and Monte–Carlo methods. Among these analytical approaches as well as computational methods are commonly employed, while particularly finite differences and finite elements are prominent as they provide robust computational tools for this purpose. The modeling of a systems stochastic properties such as its noise characteristics or the first passage statistics of an individual diffusing entity may however be challenging if investigated via analytical approaches, finite differences, or finite elements: in all methods time-dependent concentration profiles are determined, which represent the probability of finding one or multiple diffusing objects at a certain position and time rather than an actual position. While this is acceptable for most electrochemical experiments,9 in single-analyte methods like nano-impacts it is however generally more desirable to model actual analyte pathways to answer questions like: ‘When does the nanoparticle reach the electrode for the first time and what is the related variance?’ or ‘A certain number of nanoparticles were detected in a given time interval. What is their concentration in solution?’. Stochastic information on individual objects may however not be readily available from solutions to the mass transport equations. For this reason, stochastic modeling via random walks62–64 has received growing attention in recent years and turned out to be a particularly useful tool in nano-impacts.65 Rather than concentrations profiles, this computational technique models each object's diffusive pathway individually in accordance to eqn (3) or (4). By this means, sets of obtained pathways can be analysed statistically and the desired stochastic information is revealed.
2.2 Predicting the number of impacts
Modeling the above mass transport equations enables the prediction of the number of impacts or the average frequency of impacts observed in the experiment. The size and type of the electrode, the analyte concentration, the particles size of interest, and the duration of the experiment are herein all parameters that can be optimised to allow the detection of the particle of interest with statistical significance. The number of impacts as function of time then provides valuable information on the transport of the particles to the electrode and can give insight into other processes that may affect the flux towards the electrode such as aggregation, dispersion of the particles, blockage of the electrode, and compete adsorption.As discussed above, the main mechanism of particle transport in a conventional experiment is diffusion, and therefore the prediction of the number of impacts or the average impact frequency can be first estimated through calculating the diffusion rate towards an electrode for the case of fully dispersed particles.
Microdisc electrodes. The frequency of impacts can be evaluated from the diffusive flux to a finite disc electrode. Saito found the steady-state flux towards a disc electrode to be:67
| J(t → ∞) = 4Dc*rd | (8) |
| J = 4Dc*rdf(τ) | (9) |
f(τ) = 0.7854 + 0.8862τ−1/2 + 0.2146![[thin space (1/6-em)]](https://www.rsc.org/images/entities/char_2009.gif) exp(−0.7823τ−1/2) exp(−0.7823τ−1/2) | (10) |
| τ = 4Dt/rd2 | (11) |
Following that, the number of impacts as a function of time can be estimated by the integration of the diffusive flux towards a disc with respect to t:
![[N with combining circumflex]](https://www.rsc.org/images/entities/i_char_004e_0302.gif) impacts(t) = c*rd3F(τ) impacts(t) = c*rd3F(τ) | (12) |
 | (13) |
| (a) Disc radius | 0.5 μm | 3.5 μm | 16.5 μm |
|---|---|---|---|
| Particle radius (nm) | No. of impacts (non-hindered/hindered) | ||
| 5 | 5.93/5.01 | 42.8/42.18 | 228.61/228.5 |
| 25 | 1.19/0.65 | 8.94/7.16 | 54.2/53.1 |
| 50 | 0.6/0.23 | 4.61/3.63 | 30.27/28.23 |
| 150 | 0.2/0.036 | 1.66/0.89 | 12.68/10.07 |
| 300 | 0.1/0.01 | 0.89/0.32 | 7.54/7.27 |
| 500 | 0.06/0.003 | 0.57/0.14 | 5.19/4.78 |
| 1000 | 0.03/0.001 | 0.32/0.043 | 3.12/0.91 |
| (b) Wire radius | 1.5 μm | 3.5 μm |
|---|---|---|
| Particle radius (nm) | No. of impacts (non-hindered/hindered) | |
| 5 | 4848/4751 | 7003/6966 |
| 25 | 1224/1184 | 1957/1905 |
| 50 | 687/635 | 1150/1093 |
| 150 | 285/217 | 512/436 |
| 300 | 166/99.1 | 316/226 |
| 500 | 136/50.5 | 224/127 |
| 1000 | 100.6/17.7 | 144/50 |
| J(t) = πDc*lf(τ) | (14) |
 | (15) |
![[N with combining circumflex]](https://www.rsc.org/images/entities/i_char_004e_0302.gif) impacts(t) = 2πc*lrc2F*(τ), τ = Dt/rc2 impacts(t) = 2πc*lrc2F*(τ), τ = Dt/rc2 | (16) |
 | (17) |
 | (18) |
 .71 By setting the equations for number of impacts (eqn (12) and (16)) to unity
 ![[N with combining circumflex]](https://www.rsc.org/images/entities/i_char_004e_0302.gif) impacts(t) = 1, the variance and the standard deviation are hence equally unity.66 This value can provide a practical estimation of the minimum required time for detection for a given set of experiments parameters, which is highly relevant in dilute solutions in the fM region, large particle sizes, and small electrodes below one micrometre.
impacts(t) = 1, the variance and the standard deviation are hence equally unity.66 This value can provide a practical estimation of the minimum required time for detection for a given set of experiments parameters, which is highly relevant in dilute solutions in the fM region, large particle sizes, and small electrodes below one micrometre.
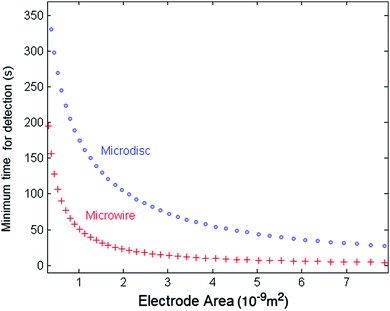
We can compare the minimum detection time of the two types of electrodes, the wire and the disc electrode, by plotting the minimum detection time as a function of the electrode area. Fig. 7 shows the results for a 10 fM solution as a representative case for very dilute solutions. The thickness of the microwire is fixed to a representative value of 1 μm whilst the length (l) varies with the areas. The lower values for the micro-wire electrode show the possible advantage of using microwires in experiments at ultra-low concentrations and large nanoparticles. Additionally, in the case of ultra-dilute solution of 1 fM concentration of 25 nm particles, a microwire electrode featuring a length of 1 mm and a radius of 1 μm gives a minimum time for detection of approximately 90 s. However, for a microdisc electrode that has the same total surface area of 6.28 × 10⁻⁹ m2 (radius of a disc set to 44.7 μm), an impractical value of approximately 660 s is calculated.
The calculation of heterogeneous diffusion in typical cells often employed for impact studies has been detailed in recent works for the case of a wire electrode and for two-dimensional anisotropic diffusion towards a microdisc73 (see also the diffusion coefficient expressed by eqn (6) and (7)). The diffusion problem can be solved using numerical analysis tools and requires careful modeling and convergence tests.73 However, for the convenience of the experimental researcher, we have calculated the number of impacts expected for the case of a standard concentration of 1 pM and various sizes of common electrode discs (Table 1a) and micro-wire electrodes (Table 1b). The results are shown in Table 1 where they are additionally compared to the calculations without hindered diffusion. It shows that when the ratio of particle- to the electrode size (rp/rd) increases, hindered diffusion becomes more dominant and the number of impacts decreases. The data in the table shows the case of a 1 pM concentration, but can be scaled to include other concentrations. The time can be also approximated by a linear scaling to give a reasonable estimate of the number of impacts in various experiments. The wire results consider a 1 mm wire length but can be scaled as well to cover various wire lengths.
Although the results give a good estimation of the number of impacts expected for diffusive mass transport, in many cases the number of impacts observed in experiments can vary due to various physical reasons. Agglomeration of particles, possible blocking of the electrode, adsorption on the insulating sheath of a microdisc electrode, migration, and convection are all factors that have been shown to have a significant influence on the prediction of the number of impacts in certain systems and should therefore be considered in the interpretation of experimental data. These possible effects are discussed further in Section 3.
 | (19) |
Since the steady state flux towards a disc is given by:
| I = 4Fc*Drd | (20) |
 | (21) |
2.3 Analysis of current signals
We have seen that in nano-impact experiments, the analyte concentration can be estimated from the frequency of impacts measured, if first passage times are evaluated on the basis of the respective mass transport equations. Aside from that, is there other information that can be extracted from experimental data? Various physiochemical aspects of the impact process are reflected in the measured current spike shape, though they may be masked by the instrument function. The following section first addresses the topic of spike shapes, before the influence of analogue laboratory equipment on the spike shape is investigated.• Dissolution
A common type of nano-impact experiments is the detection of particles that dissolve upon impacting at the electrode, where the adopt the electrode potential and an electro-dissolution process of the formerly stable nanoparticle is enabled. The charge transfer at the electrode is then determined by the propagation of dissolution process, which can either be diffusion- or electron transfer rate-limited. Recent theoretical work76 established and solved related differential equations, which allow the analytical description of expected the spike shape and size.
• Mediated processes
Mediated impacts enable a catalytic reaction between the electrode and analyte in solution, which does not react with the electrode itself, and result in a pulse- or step-like current responses. The duration of the spikes then reflects the residence time of the particle within the tunneling-distance of the electrode, while the spike height provides insight into the particle's catalytic activity: this activity is often limited by the diffusion of analyte towards the particle and the step height can hence be determined by solving the respective mass transport equations. Solutions can be achieved analytically77 or computationally,78 providing the following expression for the steady-state current to a sphere on a flat substrate:
| Ilim = 8.71nFDrc* | (22) |
• Electro-doping
A recent technique80 is the electrochemically-driven doping of individual impacting nanoparticles. Herein, the charge transfer between the nanoparticle and the electrode is not determined by diffusion of the analyte in solution but by the mass transport of doping ions inside the nanoparticle, which releases a discrete amount of charge to the electrode for each ion entering it. As the nanoparticle only features a limited uptake capacity and ions may enter or leave the particle at high rates, the current response of the electrode can be modeled on the basis of the mass transport equations of ions inside the nanoparticle, yielding an analytical solution for the spike shape.80
• Surface diffusion
Another rate-determining aspect of the charge transfer between the electrode and the impacting nanoparticle may be the charge diffusion on the particle surface. This is for instance observed at impacting alumina particles modified with catechol, where the reaction rate is determined by the charge diffusion through the layer of adsorbed catechol molecules since the particle itself is insulating.81 The spike shape can then be analytically described by solving the mass transport equations for diffusion on a sphere, which provides a current transient that greatly matches experimental data. Aside from diffusion on a sphere, related equations can be solved for a number of other relevant geometries as recently demonstrated by Eloul and Compton in a computational study.82
The influence of the electronic circuitry on the measured signal can be conveniently characterised via the system's transfer function H, which links the time-dependent input signal x(t) and the circuitry's output signal y(t) as follows:83
 | (23) |
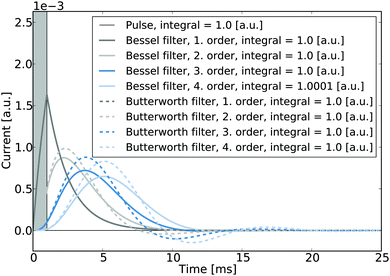
It is noted that in the context of nano-impact experiments the choice of certain filter types may often be advantageous if the spike integrals are of interest: if for instance Bessel- or Butterworth type filters are used, though the spike shape may be altered significantly, the integral of the spike is nonetheless conserved and can be readily used to determine the size distribution of a particle population if the charge transferred per impact reflects the particle size. To the advantage of experimentalists in nano-impacts, Butterworth- and Bessel filters are commonly employed in potentiostats for other reasons, namely their maximally flat frequency response in the passband and maximally linear phase response, respectively, and are hence often readily available in standard experimental set-ups. Fig. 8 illustrates the responses of these two filter types to a normalised rectangular pulse and demonstrates that the magnitudes of the spike integrals are retained. Even though the response exhibits some ‘overshoot’, all integrals feature a value of one if both positive and negative spike features are considered during the integration.
3 Experimental setup and design
Having established the theoretical understanding of mass transport processes and expected frequencies of impacts, this section provides experimental details, which allow the technique to be applied to a large number of potential usage cases.3.1 Particle characterization
In order to gain insights into particle systems via the nano-impact method, prior to electrochemical experiments accurate particle characterization is crucial. A wide range of techniques have been developed alongside the fast growth of the nanotechnology field. In this section we briefly discuss particle characterization methods and their applicability in the context of nano-impact experiments.For an in-house built system the control of the working electrode potential may be adequately achieved using a highly-stabilised adder potentiostat with a good ground.4,97 The primary aim being to ensure the electrode potential is as constant as possible, even relatively small variations in the applied potential can result in a measurable increase of a system's noise. The current-to-voltage converter used to measure the current at the working electrode is another important voltage noise source. Importantly, the converter inherently acts as a low-pass filter (most often designed to be first order) and the output signal of the amplifier may be further filtered prior to digitization of the signal.
From the above discussion it should be clear that working electrode selection, design and fabrication is an important consideration in nano-impact experiments. As an additional constraint, for ‘mediated’ impacts it is imperative that the electrode material be distinctly less active towards the electrochemical reaction of study than the nanomaterial. As a note of caution, although mercury may appear as a prime electrode material for studying catalytic nanoparticle reactions its susceptibility to forming mercurous chloride in chloride containing media can lead to erroneous results.100
To date the vast majority of nano-impact studies have been performed using glass sealed microelectrodes. These electrodes are often sufficient for studying nano-impact events, however, in cases where the nanoparticles irreversibly adsorb to the glass surface then the frequency of observed impacts may be significantly less than predicted.75 In order to overcome these issues of low impact frequency one may either use an array of electrodes101–103 or increase the dimensions of the electrode itself. In the latter case the use of carbon fibre microelectrodes104 have been found to be particularly beneficial in maintaining relatively low electrochemical noise and minimising problems of nanoparticle adsorption to the supporting substrate.
Beyond the use of electrochemically induced electrophoresis of nanoparticles, the nano-impact method provides a new route by which electrostatic interactions with the double layer may be probed. As discussed above for a redox active molecular species, migratory effects primarily arise due to a build-up of charge in the diffusion layer and are not predominantly related to the double layer. For a nano-impact experiment where the events are stochastic and the electrochemical products of the nanoparticle process are diffusionally isolated, the frequency of nanoparticle impacts with an electrode can be used to study the possible influence of the double layer on the nanoparticle. Through the investigation of the reduction of organic indigo nanoparticles under conditions of decreasing ionic strength it was demonstrated in this specific case that the decrease in the electrochemical driving force associated with the greater extent of the double layer is a more dominant effect than the migratory exclusion of the nanoparticles from the double layer.125 Due to the instability of nanoparticles towards agglomeration and aggregation under conditions of high supporting electrolyte or in the presence of multi-valent ions, the influence of low electrolyte concentrations upon the observed electrochemical response of the system is an important consideration.
3.2 What information can be extracted from impacts?
A diverse range of information can be extracted through the study of nano-impacts. This section briefly summarizes the range of properties which can be investigated and is followed by a description of some of the particular systems which have been studied to date.3.3 Examples of systems investigated via nano-impacts method
Alloy nanoparticles have tuneable properties such as the plasmonic response based on the composition and as a result are also subject of research interest. Cyclic voltammetry has been used to characterize ensemble properties of such systems.142 The nano-impacts technique has been extended by Tschulik et al. to 14 nm Ag–Au nanoparticles and allowed to determine the composition of individual particles and revealed an alloy stabilization effect on the oxidation potential of silver of a single nanoparticle.143
In addition to artificial organic structures recent works have demonstrated the use of nano-impacts for the determination of the presence of biological entities including viruses,19,20 bacteria21,22 and red blood cells.23
The idea of single-enzyme impact was recently pursued by two publications: in early 2016 Sekretaryova et al. claimed the detection of individual laccase enzymes via the catalytic reduction of oxygen by the impacting enzyme at a microdisc electrode.158 Soon after, Han et al. observed current spikes at a nanoelectrode that were interpreted as impacts of individual enzymes revealed through the reaction of horse radish peroxidase catalysed hydrogen peroxide.159
The exact interpretation of these results remains open to debate and in particular the possibility of direct electron transfer to single enzymes.160 Without doubt there will be more works on this topic soon!
4 Conclusions and outlook
The field of particle–electrode collisions is an ever-growing research discipline opening up a wide span of potential applications. Among these, a novel direction of nano-impact research may be single enzyme activity, which potentially provides insight into the enzyme reaction mechanism and kinetics at an unprecedented level of detail. Further applications may include the monitoring of the activity of nanomotors, as previous research has already demonstrated the applicability of the technique to micromotors.161 In addition it is likely that the direction of the future research will involve concurrent electrochemistry and microscopy in order to further probe the physical processes taking place building on initial studies.162–165Aside from that, we note the recent assessment of Gooding,15 who speculates that particularly the upcoming analysis of complex biological objects via the nano-impact technique will have significant impact on the future developments in this field. According to Gooding ‘this [method] has potential to allow us to better understand heterogeneity and to develop new diagnostic devices based on single cell electrochemistry’.15 Recent developments23 in the detection of individual biological cells may inspire other researchers to investigate single cell behaviour and to develop novel diagnostic tools.
Acknowledgements
The research leading to these results has received partial funding from the European Research Council under the European Union Seventh Framework Programme (FP/2007-2013)/ERC Grant Agreement no. [320403]. We thank Dr Lior Sepunaru and Dr Giorgia Zampardi for helpful discussions.References
- W. Cheng and R. G. Compton, TrAC, Trends Anal. Chem., 2014, 58, 79–89 CrossRef CAS.
- M. V. Mirkin, T. Sun, Y. Yu and M. Zhou, Acc. Chem. Res., 2016 DOI:10.1021/acs.accounts.6b00294.
- Y. Wang, X. Shan and N. Tao, Faraday Discuss., 2016 10.1039/C6FD00180G.
- C. Batchelor-McAuley, E. Kätelhön, E. O. Barnes, R. G. Compton, E. Laborda and A. Molina, ChemistryOpen, 2015, 4, 224–260 CrossRef CAS PubMed.
- P. H. Robbs and N. V. Rees, Phys. Chem. Chem. Phys., 2016, 35, 583–592 Search PubMed.
- M. Pumera, ACS Nano, 2014, 8, 7555–7558 CrossRef CAS PubMed.
- M. G. Banus, Science, 1941, 93, 601–602 CAS.
- A. Bard and L. Faulkner, Electrochemical methods: fundamentals and applications, Wiley, New York, 2nd edn, 2001 Search PubMed.
- R. G. Compton and C. E. Banks, Understanding Voltammetry, Imperial College Press, 2nd edn, 2010 Search PubMed.
- B. Haddou, N. V. Rees and R. G. Compton, Phys. Chem. Chem. Phys., 2012, 14, 13612 RSC.
- T. R. Bartlett, S. V. Sokolov and R. G. Compton, ChemistryOpen, 2015, 4, 600–605 CrossRef CAS PubMed.
- C. S. Lim, S. M. Tan, Z. Sofer and M. Pumera, ACS Nano, 2015, 9, 8474–8483 CrossRef CAS PubMed.
- W. Cheng, X.-F. Zhou and R. G. Compton, Angew. Chem., 2013, 52, 12980–12982 CrossRef CAS PubMed.
- X.-F. Zhou, W. Cheng and R. G. Compton, Nanoscale, 2014, 6, 6873–6878 RSC.
- J. J. Gooding, Angew. Chem., Int. Ed., 2016 DOI:10.1002/anie.201606459.
- L. R. Holt, B. J. Plowman, N. P. Young, K. Tschulik and R. G. Compton, Angew. Chem., Int. Ed., 2016, 55, 397–400 CrossRef CAS PubMed.
- B. J. Plowman, N. P. Young, C. Batchelor-McAuley and R. G. Compton, Angew. Chem., Int. Ed., 2016, 55, 7002–7005 CrossRef CAS PubMed.
- B.-K. Kim, J. Kim and A. J. Bard, J. Am. Chem. Soc., 2015, 137, 2343–2349 CrossRef CAS PubMed.
- J. E. Dick, A. T. Hilterbrand, A. Boika, J. W. Upton and A. J. Bard, Proc. Natl. Acad. Sci. U. S. A., 2015, 112, 5303–5308 CrossRef CAS PubMed.
- L. Sepunaru, B. J. Plowman, S. V. Sokolov, N. P. Young and R. G. Compton, Chem. Sci., 2016, 7, 3892–3899 RSC.
- L. Sepunaru, K. Tschulik, C. Batchelor-McAuley, R. Gavish and R. G. Compton, Biomater. Sci., 2015, 3, 816–820 RSC.
- J. Y. Lee, B.-K. Kim, M. Kang and J. H. Park, Sci. Rep., 2016, 6, 30022 CrossRef PubMed.
- L. Sepunaru, S. V. Sokolov, J. Holter, N. P. Young and R. G. Compton, Angew. Chem., Int. Ed., 2016, 55, 9768–9771 CrossRef CAS PubMed.
- X. Li, C. Batchelor-McAuley, S. A. I. Whitby, K. Tschulik, L. Shao and R. G. Compton, Angew. Chem., Int. Ed., 2016, 55, 4296–4299 CrossRef CAS PubMed.
- K. Micka, Collect. Czech. Chem. Commun., 1956, 21, 647–651 CrossRef CAS.
- I. Jones and R. Kaye, J. Electroanal. Chem. Interfacial Electrochem., 1969, 20, 213–221 CrossRef CAS.
- G. Moller, Chimia, 1971, 25, 29 Search PubMed.
- A. Holland and J. Sawers, Photogr. Sci. Eng., 1973, 17, 295–298 CAS.
- A. Holland and A. Feinerman, J. Appl. Photogr. Eng., 1982, 8, 165–167 Search PubMed.
- M. Heyrovsky and J. Jirkovsky, Langmuir, 1995, 11, 4288–4292 CrossRef CAS.
- M. Heyrovsky, J. Jirkovsky and M. Struplova-Bartackova, Langmuir, 1995, 11, 4300–4308 CrossRef CAS.
- M. Heyrovsky, J. Jirkovsky and M. Struplova-Bartackova, Langmuir, 1995, 11, 4309–4312 CrossRef CAS.
- M. Heyrovsky, J. Jirkovsky and B. R. Mueller, Langmuir, 1995, 11, 4293–4299 CrossRef CAS.
- H. Wu, Q. Lin, C. Batchelor-McAuley and R. G. Compton, ChemElectroChem, 2016, 3, 1478–1483 CrossRef CAS.
- X. Li, C. Lin, C. Batchelor-McAuley, E. Laborda, L. Shao and R. G. Compton, J. Phys. Lett., 2016, 7, 1554–1558 CAS.
- Y.-G. Zhou, N. V. Rees and R. G. Compton, Angew. Chem., Int. Ed., 2011, 50, 4219–4221 CrossRef CAS PubMed.
- N. V. Rees, Y.-G. Zhou and R. G. Compton, ChemPhysChem, 2011, 12, 1645–1647 CrossRef CAS PubMed.
- Y.-G. Zhou, N. V. Rees, J. Pillay, R. Tshikhudo, S. Vilakazi and R. G. Compton, Chem. Commun., 2012, 48, 224–226 RSC.
- D. Qiu, S. Wang, Y. Zheng and Z. Deng, Nanotechnology, 2013, 24, 505707 CrossRef PubMed.
- Y.-G. Zhou, B. Haddou, N. V. Rees and R. G. Compton, Phys. Chem. Chem. Phys., 2012, 14, 14354 RSC.
- E. J. E. Stuart, Y.-G. Zhou, N. V. Rees and R. G. Compton, RSC Adv., 2012, 2, 6879 RSC.
- B. Haddou, N. V. Rees and R. G. Compton, Phys. Chem. Chem. Phys., 2012, 14, 13612 RSC.
- C. E. Banks, N. V. Rees and R. G. Compton, J. Phys. Chem. B, 2002, 106, 5810–5813 CrossRef CAS.
- N. V. Rees, C. E. Banks and R. G. Compton, J. Phys. Chem. B, 2004, 108, 18391–18394 CrossRef CAS.
- J. Poon, C. Batchelor-McAuley, K. Tschulik and R. G. Compton, Chem. Sci., 2015, 6, 2869–2876 RSC.
- X. Xiao and A. J. Bard, J. Am. Chem. Soc., 2007, 129, 9610–9612 CrossRef CAS PubMed.
- X. Xiao, F.-R. F. Fan, J. Zhou and A. J. Bard, J. Am. Chem. Soc., 2008, 130, 16669–16677 CrossRef CAS PubMed.
- H. S. Ahn and A. J. Bard, Angew. Chem., Int. Ed., 2015, 54, 13753–13757 CrossRef CAS PubMed.
- S. J. Kwon, F.-R. F. Fan and A. J. Bard, J. Am. Chem. Soc., 2010, 132, 13165–13167 CrossRef CAS PubMed.
- S. J. Kwon and A. J. Bard, J. Am. Chem. Soc., 2012, 134, 10777–10779 CrossRef CAS PubMed.
- A. Fernando, S. Parajuli and M. A. Alpuche-Aviles, J. Am. Chem. Soc., 2013, 135, 10894–10897 CrossRef CAS PubMed.
- M. Kang, D. Perry, Y.-R. Kim, A. W. Colburn, R. A. Lazenby and P. R. Unwin, J. Am. Chem. Soc., 2015, 137, 10902–10905 CrossRef CAS PubMed.
- B. M. Quinn, P. G. van't Hof and S. G. Lemay, J. Am. Chem. Soc., 2004, 126, 8360–8361 CrossRef CAS PubMed.
- E. Lebègue, C. M. Anderson, J. E. Dick, L. J. Webb and A. J. Bard, Langmuir, 2015, 31, 11734–11739 CrossRef PubMed.
- J. E. Dick, C. Renault and A. J. Bard, J. Am. Chem. Soc., 2015, 137, 8376–8379 CrossRef CAS PubMed.
- A. Einstein, Ann. Phys., 1905, 322, 549–560 CrossRef.
- W. Sutherland, Philos. Mag., 1905, 9, 781–785 CrossRef CAS.
- H. Brenner, Chem. Eng. Sci., 1961, 16, 242–251 CrossRef CAS.
- M. A. Bevan and D. C. Prieve, J. Chem. Phys., 2000, 113, 1228–1236 CrossRef CAS.
- H. Faxen, Ark. Mat., Astron. Fys., 1923, 17, 27 Search PubMed.
- A. Goldman, R. Cox and H. Brenner, Chem. Eng. Sci., 1967, 22, 637–651 CrossRef CAS.
- P. S. Singh, E. Kätelhön, K. Mathwig, B. Wolfrum and S. G. Lemay, ACS Nano, 2012, 6, 9662–9671 CrossRef CAS PubMed.
- E. Kätelhön, K. J. Krause, P. S. Singh, S. G. Lemay and B. Wolfrum, J. Am. Chem. Soc., 2013, 135, 8874–8881 CrossRef PubMed.
- E. Kätelhön, K. J. Krause, K. Mathwig, S. G. Lemay and B. Wolfrum, ACS Nano, 2014, 8, 4924–4930 CrossRef PubMed.
- E. Kätelhön and R. G. Compton, Chem. Sci., 2014, 5, 4592–4598 RSC.
- S. Eloul, E. Kätelhön, C. Batchelor-McAuley, K. Tschulik and R. G. Compton, J. Electroanal. Chem., 2015, 755, 136–142 CrossRef CAS.
- Y. Saito, Rev. Polarogr., 1968, 15, 177–187 CrossRef CAS.
- D. Shoup and A. Szabo, J. Electroanal. Chem. Interfacial Electrochem., 1982, 140, 237–245 CrossRef CAS.
- J. Heinze, J. Electroanal. Chem. Interfacial Electrochem., 1981, 124, 73–86 CrossRef CAS.
- A. Szabo, D. K. Cope, D. E. Tallman, P. M. Kovach and R. Wightman, J. Electroanal. Chem. Interfacial Electrochem., 1987, 217, 417–423 CrossRef CAS.
- S. Eloul, E. Kätelhön, C. Batchelor-McAuley, K. Tschulik and R. G. Compton, J. Phys. Chem. C, 2015, 119, 14400–14410 CAS.
- S. Eloul and R. G. Compton, J. Phys. Lett., 2016, 4317–4321 CAS.
- S. Eloul, E. Kätelhön and R. G. Compton, Phys. Chem. Chem. Phys., 2016, 50, 4219–4221 Search PubMed.
- S. V. Sokolov, E. Kätelhön and R. G. Compton, J. Phys. Chem. C, 2016, 120, 10629–10640 CAS.
- S. Eloul and R. G. Compton, ChemElectroChem, 2014, 1, 917–924 CrossRef CAS.
- E. Kätelhön, E. E. Tanner, C. Batchelor-McAuley and R. G. Compton, Electrochim. Acta, 2016, 199, 297–304 CrossRef.
- P. Bobbert, M. Wind and J. Vlieger, Phys. A, 1987, 141, 58–72 CrossRef.
- I. Streeter and R. G. Compton, J. Phys. Chem. C, 2007, 111, 18049–18054 CAS.
- J. M. Kahk, N. V. Rees, J. Pillay, R. Tshikhudo, S. Vilakazi and R. G. Compton, Nano Today, 2012, 7, 174–179 CrossRef CAS.
- E. Kätelhön, A. Feng, W. Cheng, S. Eloul, C. Batchelor-McAuley and R. G. Compton, J. Phys. Chem. C, 2016, 120, 17029–17034 Search PubMed.
- Q. Lin and R. G. Compton, J. Phys. Chem. C, 2015, 119, 23463–23469 CAS.
- S. Eloul and R. G. Compton, J. Phys. Chem. C, 2015, 119, 27540–27549 CAS.
- I. N. Bronstein, K. A. Semendjajew, G. Musiol and H. Mühlig, Taschenbuch der Mathematik, 2008, vol. 23, p. 1216 Search PubMed.
- D. B. Williams and C. B. Carter, Transmission Electron Microscopy, Springer US, Boston, MA, 2009 Search PubMed.
- P. L. Stewart, Wiley Interdiscip. Rev.: Nanomed. Nanobiotechnol., 2016 DOI:10.1002/wnan.1417.
- E. A. Ring and N. de Jonge, Micron, 2012, 43, 1078–1084 CrossRef CAS PubMed.
- K. Schmitz, An Introduction to Dynamic Light Scattering by Macromolecules, Elsevier, 2006, vol. 24 Search PubMed.
- V. Filipe, A. Hawe and W. Jiskoot, Pharm. Res., 2010, 27, 796–810 CrossRef CAS PubMed.
- R. Pecora, J. Nanopart. Res., 2000, 2, 123–131 CrossRef CAS.
- M. Kaszuba, J. Corbett, F. M. Watson and A. Jones, Philos. Trans. R. Soc., A, 2010, 368, 4439–4451 CrossRef CAS PubMed.
- G. V. Lowry, R. J. Hill, S. Harper, A. F. Rawle, C. O. Hendren, F. Klaessig, U. Nobbmann, P. Sayre and J. Rumble, Environ. Sci.: Nano, 2016, 3, 953–965 RSC.
- W. R. Fawcett, J. Solid State Electrochem., 2011, 15, 1347–1358 CrossRef CAS.
- H. Gerischer, Berichte der Bunsengesellschaft für physikalische Chemie, 1966, 70, 765–766 Search PubMed.
- D. C. Grahame, Chem. Rev., 1947, 41, 441–501 CrossRef CAS PubMed.
- J. Yao and K. D. Gillis, Analyst, 2012, 137, 2674 RSC.
- B. Sakmann and E. Neher, Single-Channel Recording, Springer US, Boston, MA, 1995 Search PubMed.
- C. Batchelor-McAuley, E. Kätelhön, E. O. Barnes, R. G. Compton, E. Laborda and A. Molina, ChemistryOpen, 2015, 4, 224–260 CrossRef CAS PubMed.
- D. O. Wipf, A. C. Michael and R. Wightman, J. Electroanal. Chem. Interfacial Electrochem., 1989, 269, 15–25 CrossRef CAS.
- K. R. Wehmeyer and R. Wightman, J. Electroanal. Chem. Interfacial Electrochem., 1985, 196, 417–421 CrossRef CAS.
- T. R. Bartlett, C. Batchelor-McAuley, K. Tschulik, K. Jurkschat and R. G. Compton, ChemElectroChem, 2015, 2, 522–528 CrossRef CAS.
- K. J. Krause, A. Yakushenko and B. Wolfrum, Anal. Chem., 2015, 87, 7321–7325 CrossRef CAS PubMed.
- S. V. Sokolov, C. Batchelor-McAuley, K. Tschulik, S. Fletcher and R. G. Compton, Chem. – Eur. J., 2015, 21, 10741–10746 CrossRef CAS PubMed.
- S. Fletcher and M. D. Horne, Electrochem. Commun., 1999, 1, 502–512 CrossRef CAS.
- J. Ellison, C. Batchelor-McAuley, K. Tschulik and R. G. Compton, Sens. Actuators, B, 2014, 200, 47–52 CrossRef CAS.
- J. Lyklema, H. P. Van Leeuwen and M. Minor, Adv. Colloid Interface Sci., 1999, 83, 33–69 CrossRef CAS.
- E. M. V. Hoek and G. K. Agarwal, J. Colloid Interface Sci., 2006, 298, 50–58 CrossRef CAS PubMed.
- S. Torkzaban, S. A. Bradford and S. L. Walker, Langmuir, 2007, 23, 9652–9660 CrossRef CAS PubMed.
- G. Trefalt and M. Borkovec, Overview of DLVO theory, 2014, http://www.colloid.ch/dlvo (accessed November 2016).
- S. V. Sokolov, K. Tschulik, C. Batchelor-McAuley, K. Jurkschat and R. G. Compton, Anal. Chem., 2015, 87, 10033–10039 CrossRef CAS PubMed.
- D. A. Robinson, A. M. Kondajji, A. D. Castañeda, R. Dasari, R. M. Crooks and K. J. Stevenson, J. Phys. Lett., 2016, 7, 2512–2517 CAS.
- N. T. K. Thanh and Z. Rosenzweig, Anal. Chem., 2002, 74, 1624–1628 CrossRef CAS PubMed.
- C. Lourenco, M. Teixeira, S. Simões and R. Gaspar, Int. J. Pharm., 1996, 138, 1–12 CrossRef CAS.
- M. K. Corbierre, N. S. Cameron, M. Sutton, S. G. J. Mochrie, L. B. Lurio, A. Rühm and R. B. Lennox, J. Am. Chem. Soc., 2001, 123, 10411–10412 CrossRef CAS PubMed.
- L. Wu, A. Mendoza-Garcia, Q. Li and S. Sun, Chem. Rev., 2016, 116, 10473–10512 CrossRef CAS PubMed.
- M. Niederberger, G. Garnweitner, J. Buha, J. Polleux, J. Ba and N. Pinna, J. Sol–Gel Sci. Technol., 2006, 40, 259–266 CrossRef CAS.
- E. Kätelhön, W. Cheng, C. Batchelor-McAuley, K. Tschulik and R. G. Compton, ChemElectroChem, 2014, 1, 1057–1062 CrossRef.
- S. Feldberg, Electrochem. Commun., 2000, 2, 453–456 CrossRef CAS.
- K. B. Oldham and A. M. Bond, J. Electroanal. Chem., 2001, 508, 28–40 CrossRef CAS.
- W. Hyk and Z. Stojek, Anal. Chem., 2005, 77, 6481–6486 CrossRef CAS PubMed.
- S. R. Belding, J. G. Limon-Petersen, E. J. F. Dickinson and R. G. Compton, Angew. Chem., Int. Ed., 2010, 49, 9242–9245 CrossRef CAS PubMed.
- E. J. F. Dickinson, J. G. Limon-Petersen and R. G. Compton, J. Solid State Electrochem., 2011, 15, 1335–1345 CrossRef CAS.
- I. Streeter and R. G. Compton, J. Phys. Chem. C, 2008, 112, 13716–13728 CAS.
- J. H. Park, A. Boika, H. S. Park, H. C. Lee and A. J. Bard, J. Phys. Chem. C, 2013, 117, 6651–6657 CAS.
- A. Boika, S. N. Thorgaard and A. J. Bard, J. Phys. Chem. B, 2013, 117, 4371–4380 CrossRef CAS PubMed.
- K. Tschulik, W. Cheng, C. Batchelor-McAuley, S. Murphy, D. Omanović and R. G. Compton, ChemElectroChem, 2015, 2, 112–118 CrossRef CAS.
- J. Dolinska, M. Jonsson-Niedziolka, V. Sashuk and M. Opallo, Electrochem. Commun., 2013, 37, 100–103 CrossRef CAS.
- J. J. P. Roberts, J. A. Westgard, L. M. Cooper and R. W. Murray, J. Am. Chem. Soc., 2014, 136, 10783–10789 CrossRef CAS PubMed.
- J. J. Yoo, J. Kim and R. M. Crooks, Chem. Sci., 2015, 6, 6665–6671 RSC.
- T. M. Alligrant, M. J. Anderson, R. Dasari, K. J. Stevenson and R. M. Crooks, Langmuir, 2014, 30, 13462–13469 CrossRef CAS PubMed.
- S. V. Sokolov, T. R. Bartlett, P. Fair, S. Fletcher and R. G. Compton, Anal. Chem., 2016, 88, 8908–8912 CrossRef CAS PubMed.
- W. J. Stark, Angew. Chem., Int. Ed., 2011, 50, 1242–1258 CrossRef CAS PubMed.
- W. J. Stark, P. R. Stoessel, W. Wohlleben and A. Hafner, Chem. Soc. Rev., 2015, 44, 5793–5805 RSC.
- R. Prasher, W. Evans, P. Meakin, J. Fish, P. Phelan and P. Keblinski, Appl. Phys. Lett., 2006, 89, 143119 CrossRef.
- Y. Wei, S. Han, J. Kim, S. Soh and B. A. Grzybowski, J. Am. Chem. Soc., 2010, 132, 11018–11020 CrossRef CAS PubMed.
- S. V. Sokolov, E. Kätelhön and R. G. Compton, J. Electroanal. Chem., 2015 DOI:10.1016/j.jelechem.2016.01.023.
- A. McNaught and A. Wilkinson, IUPAC. Compendium of Chemical Terminology, Blackwell Scientific Publications, Oxford, 2nd edn, 1997 Search PubMed.
- J. Ellison, K. Tschulik, E. J. E. Stuart, K. Jurkschat, D. Omanović, M. Uhlemann, A. Crossley and R. G. Compton, ChemistryOpen, 2013, 2, 69–75 CrossRef CAS PubMed.
- T. R. Bartlett, S. V. Sokolov, J. Holter, N. Young and R. G. Compton, Chem. – Eur. J., 2016, 22, 7408–7414 CrossRef CAS PubMed.
- J.-T. Lue, J. Phys. Chem. Solids, 2001, 62, 1599–1612 CrossRef CAS.
- V. H. Grassian, J. Phys. Chem. C, 2008, 112, 18303–18313 CAS.
- M. B. Gawande, A. Goswami, T. Asefa, H. Guo, A. V. Biradar, D.-L. Peng, R. Zboril and R. S. Varma, Chem. Soc. Rev., 2015, 44, 7540–7590 RSC.
- B. J. Plowman, B. Sidhureddy, S. V. Sokolov, N. P. Young, A. Chen and R. G. Compton, ChemElectroChem, 2016, 3, 1039–1043 CrossRef CAS.
- E. N. Saw, V. Grasmik, C. Rurainsky, M. Epple and K. Tschulik, Faraday Discuss., 2016, 29, 27–35 Search PubMed.
- D. Horn and J. Rieger, Angew. Chem., Int. Ed., 2001, 40, 4330 CrossRef CAS.
- K. K. Ng and G. Zheng, Chem. Rev., 2015, 115, 11012–11042 CrossRef CAS PubMed.
- B.-K. Kim, A. Boika, J. Kim, J. E. Dick and A. J. Bard, J. Am. Chem. Soc., 2014, 136, 4849–4852 CrossRef CAS PubMed.
- W. Cheng and R. G. Compton, Angew. Chem., Int. Ed., 2015, 54, 7082–7085 CrossRef CAS PubMed.
- A. Feng, W. Cheng and R. G. Compton, Chem. Sci., 2016, 318, 62–64 Search PubMed.
- A. Feng, W. Cheng, J. Holter, N. Young and R. G. Compton, Chem. – Eur. J., 2016, 22, 6981–6986 CrossRef CAS PubMed.
- X.-F. Zhou, W. Cheng and R. G. Compton, Angew. Chem., 2014, 126, 12795–12797 CrossRef.
- W. Cheng and R. G. Compton, ChemElectroChem, 2016 DOI:10.1002/celc.201600396.
- H. S. Toh and R. G. Compton, Chem. Sci., 2015, 6, 5053–5058 RSC.
- K. Tschulik, B. Haddou, D. Omanović, N. V. Rees and R. G. Compton, Nano Res., 2013, 6, 836–841 CrossRef CAS.
- K. Shimizu, S. V. Sokolov and R. G. Compton, Colloid Interface Sci. Commun., 2016, 13, 19–22 CrossRef CAS.
- K. Shimizu, K. Tschulik and R. G. Compton, Chem. Sci., 2016, 7, 1408–1414 RSC.
- S. V. Sokolov, E. Kätelhön and R. G. Compton, J. Electroanal. Chem., 2016 DOI:10.1016/j.jelechem.2016.01.023.
- T. R. Bartlett, S. V. Sokolov, B. J. Plowman, N. P. Young and R. G. Compton, Nanoscale, 2016 10.1039/C6NR05740C.
- A. N. Sekretaryova, M. Y. Vagin, A. P. F. Turner and M. Eriksson, J. Am. Chem. Soc., 2016, 138, 2504–2507 CrossRef CAS PubMed.
- L. Han, W. Wang, J. Nsabimana, J.-W. Yan, B. Ren and D. Zhan, Faraday Discuss., 2016 10.1039/C6FD00061D.
- E. Kätelhön, L. Sepunaru, A. Karyakin and R. Compton, ACS Catal., 2016 DOI:10.1021/acscatal.6b02633.
- J. G. S. Moo and M. Pumera, ACS Sens., 2016, 1, 949–957 CrossRef CAS.
- C. Batchelor-McAuley, A. Martinez-Marrades, K. Tschulik, A. N. Patel, C. Combellas, F. Kanoufi, G. Tessier and R. G. Compton, Chem. Phys. Lett., 2014, 597, 20–25 CrossRef CAS.
- V. Brasiliense, P. Berto, C. Combellas, G. Tessier and F. Kanoufi, Acc. Chem. Res., 2016, 49, 2049–2057 CrossRef CAS PubMed.
- V. Brasiliense, A. N. Patel, A. Martinez-Marrades, J. Shi, Y. Chen, C. Combellas, G. Tessier and F. Kanoufi, J. Am. Chem. Soc., 2016, 138, 3478–3483 CrossRef CAS PubMed.
- C. Batchelor-McAuley, C. A. Little, S. V. Sokolov, E. Kätelhön, G. Zampardi and R. G. Compton, Anal. Chem., 2016 DOI:10.1021/acs.analchem.6b03524.
| This journal is © the Owner Societies 2017 |

