Interaction of molecular nitrogen with free-electron-laser radiation
Received
11th April 2017
, Accepted 19th June 2017
First published on 19th June 2017
Abstract
We compute molecular continuum orbitals in the single center expansion scheme. We then employ these orbitals to obtain molecular Auger rates and single-photon ionization cross sections to study the interaction of N2 with Free-Electron-Laser (FEL) pulses. The nuclei are kept fixed. We formulate rate equations for the energetically allowed molecular and atomic transitions and we account for dissociation through additional terms in the rate equations. Solving these equations for different parameters of the FEL pulse, allows us to identify the most efficient parameters of the FEL pulse for obtaining the highest contribution of double core hole states (DCH) in the final atomic ion fragments. Finally we identify the contribution of DCH states in the electron spectra and show that the DCH state contribution is more easily identified in the photo-ionization rather than the Auger transitions.
1 Introduction
The development of X-ray free electron lasers (FELs)1 has introduced new tools for imaging and exploring novel states of atoms and molecules.2,3 Potential applications of FELs range from imaging biomolecules4–6 to accurate modeling of laboratory and astrophysical plasmas. FEL driven processes in atoms and molecules include single-photon ionization and Auger processes. Sequential single-photon ionization processes occurring on a time scale that is faster than Auger decays lead to the formation of multiple inner-shell holes in atoms and molecules. In an Auger process a valence electron drops in to fill a core hole; the energy released allows another valence electron to escape to the continuum. The formation of double core hole (DCH) states in molecules is of particular interest for chemical analysis.7,8 The energy required to remove a core electron depends upon the chemical environment of the site the electron is removed from rendering DCHs a sensitive spectroscopic tool for chemical analysis.
To understand the formation and detection of single core hole (SCH) and DCH states in molecules, one must explore the interplay of Auger and photo-ionization processes. There has been a significant amount of work on calculating the Auger rates and photo-ionization cross sections in atoms9–14 and molecules.15–21 Computing these rates for molecules is more challenging. The reason is that molecules do not have spherical symmetry and thus computing the molecular continuum orbital of the escaping electron is a complex task.
Previous molecular studies with FEL radiation include models where the molecule is treated as a combination of atoms. Then, in these models, the Auger rates and the photo-ionization cross sections are computed for atomic transitions.22,23 These atomic rates are then used to setup rate equations to describe molecular interactions with FEL radiation. In some instances dissociation is accounted for through additional terms in the rate equations.22,23 For high photon energy FEL pulses interacting with N2, these models have been used to compute the yields of the final atomic ion fragments as well as the contribution of the DCH molecular states in the yields of the final atomic ions.22,23 Very recently, new methods have been developed to describe molecular states with multiple holes and to compute molecular transitions following interaction with FEL radiation.24,25 These new methods have been employed to compute the yields of the final molecular ion states as well as the contribution of SCH and DCH states in water for fixed nuclei.26 The calculations in these studies were performed with atomic continuum orbitals rather than molecular ones. The use of atomic continuum orbitals is a good approximation when these models are employed to study molecular interactions with high photon energy FEL pulses.
Previous studies27,28 have identified the time delay between subsequent PA steps, with PA consisting of a single-photon ionization (P) and an Auger decay (A), as well as the inter-nuclear distance at the time these steps take place. It has been shown in ref. 27 that when comparing laser pulses of the same intensity but of different duration, PA events take place at smaller inter-nuclear distances for the smaller duration laser pulses. Similarly, when comparing laser pulses of the same duration but of different intensity, PA events take place at smaller inter-nuclear distances for the higher intensity laser pulses.27 Thus, for laser pulses of small pulse duration and of high intensity the molecular transitions at small inter-nuclear distances are important rendering the effect of the nuclear motion less important. In addition, it follows that the use of molecular continuum orbitals versus atomic continuum orbitals will result in more accurate results mostly for small duration and high intensity FEL pulses.
N2 interacting with FEL pulses has been the subject of many experimental studies.27,29–32 In these studies the yields of the final atomic ion states and the formation of molecular DCHs are investigated. In this work, we study the interaction of the N2 diatomic molecule with FEL radiation. To do so, we assume that the nuclei are fixed, an assumption also made in previous studies.22,23,26 Very importantly, we compute the molecular continuum orbitals. We then employ these orbitals to compute the Auger rates and the single-photon ionization cross sections for all molecular transitions that are energetically accessible.
We investigate the interaction of a 525 eV and a 1100 eV FEL pulse with N2. These photon energies are sufficient to create three inner-shell holes through sequential single-photon absorptions and multiple valence holes in the ground state of N2. Moreover, as we show in the section concerning electron spectra, for a 525 eV FEL pulse some of the electrons ionize with very small energies. These small energies render necessary the use of molecular continuum orbitals, as is done in the current work. We compute the Auger and the single-photon ionization processes for the allowed molecular transitions, thus improving over previous studies that consider only atomic transitions.23 We note that the use of molecular bound state orbitals is important for obtaining electron spectra. Indeed, it has been shown that with high-resolution electron spectroscopy one can observe the energy splitting of the molecular core hole states 1σg and 1σu.17,33 We then set up rate equations for the allowed molecular and atomic transitions and account for dissociation through additional terms in the rate equations. We also investigate the dependence of the final molecular and atomic ion fragments on the intensity and pulse duration of the FEL pulse. We compare the atomic ion yields with experimental results23,32 and find very good agreement. Moreover, we compute all energetically accessible pathways and can thus determine the contribution of the DCH molecular states in the final atomic ion states as well as in the electron spectra. Finally, we investigate whether photo-ionization or Auger transitions in the electron spectra are more effective in detecting the formation of DCH molecular states.
2 Ion yields and pathways
We study the response of N2 to FEL pulses of photon energies 525 eV and 1100 eV. We do so by formulating and solving a set of rate equations for the time dependent population of the ion states.
2.1 Rate equations
We construct rate equations for each energetically accessible state of molecular nitrogen. Each molecular state is denoted by its electronic configuration (1σag, 1σbu, 2σcg, 2σdu, 1πeux, 1πfuy, 3σgg) with a, b, c, d, e, f, g the number of electrons occupying a molecular orbital. Each occupation number is equal to 0, 1 or 2. 2 corresponds to the maximum occupancy of a molecular orbital of two electrons with spin up and down. Atomic units are used in this work, unless otherwise stated. In Fig. 1, accounting for states up to N24+, we illustrate the photo-ionization and Auger transitions between molecular states that are accessible due to the interaction of N2 with a 525 eV laser pulse. To create a core hole, a minimum photon energy of 420 eV is required. The transitions in Fig. 1 were calculated for the ground state equilibrium distance of the nuclei for N2. This was done by employing Molpro34 and performing a Hartree Fock calculation using correlation-consistent polarized triple-zeta (cc-pVTZ) basis set.
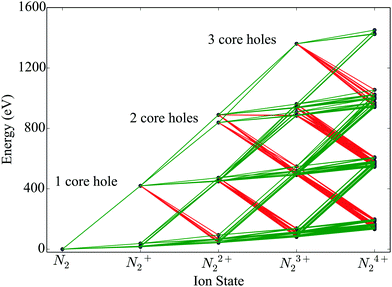 |
| | Fig. 1 Ionization pathways between different electronic configurations of N2 up to N24+, accessible with sequential single-photon (ħω = 525 eV) absorptions and Auger decays. The green and red lines indicate photo-ionization and Auger transitions, respectively. | |
We assume that the nuclei are fixed at the equilibrium distance of N2 of 2.08 a.u. To model the fragmentation of N2 that leads to the formation of atomic ions, we include in the rate equations terms accounting for dissociation. Specifically, we assume that instantaneous dissociation, i.e. a very large dissociation rate, takes place from the N24+ and N23+ molecular states with no core holes. Dissociation of N23+ and N24+ leads to N+ + N2+ and N2+ + N2+, respectively. As in ref. 23, we further assume that all N22+ molecular states dissociate. We take the dissociation lifetime to be equal to 100 fs.35 This is a reasonable assumption. It has been shown that only few non-dissociated molecules N22+ were detected in the experiment contributing less than 2% in the N+ peak of the final atomic ion fragments.32 N22+ dissociation leads to N+ + N+ and N + N2+ with probabilities 74% and 26%,35 respectively. The above dissociation processes are similar to the dissociation processes taken into account in ref. 23. In the rate equations fluorescence is not accounted for since the corresponding rates are much smaller compared to Auger and single-photon ionization processes.36 In the rate equations we also account for the states of atomic nitrogen that are accessible through molecular fragmentation and through single-photon ionization and Auger processes occurring in the atomic ion states. Each atomic state is denoted by (1sa,2sb,2pc) with a, b and c the occupation numbers of the atomic orbitals.
We formulate molecular rate equations to describe the population  of a molecular ion state j. In addition, we solve for the Auger
  and the photo-ionization
  yield from an initial molecular state i with charge q − 1 to a final molecular state j with charge q. These yields provide the probability for observing an electron with energy corresponding to the molecular transition i → j. We use these yields to describe the molecular transitions in the electron spectra produced by the interaction of N2 with an FEL pulse. The electron spectra are presented later in the paper. We also formulate rate equations to describe the population of an atomic state n. We also solve for the Auger
  and the photo-ionization
  yields from an initial atomic state m with charge q − 1 to a final atomic state n with charge q. These yields provide the probability for observing an electron with energy corresponding to the atomic transition m → n. We use these yields to describe the atomic transitions in the electron spectra produced by the interaction of N2 with an FEL pulse. It is also of interest to compute the population transfer through a specific pathway i → j → k where the initial state is i and the final one that is k is reached through the state j. Each pathway starts from the ground state of N2 and ends at an accessible atomic or molecular ion state. Obtaining the pathway populations allows to determine the percentage of final ion states that were formed through pathways involving molecular states with only a single or a double core hole. These results are presented later in the paper. For a detailed description of the rate equations, see Appendix A.
2.2 Electron continuum molecular orbitals
An advantage of the rate equations formulated in the previous section is that we compute the single-photon ionization cross sections and the Auger rates using the continuum wave functions of the molecular orbitals. We compute these continuum molecular orbitals by following the formulation in ref. 37. In what follows, we briefly outline the steps we follow to compute the continuum molecular orbitals. The first step in the derivation involves the Hartree–Fock equations38 given by| | 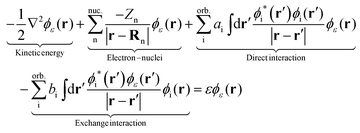 | (1) |
The index ε denotes a continuum molecular orbital with ε > 0 the energy of the ionizing electron. The index i denotes bound molecular orbitals, where ai and bi are coefficients associated with the orbital i. These coefficients are derived in Appendix B. Rn denotes the position of nucleus n. The electron–nuclei term is the Coulomb interaction of the continuum electron with each one of the nuclei. The direct and exchange terms arise from the Coulomb interaction of the continuum electron with the bound electrons. To simplify the numerical integrations involved in eqn (1), the bound and continuum orbital wave functions are expressed using the single-centre expansion (SCE).37 This approximation allows for the angular part of the integrations in eqn (1) to be obtained analytically. According to the SCE the wave function of the molecular orbital i is expressed as
| |  | (2) |
with
r = (
r,
θ,
ϕ) denoting the position of the electron. For continuum orbitals, i is replaced by the energy of the ionizing electron
ε.
Ylm is a spherical harmonic with quantum numbers
l and
m.
Pilm(
r) are single centre expansion coefficients for the orbital i. Substituting
eqn (2) in
eqn (1) and then multiplying by
Ylm* and integrating over the angular part results in
| |  | (3) |
 is the electron–nuclei interaction,
  is the direct interaction term, and Xlm[
![[P with combining macron]](https://www.rsc.org/images/entities/i_char_0050_0304.gif) ε](r) is the exchange interaction term. In eqn (3), we are solving for
ε](r) is the exchange interaction term. In eqn (3), we are solving for  , which are the coefficients in the SCE of the continuum wavefunction.
 ![[P with combining macron]](https://www.rsc.org/images/entities/i_char_0050_0304.gif) ε is the vector form of
ε is the vector form of  . The electron–nuclei interaction
  is given by
| |  | (4) |
with the angular integration expressed in terms of Wigner 3j-symbols;
39r< = min(
r,
Rn) and
r> = max(
r,
Rn). The direct interaction
Jlm,l′m′(
r) is given by
| | 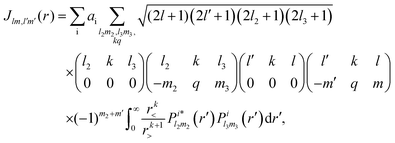 | (5) |
where
r< = min(
r,
r′) and
r> = max(
r,
r′) and,
l2,
m2 and
l3,
m3 refer to the orbital i. The exchange interaction can be cast as a functional of the SCE coefficients of the continuum electron orbital as follows
| | 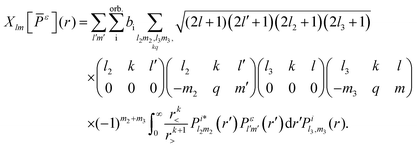 | (6) |
For numerical efficiency,

are obtained solving
eqn (3) with the non-iterative method described in
ref. 37. Diatomic molecules have rotational symmetry around the molecular axis and thus
m is a good quantum number. Therefore,
m2 and
m3 are equal and have a fixed value for a bound orbital i. In addition,
m and
m′ are equal and have a fixed value determined by the symmetry of the continuum orbital. For the N
2 diatomic molecule, we find that convergence of the continuum orbital is achieved when considering
l up to 19 for the single center expansion. As a result, for each energy
ε,
eqn (3) has at the most 20 degenerate solutions.
2.3 Photo-ionization cross-sections
The photo-ionization cross-section40 for an electron transitioning from an initial molecular orbital ϕi to a final continuum molecular orbital ϕε is given by| |  | (7) |
where α is the fine structure constant, Ni is the occupation number of the initial molecular orbital i, ω is the photon energy, and M is the polarization of the photon. In the length gauge, the matrix element DMiε is given by| |  | (8) |
In the single centre expansion formalism eqn (8) takes the form| |  | (9) |
We compare for several transitions in N2 the photo-ionization cross sections we compute using eqn (9) with previous calculations.41 We find overall a very good agreement as shown for two transitions in Table 1. Differences between our results and the ones in ref. 41 might be due to the fact that in ref. 41 the Hartee–Fock equations are solved with ai = 2 and bi = 1 for all orbitals which is not the case in our calculations, see Appendix B.
Table 1 Photo-ionization cross-sections for N2 transitions: columns 3 and 5 correspond to our results and columns 2 and 4 correspond to previous calculations41
|
E
photon (eV) |
2σg → εσu |
2σg → επu |
|
Ref. 41
|
This work |
Ref. 41
|
This work |
| 40 |
0.035 |
0.038 |
0.073 |
0.20 |
| 45 |
0.58 |
0.55 |
0.22 |
0.38 |
| 50 |
2.6 |
2.5 |
0.41 |
0.52 |
| 55 |
1.9 |
2.0 |
0.59 |
0.63 |
| 60 |
1.1 |
1.2 |
0.71 |
0.69 |
| 65 |
0.74 |
0.80 |
0.75 |
0.73 |
| 70 |
0.54 |
0.58 |
0.74 |
0.73 |
| 75 |
0.40 |
0.44 |
0.70 |
0.72 |
| 80 |
0.31 |
0.33 |
0.65 |
0.69 |
2.4 Auger rates
In general, the Auger rate is given by42| |  | (10) |
where  denotes a summation over the final states and an average over the initial states. |Ψ〉 is the wavefunction of all electrons in the molecular state. In the Hartree–Fock approximation, |Ψ〉 is given by a Slater determinant of one-electron spin–orbital wavefunctions. The Auger transition is treated as a two-electron process and therefore the relevant part of HI is the electron–electron Coulomb interaction term. In the second quantization formalism,43,44 this Hamiltonian term is given by
| |  | (11) |
where cγ is the annihilation operator of the one-electron spin–orbital wavefunction |γ〉 and c†α is the creation operator of the one-electron spin–orbital wavefunction |α〉. Then, the matrix element takes the form| |  | (12) |
Using the anti-commutation relations of the creation and annihilation operators, eqn (12) is written as| |  | (13) |
In the Auger transition matrix element, a and b are the one-electron wavefunctions of the two valence electrons, while s and ζ are the one-electron wavefunctions of the core and continuum electrons, respectively. In this transition, the core hole in spin–orbital s is filled by an electron from spin–orbitals a or b, while the other valence electron ionizes. Changing from the maμambμb to the mambSMS scheme we obtain| |  | (14) |
ma and μa are the projection of the orbital angular momentum and spin, respectively, while S is the total spin and MS is the projection of the total spin.  is the spatial part of the matrix element
  which is given by
| |  | (15) |
Using eqn (14) and (15) and expressing the orbital wavefunctions in the SCE scheme, we find| | 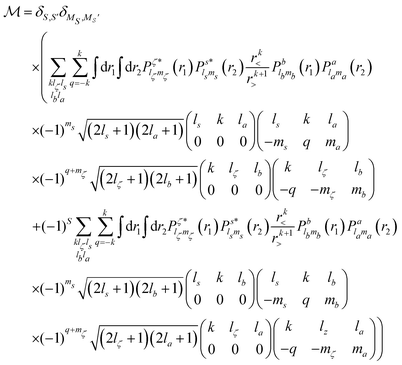 | (16) |
where r< = min(r,r′) and r> = max(r,r′). The Auger rate is given by| |  | (17) |
with Nh the number of holes in the orbital to be filled. N12 is the weighting occupation factor given by| |  | (18) |
where Nv1 and Nv2 are the occupations numbers of the valence orbitals that are involved in the Auger transition.
Next, we compare our results for the Auger rates of N2+ with a 1s core–hole, which are computed using eqn (17) with the Auger rates calculated using a Green's function method.45 The 1s state corresponds to  . Using the orthogonality of the molecular states, it follows that the 1s Auger rates are obtained by averaging the Auger rates of the 1σg and 1σu core hole molecular states. In the work in ref. 45, only relative values of the Auger rates are given. Specifically, the ratio of each Auger rate with respect to the transition is given. To compare the results in ref. 45 with our values we divide each Auger transition by the sum of all Auger transitions for a 1s core–hole state. The resulting values are shown in Table 2 and the agreement is shown to be overall good. The agreement between some of the Auger rates we compute in the current work and the Auger rates in ref. 45 is not as good. We believe this is due to the different techniques employed to compute the Auger rates. This is supported by further comparing Auger rates computed in the current work with results for Auger rates given in ref. 45 and 46. In the latter work, the author employs a Configuration Interaction calculation to compute the Auger rates of N2+ with a 1s core hole. As in ref. 45, in ref. 46 only relative values of the Auger rates are given. In Table 3 we compare the ratio of some 1s Auger rates with the Auger rate for the transition to the 1Σg+ state with 3σg electrons filling in the core hole and being ejected to the continuum; we denote this final state by 1Σg+(3σg3σg). We find that any two techniques agree only for some of the transitions shown in Table 3.
Table 2 Ratio of each Auger transition for a 1s core–hole divided by the sum of all Auger transitions for a 1s core–hole for N2
| Final state |
Valence 1 |
Valence 2 |
This work |
Ref. 45
|
|
3Σu+ |
2σu |
3σg |
0.01 |
0.01 |
|
1Σu+ |
2σu |
3σg |
0.05 |
0.11 |
|
3Πu |
3σg |
1πux(1πuy) |
0.01 |
0.01 |
|
1Πu |
3σg |
1πux(1πuy) |
0.11 |
0.13 |
|
3Πg |
2σu |
1πux(1πuy) |
0.02 |
0.03 |
|
1Πg |
2σu |
1πux(1πuy) |
0.08 |
0.13 |
|
3Πu |
2σg |
1πux(1πuy) |
0.03 |
0.01 |
|
1Πu |
2σg |
1πux(1πuy) |
0.09 |
0.06 |
|
3Σu+ |
2σg |
2σu |
0.01 |
0.01 |
|
1Σu+ |
2σg |
2σu |
0.20 |
0.11 |
|
3Σg+ |
2σg |
3σg |
0.02 |
0.02 |
|
1Σg+ |
2σg |
3σg |
0.08 |
0.07 |
|
1Σg+ |
3σg |
3σg |
0.05 |
0.04 |
|
1Δg |
1πux(1πuy) |
1πux(1πuy) |
0.09 |
0.12 |
|
1Σg+ |
1πux(1πuy) |
1πuy(1πux) |
0.03 |
0.01 |
|
1Σg+ |
2σu |
2σu |
0.05 |
0.13 |
|
1Σg+ |
2σg |
2σg |
0.07 |
0.02 |
Table 3 Ratio of some of the Auger transitions for a 1s core–hole or N2 divided by the Auger transition to the 1Σg+(3σg3σg) state
| Final State |
Valence 1 |
Valence 2 |
This work |
Ref. 45
|
Ref. 46
|
|
1Σg+ |
3σg |
3σg |
1.00 |
1.00 |
1.00 |
|
3Σu+ |
2σu |
3σg |
0.16 |
0.17 |
0.43 |
|
1Πu |
3σg |
1πux(1πuy) |
2.39 |
3.37 |
1.57 |
|
1Δg |
1πux(1πuy) |
1πux(1πuy) |
2.02 |
3.00 |
2.70 |
|
1Σg+ |
1πux(1πuy) |
1πuy(1πux) |
0.58 |
0.34 |
1.59 |
|
1Σu+ |
2σu |
3σg |
1.06 |
2.93 |
1.97 |
In addition, in Table 4 we compare our values with the experimental and theoretical results in ref. 17 for the Auger transitions from the 1σg and the 1σu core hole molecular states of N2+ to the 1Σg+(3σg3σg) and 1Σu+(2σu3σg) states. We find a very good agreement, while the agreement between the results in ref. 45 and 46 with ref. 17 is not as good. Moreover, we find that the sum of all Auger rates corresponding to a 1s core–hole is equal to 2.87 × 10⁻³ a.u. This value compares well with the experimental value of 3.77 × 10⁻³ a.u. obtained in ref. 29. We note that the Auger rates we use to solve the rate equations are summed over all allowed spin configurations. The reason for this is that spin is not specified in the electronic configurations of the molecular states.
Table 4 Auger rates to transition from the 1σg and the 1σu core hole molecular states of N2+ to the 1Σg+(3σg3σg) and 1Σu+(2σu3σg) states
|
|
1Σg+ |
1Σu+ |
Γ
exp = Γgexp + Γuexp![[thin space (1/6-em)]](https://www.rsc.org/images/entities/char_2009.gif) 17 17 |
1 |
1.55(8) |
Γ
th = Γgth + Γuth![[thin space (1/6-em)]](https://www.rsc.org/images/entities/char_2009.gif) 17 17 |
1 |
1.17 |
|
Γ
th
46
|
1 |
1.97 |
|
Γ
th
45
|
1 |
2.93 |
|
Γ
th (This work) |
1 |
1.53 |
Γ
gexp/Γuexp![[thin space (1/6-em)]](https://www.rsc.org/images/entities/char_2009.gif) 17 17 |
2.15(11) |
0.80(4) |
Γ
gth/Γuth![[thin space (1/6-em)]](https://www.rsc.org/images/entities/char_2009.gif) 17 17 |
1.98 |
1.00 |
|
Γ
gth/Γuth (this work) |
2.02 |
0.97 |
3 Results
Using the methods described in the previous sections, we compute the photo-ionization cross sections and the Auger transitions for all allowed molecular transitions up to N24+ for 525 eV and 1100 eV FEL pulses. N24+ is the highest molecular ion state that can be reached, since we assume that the N24+ state dissociates instantaneously. In addition, using the method we developed in ref. 10 we compute the Auger rates for all allowed atomic transitions while we obtain the atomic single-photon ionization cross sections from ref. 47. We solve 309 rate equations to obtain the ion yields and the electron spectra. In addition, in order to obtain the population of all accessible pathways, we solve roughly 1.8 × 10⁶ rate equations for the 525 eV FEL pulse and 6.6 × 10⁶ rate equations for the 1100 eV FEL pulse. The computation of the pathway population allows us to identify the percentage of the contribution of SCH versus DCH molecular states to the final atomic ion yields.
3.1 Ion yields
First, we compute the molecular and atomic ion yields for a 525 eV and a 1100 eV FEL pulses. For each photon energy we consider two different full width half maximum (FWHM) durations of the FEL pulse, namely 4 fs and 80 fs. In Fig. 2, we show the dependence on intensity of the molecular ion yields resulting from the interaction of N2 with four different FEL pulses. We find that only the N2 and N2+ states are populated a long time after the end of the FEL pulses. This is expected, since, in our model, all higher charged states eventually dissociate. We also find that after a certain intensity the population of both the N2 and the N2+ molecular states reduces significantly for all four FEL pulses considered. For the same photon energy FEL pulses, N2 and N2+ are depleted at a smaller intensity for the 80 fs FEL-pulse compared to the 4 fs one. Comparing the molecular ion yields of FEL pulses with the same FWHM but different photon energy, we find that depletion of N2 and N2+ occurs at a smaller intensity for the 525 eV FEL pulse. The reason for this is that the single-photo ionization cross sections for the molecular transitions, are larger for the 525 eV FEL pulse compared to the 1100 eV FEL pulse, for a certain intensity. It is important to note that N22+ states are not plotted in Fig. 2, since we assume that all N22+ states dissociate. However, experimentally it is found that N22+ contributes roughly 2% of the N+ atomic ion yield. This experimental finding combined with the results we present for the atomic ion yields in Fig. 3 allows us to estimate that the contribution of N22+ is of the order of magnitude of N2+ that is presented in Fig. 2.
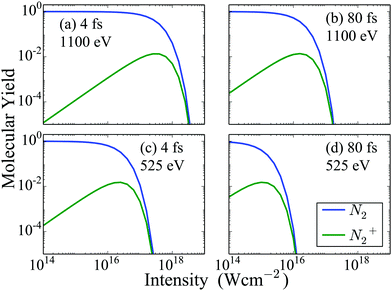 |
| | Fig. 2 Molecular ion yields resulting from the interaction of N2 with four FEL pulses as a function of the intensity of the laser pulse. For instance, a molecular ion yield of 0.1 for N2 means that 10% of all N2 molecules that interact with the laser pulse remain neutral while 90% ionize. | |
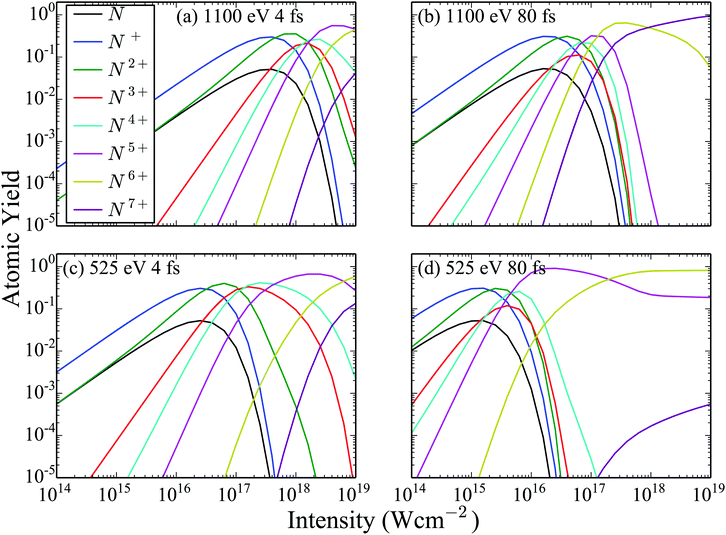 |
| | Fig. 3 Atomic ion yields resulting from the interaction of N2 with four FEL pulses as a function of the intensity of the laser pulse. | |
Next, in Fig. 3 we show the atomic ion yields for the same four FEL pulses as in Fig. 2 as a function of the laser intensity. Comparing the atomic ion yields of FEL pulses with the same photon energy but different FWHM, we find that the population of the higher charged states becomes significant at smaller intensities for the 80 fs FEL pulse compared to the 4 fs one. This is expected. A longer pulse with the same intensity means more photons per pulse than in a shorter pulse with the same intensity. Since it is not the intensity but the fluence that matters for single-photon ionization, the longer pulse will result in more ionization. Next, we compare the atomic ion yields of FEL pulses with the same FWHM but different photon energy. We find that the population of the higher charged states becomes significant at smaller intensities for the 525 eV FEL pulse compared to the 1100 eV one. The reason for this is that the single-photo ionization cross sections both for the atomic and the molecular transitions are higher for the 525 eV FEL pulse.
3.2 Comparison of atomic ion yields with experiment
To compare the ion yields of the final fragments with the experimental results in ref. 32, we take the FEL flux to be given by| | | J(x,y,t) = ρ(x,y)Γph(t), | (19) |
where the transverse beam profile is given by| |  | (20) |
with ρx = 2.2 μm and ρy = 1.2 μm in accord with the experimental parameters in ref. 32. The temporal profile for the rate of photons is given by| |  | (21) |
where Γph,0 is the maximum rate of photons| |  | (22) |
with  being the number of photons in a pulse with energy EP, where each photon has photon energy ω. τ is the full width at half maximum (FWHM) of the duration of the laser pulse. We note that we also multiply the pulse energy by a factor which accounts for the photon beam transport losses. The above analytic expression for the flux is also adopted in ref. 23. Computing the flux at different grid (x,y) points, we then solve the rate equations at each grid point and integrate over an area of 10 μm × 10 μm to obtain the final ion yields. In Fig. 4, we show the atomic ion yields we obtain for pulse durations of 4 fs, 7 fs and 80 fs. We find that our results are in very good agreement with the experimental results presented in ref. 23 and 32.
 |
| | Fig. 4 Atomic ion yields for FEL pulses of (a) pulse energy 0.15 mJ with 4 fs FWHM and 77% loss (b) pulse energy 0.26 mJ with 7 fs FWHM and 84% loss (c) pulse energy 0.26 mJ with 80 fs FWHM and 70% loss. Our results are compared with experimental results.23,32 | |
3.3 Single versus double core holes
We now compute all energetically accessible pathways that start from the N2 ground state and end at ion fragments up to N7+ for a 4 fs FEL pulse. We identify the contribution to the atomic ion yields of pathways that have accessed only a SCH molecular state versus pathways that have accessed a DCH molecular state. This contribution is shown in Fig. 5 for a 525 eV and a 1100 eV FEL pulse at different laser pulse intensities.
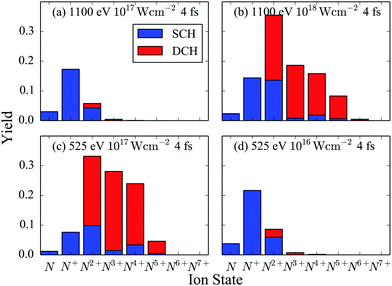 |
| | Fig. 5 Atomic ion yields for FEL pulses with 4 fs FWHM and photon energy of 525 eV and of 1100 eV. | |
First, we compare the results for two FEL pulses that have the same intensity of 1017 W cm−2 but different photon energy, see Fig. 5(a) and (c). We find that the population of the higher charged atomic ion states is much larger for the 525 eV FEL pulse. The reason for this is that the molecular and atomic photo-ionization cross sections as well as the photon flux are larger for the 525 eV FEL pulse. Another consequence of the larger molecular photo-ionization cross sections is that for the 525 eV FEL pulse it is more probable for a second core hole to be created by single-photon ionization before an Auger transition takes place. This explains why the DCH molecular states contribute significantly more than the SCH molecular states to the population of the higher charged atomic ions, see Fig. 5(c). However, if a smaller intensity of 1016 W cm−2 is considered for the 525 eV FEL pulse, see Fig. 5(d), then similar results are obtained as for the 1100 eV FEL pulse at an intensity of 1017 W cm−2, see Fig. 5(a). In Fig. 5(b), it is shown that when a higher intensity of 1018 W cm−2 is considered for the 1100 eV FEL pulse, similar results are obtained as for the 525 eV FEL at a smaller intensity, see Fig. 5(c). That is, higher charged atomic ion states are significantly populated and the DCH molecular states contribute significantly to these yields. The reason for this is that the higher intensity counteracts the effects from the single-photon ionization cross sections being smaller for the 1100 eV FEL pulse compared to the 525 eV FEL pulse.
Focusing on the 525 eV FEL pulse at an intensity of 1017 W cm−2, we now explain in detail the contribution of the DCH molecular states to the charged atomic ions, see Fig. 5(c). In Table 5 we show the dominant pathways leading to the formation of the atomic ions N, N+, N2+, N3+ and N4+. We find that the dominant pathways for the formation of N and N+ consist of a single-photon ionization from a core orbital PC followed by an Auger decay from valence electrons AVV or from a core hole and a valence electron ACV. This PCAVV sequence is then followed by dissociation (D) of N22+. Thus, N and N+ are formed mostly by a molecular pathway that does not access DCH states. N2+, N3+ and N4+ are formed by dissociation of predominantly N24+. N24+ is reached mostly through a molecular pathway that consists of a PCPC step, one AVV event and one ACV or AVV or PC event in all sequences that are energetically allowed denoted by {PCPC + AVV + ACV/AVV/PC}. All these latter pathways access DCH molecular states (PCPC step). However, dissociation of N24+ that has only valence holes plays a significant role in the formation of N2+ and N4+. Indeed, the molecular pathway PCAVVPCAVV contributes 21% to the formation of N2+ and 9% to the formation of N4+. This is not the case for N3+. Thus the contribution of DCH molecular states to the formation of N3+ is larger than the contribution to the formation of N4+.
Table 5 The % contribution to the atomic ion yields up to N4+ of the dominant pathways of ionization for a 4 fs FWHM, 525 eV photon energy and an intensity of 1017 W cm−2 FEL pulse. The pathway before the dissociation D is the molecular pathway of ionization
| N |
PCAVVD |
94% |
| N+ |
PCAVVD |
85% |
| N2+ |
{PCPC + AVV + ACV/AVV/PC}D |
62% |
| N2+ |
PCAVVPCAVVD |
21% |
| N3+ |
{PCPC + AVV + ACV/AVV/PC}DAVV |
79% |
| N4+ |
{PCPC + AVV + ACV/AVV/PC}D{PC/AVV + AVV} |
73% |
| N4+ |
PCAVVPCAVVDPCAVV |
9% |
3.4 Electron spectra
Using the molecular and atomic Auger and photo-ionization yields, we plot the probability for an electron to ionize with a certain energy, that is, we plot the electron spectra in Fig. 6. Specifically, we plot the electron spectra for 525 eV and 1100 eV FEL pulses at an intensity of 1017 W cm−2. For each photon energy two FWHM laser pulses are considered, namely of 4 fs and of 80 fs. Comparing the electron spectra corresponding to the same FWHM FEL pulse, i.e.Fig. 6(a) with Fig. 6(c) and Fig. 6(b) with Fig. 6(d), we find that there is a higher contribution of atomic transitions to the electron spectra for the 525 eV FEL pulse. As previously mentioned, the reason is that the molecular photo-ionization cross sections are larger for the smaller photon energy resulting in a larger population reaching higher charged molecular states which in turn dissociate into atomic ion fragments. The atomic photo-ionization cross sections are also higher for the 525 eV FEL pulse and so higher charged atomic ion states are thus reached. Moreover, comparing the electron spectra corresponding to the same photon energy FEL pulse, i.e.Fig. 6(a) with Fig. 6(b) and Fig. 6(c) with Fig. 6(d) we find that there is a higher contribution of atomic transitions to the electron spectra for the longer duration, 80 fs, FEL pulse. The longer pulse duration allows for a larger number of photo-ionization processes to take place which in turn leads to the production of more higher charged atomic ion states. We also note that for the 525 eV FEL pulse the electrons can escape with small energies and that single-photon molecular transitions play an important role, see inset in Fig. 6(c). Thus, the formulation of the Auger and of the photo-ionization rates using molecular and not atomic continuum orbitals is more important for small photon energies and for small duration laser pulses.
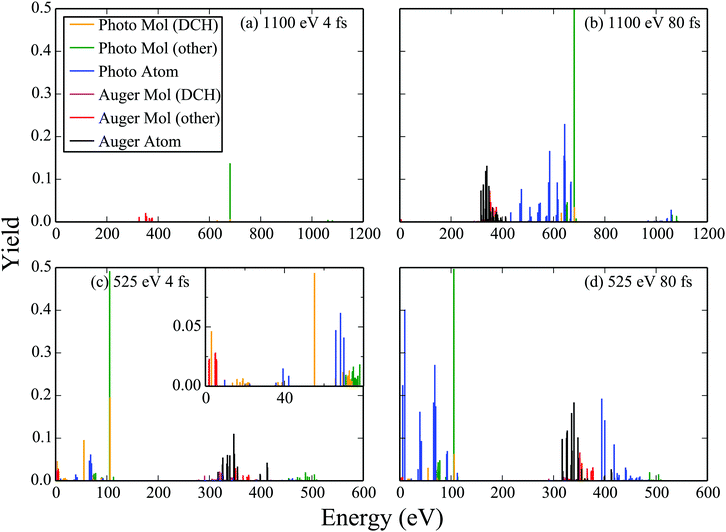 |
| | Fig. 6 Electron spectra resulting from the interaction of N2 with FEL pulses at an intensity of 1017 W cm−2. | |
We now investigate whether studying electron spectra is an efficient way of detecting the formation of DCH molecular states. To answer this question we plot the contribution to the Auger and photo-ionization yields of DCH molecular states. We find that the contribution to the electron spectra of DCH Auger molecular transitions is difficult to distinguish and overlaps with Auger atomic transitions. However, the DCH single-photon ionization molecular transitions are easier to distinguish. For instance there is a clear peak in the electron spectra due to DCH single-photon ionization molecular transitions at around 55 eV for the case of the 525 eV 4 fs FEL pulse. This result confirms that photoionization electron spectra is a viable route for the detection of DCH molecular transitions as already implied by the large number of photoelectron studies.48–51
4 Conclusions
We investigate the interaction of molecular nitrogen with FEL radiation. We compute molecular continuum orbitals in the single center expansion scheme and use these orbitals to compute the Auger rates and photo-ionization cross-sections for molecular nitrogen. Formulating rate equations for all energetically accessible molecular and atomic transitions, we investigate the dependence of the final fragments yields on the parameters of the FEL pulse. Moreover, we study the contribution of the DCH molecular states to the final atomic ion yields. We find that for a relatively small photon energy of 525 eV, with 420 eV being the photon energy needed to create a core hole, already at intermediate intensities, DCH molecular states contribute significantly to the formation of the final atomic ion fragments. Finally, we compute the contribution of the Auger and the single-photon ionization processes in the electron spectra. Our results suggest that single-photon ionization processes are a more efficient tool for detecting the formation of DCH molecular states in the electron spectra in agreement with previous experimental studies. Future studies will address in detail the effect of nuclear motion.
Appendix
A Rate equations
The rate equations describing the population  of a molecular ion state j take the form
| | 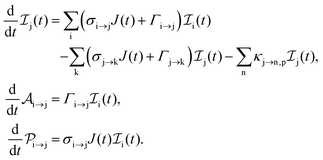 | (23) |
σi→j and Γi→j are the molecular single-photon absorption cross section and Auger decay rate, respectively, from the initial molecular state i to the final molecular state j. J(t) is the photon flux at time t. The temporal form of the FEL flux is modeled with a Gaussian function given by52| |  | (24) |
with τ the full width at half maximum (FWHM) and I0 the peak intensity. The molecular states i, j and k have charges q − 1, q and q + 1, respectively. κj→n,p denotes the dissociation rate from the initial molecular state j with charge q to the final atomic states n and p. The atomic states n and p have total charge equal to q. For the dissociation cases currently considered, for each atomic final fragment n there is only one atomic final fragment p. The first term in eqn (23) accounts for the formation of the molecular state j through the single-photon ionization and Auger decay of the molecular state i. The second term in eqn (23) accounts for the depletion of the molecular state j by transitioning to a molecular state k through single-photon ionization and Auger decay. The third term accounts for the depopulation of the molecular state j through dissociation to the atomic states n and p. These rate equations, eqn (23), are used to calculate the molecular ion yields. In addition, in eqn (23), we solve for the Auger  and the photo-ionization
  yield from an initial molecular state i with charge q − 1 to a final molecular state j with charge q.
The rate equations describing the populations of an atomic state n take the form
| | 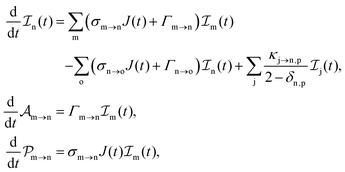 | (25) |
where the indices n, m and o refer to atomic states with charges,
q,
q − 1 and
q + 1, respectively, while j refers to molecular states. The first term in
eqn (25) accounts for the formation of the atomic state n through the single-photon ionization and Auger decay of the atomic state m. The second term in
eqn (25) accounts for the depletion of the atomic state n by transitioning to an atomic state o through single-photon ionization and Auger decay. The third term in
eqn (25) accounts for the population of state n as a result of dissociative transitions from a molecular state j. The factor

conserves the population transfer from the molecular state j. Namely, if the molecular state results in the same two atomic fragments the factor is equal to 1. If fragmentation results in two different atomic fragments the factor is equal to

, since a rate equation is formulated for each atomic fragment separately. As in the molecular rate equations, in
eqn (25), we solve for the Auger

and the photo-ionization

yields from an initial atomic state i with charge
q − 1 to a final atomic state j with charge
q. We note that
eqn (23) and
eqn (25) are solved simultaneously. We obtain the molecular and atomic ion yields long after the end of the laser pulse.
The three types of rate equations used to compute the population through a specific pathway i → j → k are given by eqn (26)–(28)
| | 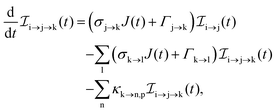 | (26) |
| |  | (27) |
| |  | (28) |
The indices i, j, k and l refer to molecular states whereas the indices m, n and o refer to atomic states.
Eqn (26) computes molecular pathway populations,
eqn (27) computes pathway populations where the final state is an atomic one, but the previous states were molecular. Pathway populations where the final and the previous states are atomic ones are computed using
eqn (28). Solving
eqn (26)–(28), allows us to register all energetically-allowed pathways.
B Direct and exchange coefficients
In the Hartree–Fock framework, after applying the variational principle,38 the electron–electron interaction terms can be written as| |  | (29) |
where ϕε is the spin–orbital of the molecular continuum electron with spin orientation με and εee is the energy contribution of the electron–electron interaction terms. The index i refers to a bound molecular orbital and Ji and Ki are defined as| | 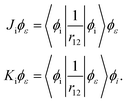 | (30) |
To obtain the ai and bi coefficients in the general case, it suffices to obtain ai and bi for three limiting cases. Since we consider molecular orbitals in all three limiting cases, the electron occupancy of the shells involved is zero, one or two. If a shell is not occupied, the coefficients ai and bi are zero. For the first limiting case, a two-electron system is considered, with both electrons initially occupying a single shell i and one of these electrons finally being emitted to the continuum. Spin is conserved and it is equal to zero in the initial and final states. Therefore, a two-electron wavefunction must be constructed that is anti-symmetric in spin and anti-symmetric under exchange of electrons. Such a wavefunction is given as a sum of the following two Slater determinants| |  | (31) |
where q1 and q2 are the spin and space coordinates of the two electrons. Using spin conservation and exchange symmetry, it is found that the energy contribution of the electron–electron interaction term is given by| |  | (32) |
Using the variational principle in the Hartree–Fock equations scheme38 for the continuum orbital, the following equations are obtainedComparing eqn (29) and (33), we find that ai = 1 and bi = −1.
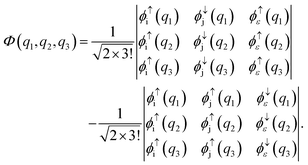
Another limiting case involves two shells i and j. In the initial state one electron is in shell i and two electrons occupy shell j. In the final state one electron from the j shell escapes to the continuum. A three-electron wavefunction must be constructed which is anti-symmetric in spin regarding the continuum electron and the electron in the j shell and anti-symmetric under exchange of electrons. Such a wavefunction is given as a sum of the following two Slater determinants
| |  | (34) |
Following the same procedure as for the other limiting case, the following equations are obtained
| |  | (35) |
Comparing eqn (29) and (35), it is found that aj = 1 and bj = −1, while ai = 1 and  .
.
The third limiting case involves two electrons occupying shell i and two electrons occupying shell j in the initial state, with one electron from orbital j escaping to the continuum in the final state. Following the same procedure as in the other two cases, it can be shown that ai = 2 and bi = 1 and aj = 1 and bj = −1. In general, for all molecular ion states, in the Hartree–Fock formalism, the occupation coefficients ai and bi can be obtained using the above three limiting cases.
Acknowledgements
A. E. is grateful to Peter Lambropoulos for pointing out DCH formation as an interesting problem in molecules interacting with FEL pulses. A. E. acknowledges the use of the Legion computational resources at UCL.
References
- C. Pellegrini, Eur. Phys. J. H, 2012, 37, 659–708 CrossRef.
- J. Marangos, Contemp. Phys., 2011, 52, 551–569 CrossRef CAS.
- J. Ullrich, A. Rudenko and R. Moshammer, Annu. Rev. Phys. Chem., 2012, 63, 635–660 CrossRef CAS PubMed.
- I. Schlichting and J. Miao, Curr. Opin. Struct. Biol., 2012, 22, 613–626 CrossRef CAS PubMed.
- R. Neutze, R. Wouts, D. van der Spoel, E. Weckert and J. Hajdu, Nature, 2000, 406, 752–757 CrossRef CAS PubMed.
- L. Redecke, K. Nass, D. P. DePonte, T. A. White, D. Rehders, A. Barty, F. Stellato, M. Liang, T. R. Barends, S. Boutet, G. J. Williams, M. Messerschmidt, M. M. Seibert, A. Aquila, D. Arnlund, S. Bajt, T. Barth, M. J. Bogan, C. Caleman, T.-C. Chao, R. B. Doak, H. Fleckenstein, M. Frank, R. Fromme, L. Galli, I. Grotjohann, M. S. Hunter, L. C. Johansson, S. Kassemeyer, G. Katona, R. A. Kirian, R. Koopmann, C. Kupitz, L. Lomb, A. V. Martin, S. Mogk, R. Neutze, R. L. Shoeman, J. Steinbrener, N. Timneanu, D. Wang, U. Weierstall, N. A. Zatsepin, J. C. H. Spence, P. Fromme, I. Schlichting, M. Duszenko, C. Betzel and H. N. Chapman, Science, 2013, 339, 227–230 CrossRef CAS PubMed.
- L. S. Cederbaum, F. Tarantelli, A. Sgamellotti and J. Schirmer, J. Chem. Phys., 1986, 85, 6513–6523 CrossRef CAS.
- M. Tashiro, M. Ehara, H. Fukuzawa, K. Ueda, C. Buth, N. V. Kryzhevoi and L. S. Cederbaum, J. Chem. Phys., 2010, 132, 184302 CrossRef.
- H. Pulkkinen, S. Aksela, O.-P. Sairanen, A. Hiltunen and H. Aksela, J. Phys. B: At., Mol. Opt. Phys., 1996, 29, 3033 CrossRef CAS.
- A. O. G. Wallis, H. I. B. Banks and A. Emmanouilidou, Phys. Rev. A: At., Mol., Opt. Phys., 2015, 91, 063402 CrossRef.
- P. Lablanquie, L. Andric, J. Palaudoux, U. Becker, M. Braune, J. Viefhaus, J. Eland and F. Penent, J. Electron Spectrosc. Relat. Phenom., 2007, 156–158, 51–57 CrossRef CAS.
- C. P. Bhalla, N. O. Folland and M. A. Hein, Phys. Rev. A: At., Mol., Opt. Phys., 1973, 8, 649–657 CrossRef CAS.
- S.-K. Son and R. Santra, Phys. Rev. A: At., Mol., Opt. Phys., 2012, 85, 063415 CrossRef.
- M. G. Makris, P. Lambropoulos and A. Mihelič, Phys. Rev. Lett., 2009, 102, 033002 CrossRef CAS PubMed.
- P. Bolognesi, M. Coreno, L. Avaldi, L. Storchi and F. Tarantelli, J. Chem. Phys., 2006, 125, 054306 CrossRef PubMed.
- V. Feyer, P. Bolognesi, M. Coreno, K. C. Prince, L. Avaldi, L. Storchi and F. Tarantelli, J. Chem. Phys., 2005, 123, 224306 CrossRef CAS PubMed.
- R. Püttner, H. Fukuzawa, X.-J. Liu, S. K. Semenov, N. A. Cherepkov, T. Tanaka, M. Hoshino, H. Tanaka and K. Ueda, J. Phys. B: At., Mol. Opt. Phys., 2008, 41, 141001 CrossRef.
- H. Iwayama, N. Sisourat, P. Lablanquie, F. Penent, J. Palaudoux, L. Andric, J. H. D. Eland, K. Bučar, M. Žitnik, Y. Velkov, Y. Hikosaka, M. Nakano and E. Shigemasa, J. Chem. Phys., 2013, 138, 024306 CrossRef CAS PubMed.
- L. Storchi, F. Tarantelli, S. Veronesi, P. Bolognesi, E. Fainelli and L. Avaldi, J. Chem. Phys., 2008, 129, 154309 CrossRef CAS PubMed.
- S. Sorensen, C. Miron, R. Feifel, M.-N. Piancastelli, O. Björneholm and S. Svensson, Chem. Phys. Lett., 2008, 456, 1–6 CrossRef CAS.
- W. J. Griffiths, N. Correia, M. P. Keane, A. N. de Brito, S. Svensson and L. Karlsson, J. Phys. B: At., Mol. Opt. Phys., 1991, 24, 4187 CrossRef CAS.
- C. Buth, J. P. Cryan, J. M. Glownia, M. Hoener, R. N. Coffee and N. Berrah, J. Chem. Phys., 2012, 136, 214310 CrossRef PubMed.
- J.-C. Liu, N. Berrah, L. S. Cederbaum, J. P. Cryan, J. M. Glownia, K. J. Schafer and C. Buth, J. Phys. B: At., Mol. Opt. Phys., 2016, 49, 075602 CrossRef.
- Y. Hao, L. Inhester, K. Hanasaki, S.-K. Son and R. Santra, Struct. Dyn., 2015, 2, 041707 CrossRef PubMed.
- Z. Jurek, S.-K. Son, B. Ziaja and R. Santra, J. Appl. Crystallogr., 2016, 49, 1048–1056 CrossRef CAS.
- L. Inhester, K. Hanasaki, Y. Hao, S.-K. Son and R. Santra, Phys. Rev. A, 2016, 94, 023422 CrossRef.
- L. Fang, T. Osipov, B. Murphy, F. Tarantelli, E. Kukk, J. P. Cryan, M. Glownia, P. H. Bucksbaum, R. N. Coffee, M. Chen, C. Buth and N. Berrah, Phys. Rev. Lett., 2012, 109, 263001 CrossRef CAS PubMed.
- B. Erk, D. Rolles, L. Foucar, B. Rudek, S. W. Epp, M. Cryle, C. Bostedt, S. Schorb, J. Bozek, A. Rouzee, A. Hundertmark, T. Marchenko, M. Simon, F. Filsinger, L. Christensen, S. De, S. Trippel, J. Küpper, H. Stapelfeldt, S. Wada, K. Ueda, M. Swiggers, M. Messerschmidt, C. D. Schröter, R. Moshammer, I. Schlichting, J. Ullrich and A. Rudenko, Phys. Rev. Lett., 2013, 110, 053003 CrossRef CAS PubMed.
- L. Fang, M. Hoener, O. Gessner, F. Tarantelli, S. T. Pratt, O. Kornilov, C. Buth, M. Gühr, E. P. Kanter, C. Bostedt, J. D. Bozek, P. H. Bucksbaum, M. Chen, R. Coffee, J. Cryan, M. Glownia, E. Kukk, S. R. Leone and N. Berrah, Phys. Rev. Lett., 2010, 105, 083005 CrossRef CAS PubMed.
- J. P. Cryan, J. M. Glownia, J. Andreasson, A. Belkacem, N. Berrah, C. I. Blaga, C. Bostedt, J. Bozek, N. A. Cherepkov, L. F. DiMauro, L. Fang, O. Gessner, M. Gühr, J. Hajdu, M. P. Hertlein, M. Hoener, O. Kornilov, J. P. Marangos, A. M. March, B. K. McFarland, H. Merdji, M. Messerschmidt, V. S. Petrovi, C. Raman, D. Ray, D. A. Reis, S. K. Semenov, M. Trigo, J. L. White, W. White, L. Young, P. H. Bucksbaum and R. N. Coffee, J. Phys. B: At., Mol. Opt. Phys., 2012, 45, 055601 CrossRef.
- K. Ueda, R. Püttner, N. A. Cherepkov, F. Gel'mukhanov and M. Ehara, Eur. Phys. J.: Spec. Top., 2009, 169, 95–107 CrossRef.
- M. Hoener, L. Fang, O. Kornilov, O. Gessner, S. T. Pratt, M. Gühr, E. P. Kanter, C. Blaga, C. Bostedt, J. D. Bozek, P. H. Bucksbaum, C. Buth, M. Chen, R. Coffee, J. Cryan, L. DiMauro, M. Glownia, E. Hosler, E. Kukk, S. R. Leone, B. McFarland, M. Messerschmidt, B. Murphy, V. Petrovic, D. Rolles and N. Berrah, Phys. Rev. Lett., 2010, 104, 253002 CrossRef CAS PubMed.
- K. Ueda, Science, 2008, 320, 884–885 CrossRef CAS PubMed.
-
H. J. Werner, P. J. Knowles, R. Lindh, F. R. Manby and M. Schütz, et al., MOLPRO, a package of ab initio programs, 2010, see http://www.molpro.net/ Search PubMed.
- C. Beylerian and C. Cornaggia, J. Phys. B: At., Mol. Opt. Phys., 2004, 37, L259 CrossRef CAS.
- M. Coville and T. D. Thomas, Phys. Rev. A: At., Mol., Opt. Phys., 1991, 43, 6053–6056 CrossRef CAS.
- P. V. Demekhin, A. Ehresmann and V. L. Sukhorukov, J. Chem. Phys., 2011, 134, 024113 CrossRef PubMed.
-
B. Bransden and C. Joachain, Physics of Atoms and Molecules, Prentice-Hall, 2002 Search PubMed.
-
B. W. Shore and D. H. Menzel, Principles of Atomic Spectra, Wiley, 1968 Search PubMed.
-
J. J. Sakurai, Modern Quantum Mechanics, Addison-Wesley, 1994 Search PubMed.
- S. K. Semenov, N. A. Cherepkov, G. H. Fecher and G. Schönhense, Phys. Rev. A: At., Mol., Opt. Phys., 2000, 61, 032704 CrossRef.
-
W. Pauli, Wave Mechanics: of Pauli Lectures on Physics, Wiley, 2000, vol. 5, pp. 150–151 Search PubMed.
- R. Manne and H. Ågren, Chem. Phys., 1985, 93, 201–208 CrossRef CAS.
-
L. Inhester, PhD thesis, Georg-August-Universität Göttingen, 2013.
- C. M. Liegener, J. Phys. B: At. Mol. Phys., 1983, 16, 4281 CrossRef CAS.
- H. Ågren, J. Chem. Phys., 1981, 75, 1267–1283 CrossRef.
- Los Alamos National Laboratory Atomic Physics Codes; see http://aphysics2.lanl.gov/tempweb/lanl/.
- N. Berrah, L. Fang, B. Murphy, T. Osipov, K. Ueda, E. Kukk, R. Feifel, P. van der Meulen, P. Salen, H. T. Schmidt, R. D. Thomas, M. Larsson, R. Richter, K. C. Prince, J. D. Bozek, C. Bostedt, S.-i. Wada, M. N. Piancastelli, M. Tashiro and M. Ehara, Proc. Natl. Acad. Sci. U. S. A., 2011, 108, 16912–16915 CrossRef CAS PubMed.
- P. Salén, P. van der Meulen, H. T. Schmidt, R. D. Thomas, M. Larsson, R. Feifel, M. N. Piancastelli, L. Fang, B. Murphy, T. Osipov, N. Berrah, E. Kukk, K. Ueda, J. D. Bozek, C. Bostedt, S. Wada, R. Richter, V. Feyer and K. C. Prince, Phys. Rev. Lett., 2012, 108, 153003 CrossRef PubMed.
- J. Eland, S. Plogmaker, P. Lablanquie, F. Penent, J. Palaudoux, C. Nicolas, E. Robert, C. Miron and R. Feifel, Chem. Phys. Lett., 2016, 646, 31–35 CrossRef CAS.
- M. Nakano, F. Penent, M. Tashiro, T. P. Grozdanov, M. Z. Žitnik, S. Carniato, P. Selles, L. Andric, P. Lablanquie, J. Palaudoux, E. Shigemasa, H. Iwayama, Y. Hikosaka, K. Soejima, I. H. Suzuki, N. Kouchi and K. Ito, Phys. Rev. Lett., 2013, 110, 163001 CrossRef CAS PubMed.
- N. Rohringer and R. Santra, Phys. Rev. A: At., Mol., Opt. Phys., 2007, 76, 033416 CrossRef.
|
| This journal is © the Owner Societies 2017 |
Click here to see how this site uses Cookies. View our privacy policy here.  Open Access Article
 *
*
 of a molecular ion state j. In addition, we solve for the Auger
  and the photo-ionization
  yield from an initial molecular state i with charge q − 1 to a final molecular state j with charge q. These yields provide the probability for observing an electron with energy corresponding to the molecular transition i → j. We use these yields to describe the molecular transitions in the electron spectra produced by the interaction of N2 with an FEL pulse. The electron spectra are presented later in the paper. We also formulate rate equations to describe the population of an atomic state n. We also solve for the Auger
  and the photo-ionization
  yields from an initial atomic state m with charge q − 1 to a final atomic state n with charge q. These yields provide the probability for observing an electron with energy corresponding to the atomic transition m → n. We use these yields to describe the atomic transitions in the electron spectra produced by the interaction of N2 with an FEL pulse. It is also of interest to compute the population transfer through a specific pathway i → j → k where the initial state is i and the final one that is k is reached through the state j. Each pathway starts from the ground state of N2 and ends at an accessible atomic or molecular ion state. Obtaining the pathway populations allows to determine the percentage of final ion states that were formed through pathways involving molecular states with only a single or a double core hole. These results are presented later in the paper. For a detailed description of the rate equations, see Appendix A.


 is the electron–nuclei interaction,
  is the direct interaction term, and Xlm[
![[P with combining macron]](https://www.rsc.org/images/entities/i_char_0050_0304.gif) ε](r) is the exchange interaction term. In eqn (3), we are solving for
ε](r) is the exchange interaction term. In eqn (3), we are solving for  , which are the coefficients in the SCE of the continuum wavefunction.
 ![[P with combining macron]](https://www.rsc.org/images/entities/i_char_0050_0304.gif) ε is the vector form of
ε is the vector form of  . The electron–nuclei interaction
  is given by


 are obtained solving eqn (3) with the non-iterative method described in ref. 37. Diatomic molecules have rotational symmetry around the molecular axis and thus m is a good quantum number. Therefore, m2 and m3 are equal and have a fixed value for a bound orbital i. In addition, m and m′ are equal and have a fixed value determined by the symmetry of the continuum orbital. For the N2 diatomic molecule, we find that convergence of the continuum orbital is achieved when considering l up to 19 for the single center expansion. As a result, for each energy ε, eqn (3) has at the most 20 degenerate solutions.


 denotes a summation over the final states and an average over the initial states. |Ψ〉 is the wavefunction of all electrons in the molecular state. In the Hartree–Fock approximation, |Ψ〉 is given by a Slater determinant of one-electron spin–orbital wavefunctions. The Auger transition is treated as a two-electron process and therefore the relevant part of HI is the electron–electron Coulomb interaction term. In the second quantization formalism,43,44 this Hamiltonian term is given by


 is the spatial part of the matrix element
  which is given by


 . Using the orthogonality of the molecular states, it follows that the 1s Auger rates are obtained by averaging the Auger rates of the 1σg and 1σu core hole molecular states. In the work in ref. 45, only relative values of the Auger rates are given. Specifically, the ratio of each Auger rate with respect to the transition is given. To compare the results in ref. 45 with our values we divide each Auger transition by the sum of all Auger transitions for a 1s core–hole state. The resulting values are shown in Table 2 and the agreement is shown to be overall good. The agreement between some of the Auger rates we compute in the current work and the Auger rates in ref. 45 is not as good. We believe this is due to the different techniques employed to compute the Auger rates. This is supported by further comparing Auger rates computed in the current work with results for Auger rates given in ref. 45 and 46. In the latter work, the author employs a Configuration Interaction calculation to compute the Auger rates of N2+ with a 1s core hole. As in ref. 45, in ref. 46 only relative values of the Auger rates are given. In Table 3 we compare the ratio of some 1s Auger rates with the Auger rate for the transition to the 1Σg+ state with 3σg electrons filling in the core hole and being ejected to the continuum; we denote this final state by 1Σg+(3σg3σg). We find that any two techniques agree only for some of the transitions shown in Table 3.


 being the number of photons in a pulse with energy EP, where each photon has photon energy ω. τ is the full width at half maximum (FWHM) of the duration of the laser pulse. We note that we also multiply the pulse energy by a factor which accounts for the photon beam transport losses. The above analytic expression for the flux is also adopted in ref. 23. Computing the flux at different grid (x,y) points, we then solve the rate equations at each grid point and integrate over an area of 10 μm × 10 μm to obtain the final ion yields. In Fig. 4, we show the atomic ion yields we obtain for pulse durations of 4 fs, 7 fs and 80 fs. We find that our results are in very good agreement with the experimental results presented in ref. 23 and 32.


 of a molecular ion state j take the form

 and the photo-ionization
  yield from an initial molecular state i with charge q − 1 to a final molecular state j with charge q.

 conserves the population transfer from the molecular state j. Namely, if the molecular state results in the same two atomic fragments the factor is equal to 1. If fragmentation results in two different atomic fragments the factor is equal to
  , since a rate equation is formulated for each atomic fragment separately. As in the molecular rate equations, in eqn (25), we solve for the Auger
  and the photo-ionization
  yields from an initial atomic state i with charge q − 1 to a final atomic state j with charge q. We note that eqn (23) and eqn (25) are solved simultaneously. We obtain the molecular and atomic ion yields long after the end of the laser pulse.


 .
.

![[thin space (1/6-em)]](https://www.rsc.org/images/entities/char_2009.gif)

