 Open Access Article
Creative Commons Attribution 3.0 Unported Licence
Nonlinear optical properties, upconversion and lasing in metal–organic frameworks
Raghavender
Medishetty†
 a,
Jan K.
Zaręba†
 b,
David
Mayer
 a,
Marek
Samoć
 *b and
Roland A.
Fischer
 *a
*a
aChair for Inorganic and Metal-Organic Chemistry, Technische Universität München, Lichtenbergstraße 4, D-85747 Garching, Germany. E-mail: roland.fischer@tum.de
bAdvanced Materials Engineering and Modelling Group, Faculty of Chemistry, Wrocław University of Science and Technology, Wybrzeże Wyspiańskiego 27, 50-370 Wrocław, Poland. E-mail: marek.samoc@pwr.edu.pl
First published on 16th June 2017
Abstract
The building block modular approach that lies behind coordination polymers (CPs) and metal–organic frameworks (MOFs) results not only in a plethora of materials that can be obtained but also in a vast array of material properties that could be aimed at. Optical properties appear to be particularly predetermined by the character of individual structural units and by the intricate interplay between them. Indeed, the “design principles” shaping the optical properties of these materials seem to be well explored for luminescence and second-harmonic generation (SHG) phenomena; these have been covered in numerous previous reviews. Herein, we shine light on CPs and MOFs as optical media for state-of-the-art photonic phenomena such as multi-photon absorption, triplet–triplet annihilation (TTA) and stimulated emission. In the first part of this review we focus on the nonlinear optical (NLO) properties of CPs and MOFs, with a closer look at the two-photon absorption property. We discuss the scope of applicability of most commonly used measurement techniques (Z-scan and two-photon excited fluorescence (TPEF)) that can be applied for proper determination of the NLO properties of these materials; in particular, we suggest recommendations for their use, along with a discussion of the best reporting practices of NLO parameters. We also outline design principles, employing both intramolecular and intermolecular strategies, that are necessary for maximizing the NLO response. A review of recent literature on two-, three- and multi-photon absorption in CPs and MOFs is further supplemented with application-oriented processes such as two-photon 3D patterning and data storage. Additionally, we provide an overview of the latest achievements in the field of frequency doubling (SHG) and tripling (third-harmonic generation, THG) in these materials. Apart from nonlinear processes, in the next sections we also target the photonic properties of MOFs that benefit from their porosity, and resulting from this their ability to serve as containers for optically-active molecules. Thus, we survey dye@MOF composites as novel media in which efficient upconversion via triplet energy migration (TEM) occurs as well as materials for stimulated emission and multi-photon pumped lasing. Prospects for producing lasing as an intrinsic property of MOFs has also been discussed. Overall, further development of the optical processes highlighted herein should allow for realization of various photonic, data storage, biomedical and optoelectronic applications.
1. Introduction
Nonlinear optical (NLO) effects occurring upon exposure of materials to high intensity laser light constitute highly interesting photo-physical behaviour, which has a wide variety of applications, from optoelectronics to medicine.1–3 Various frequency upconversion effects originating from NLO effects permit the use of bio-safe infra-red photons, instead of higher energy ones for numerous applications and devices.4 Such NLO applications have been significantly studied in a number of material classes, including a vast variety of dye molecules and inorganic (nano)particles. However, the materials in common use nowadays face several practical problems which limit their applications.5–8 Although organic and organometallic dyes have shown sizeable NLO properties in a wide range of wavelengths, leading to efficient frequency upconversion processes, their photo- and thermal-stability are often limited. They are usable mostly in diluted solutions, the concentration quenching of fluorescence being among the primary concerns. On the other hand, inorganic materials such as quantum dots, plasmonic particles or lanthanide-doped nanocrystals show higher resistance to photobleaching, but the applications of these materials are also limited by factors such as insufficient performance, limited wavelength tunability and toxicity, especially in the case of heavy metal containing materials. In this regard, solid-state hybrid materials appear to be the most promising candidates whose great tailorability could overcome such challenges,9 especially promising being coordination polymers (CPs) and metal–organic frameworks (MOFs).MOFs and CPs are hybrid materials, which are constructed employing modular synthetic procedures with metal/metal-cluster nodes being bridged by organic linkers that control their architecture and functionality. These materials have been recognised as potential candidates for various applications, from gas sorption and separation to luminescent materials including sensing, to medicinal applications.10–13 With respect to spectroscopic properties, the coordination of organic linkers to metal nodes often results in enhanced photo-physical behaviour which is driven by the weakening of non-radiative (radiationless) energy decay mechanisms (for example, those involving rotation of phenyl rings) due to the restricted conformation of the linker between the metal centres.14–18 This highlights the uniqueness of the optical properties of MOFs compared to other materials. MOFs are therefore supposed to be among the most promising candidates to exploit NLO properties in the solid-state and a judicious choice of metal/metal-clusters and organic linkers, which can be connected in various ways, can lead to convenient tuning of the NLO properties.
To date, NLO studies have mostly been limited to the second-harmonic generation (SHG)19–24 and only in recent years have a few publications appeared, in which other NLO properties such as multi-photon absorption and third-harmonic generation were explored. Also, recent reports introduced into the MOF discipline other advanced photonic applications and phenomena, such as up-conversion via triplet–triplet annihilation as well as lasing and stimulated emission. Although these processes are not “true” members of the family of nonlinear optical effects, since their mechanisms do not involve simultaneous absorption (or more generally – interaction) of more than one photon, they are elicited with the use of lasers, similar to aforementioned NLO phenomena. Indeed, in the selection of the scope to be covered in this review, we wanted to look more broadly than only the rigorously defined NLO phenomena – we have taken as a common denominator the interaction of MOFs with radiation of high intensity. As we will show, studies on the use of MOFs in photonics, predominantly experimental, are still in their infancy, thus we refrain here from making hasty generalizations. Where possible, we rather attempted to draw guidelines comparing CPs and MOFs with molecular materials, supporting our findings with several case studies already reported for MOFs.
Interaction of high power laser radiation with matter may result in a number of simultaneously occurring effects, which necessitates the careful choice of the details of a measurement technique to “extract” the information on the desired phenomenon. Since NLO studies seem to be especially demanding in this respect, we not only felt the need to point out limitations and application ranges of commonly used measurement techniques, but also wished to suggest certain reporting standards for NLO parameters of MOFs.
2. Theoretical background of nonlinear optics
Although two phenomena generally considered as belonging to the domain of nonlinear optics: the Pockels effect and the Kerr effect, have been known since the 19th century, it was the invention of the laser in 1960 that started quick developments in the knowledge of nonlinear optical (NLO) effects and the materials that could be used successfully for the observation and practical implementation of such effects. NLO effects are usually defined as arising from changes in the optical response of a material due to the presence of high light intensities, or, e.g. in the case of the Pockels effect (linear electrooptic effect) the presence of an electric field of lower than optical frequency, applied externally. Since the light intensity is proportional to the square of the amplitude of the oscillating electrical field associated with the electromagnetic wave, the most common introduction to nonlinear optics starts from a generic expression relating the polarization vector P of a unit volume of a material to the electric vector F acting on it, defining susceptibilities of various orders, χ(n):| Pi/ε0 = χ(1)ijFj + χ(2)ijkFjFk + χ(3)ijklFjFkFl +⋯ | (1) |
For advanced NLO materials in practical applications, the NLO effects that have the highest importance are: frequency mixing (including second-harmonic generation and parametric amplification), the electrooptic (Pockels) effect, nonlinear refraction and nonlinear absorption (mostly two-photon absorption). The two former processes are second-order effects described by susceptibilities χ(2)(−ω1 − ω2; ω1, ω2) and χ(2)(−ω; 0, ω), respectively, while the latter two are due to the real and imaginary parts of the degenerate third-order susceptibility χ(3)(−ω; ω, −ω, ω). Instead of the values of susceptibilities one often uses more engineering-oriented quantities like the second-harmonic generation coefficient dij, the Pockels coefficient rij (these two quantities, while being rank three tensors, are typically presented in the notation with contracted indices, i.e. as 3 × 6 or 6 × 3 matrices, respectively), the nonlinear refractive index n2, and the nonlinear absorption coefficient α2. It needs to be stressed that the second-order NLO phenomena described by the χ(2) tensor are only allowed in the absence of a centre of symmetry and are highly dependent on the details of the structure of a material, however, third-order phenomena are present in all materials and very often are investigated or exploited in isotropic media. Thus, even though n2 and α2 should be treated as tensors, it is rarely done.
Research on materials with maximized NLO response has been covering many classes of chemical compounds, especially much work has been done on molecular materials.25 The usual way of thinking in terms of the NLO properties of such media is that the response can be treated as the sum of responses coming from individual molecules, after taking into account their orientation in the material (i.e. using the “oriented gas” model) and introducing the local field correction that accounts for the fact that the electric field, acting on a molecule, is modified from its value in a vacuum by fields coming from the induced dipoles of the neighbouring molecules. The molecular analogue of eqn (1) is:
| μi = αijFlocj + βijkFlocjFlock + γijklFlocjFlockFlocl + ⋯ | (2) |
In this context, the advent of increased interest in the NLO properties of coordination polymers and MOFs appears to bring several interesting issues. First of all, the suitability of eqn (1) and (2) for the description of NLO effects is limited by the fact that these equations only take into account effects that are due to electric dipoles. This excludes important material properties related to the presence of magnetic fields and chiro-optic properties: both being of interest for materials such as MOFs. The second difficulty is that the “molecular” approach may not be fully suitable for the description of electromagnetic field interaction with a material that is not a molecular crystal but is built by interactions that are much stronger than van der Waals forces.
3. Design of two-photon absorbing CPs and MOFs
Optimizing photonic applications of CPs and MOFs that rely on the two-photon absorption process needs understanding of structure–property relationships, which would allow for conscious design of both absorption and emission properties. For prospective applications, such as (bio)imaging or (bio)sensing a crucial merit factor is the product of the luminescence quantum yield and of two-photon absorption cross section (φσ2), called also two-photon brightness or two-photon action cross section. It determines to what extent the laser radiation absorbed via a two-photon process can be reemitted in an upconverted way, and what follows, used in an efficient way. Analogously, if one considers MOFs as materials for two-photon patterning, or in general, as nonlinear photoresponsive materials, the merit factor should be φphotσ2, in which φphot stands for the efficiency of an employed photochemical process. In principle, in each case two variables need to be optimized. The methods to enhance the quantum yield or yield of the photochemical response of the system are beyond the scope of this review, but we would like to briefly delineate two fundamental directions for shaping of high two-photon absorption cross sections in MOFs. Firstly, we will discuss well-known intramolecular (molecule-based) approaches used to maximize the two-photon response, along with some indications of which strategies are transferrable to the MOF field; secondly, since MOFs are crystalline compounds in which ligands and metal ions interact with the surroundings via a vast array of strong and weak forces (coordination bonds, π-stacking, and hydrogen bonding) it seems intuitive that this complex molecular environment will have an impact on the electron density and polarizability of such systems, with particular consequences for third-order nonlinearities. Bearing in mind that shaping of 2PA properties by “intermolecular interactions” is an already signaled but in fact weakly explored territory, we aimed to collect possible NLO enhancement strategies applicable to MOFs that take advantage of broadly-understood molecular aggregation.MOFs are organic–inorganic hybrid materials – it seems natural that they should display the spectroscopic properties of both participating units, and consequently, the NLO properties of MOFs will be predetermined by the metal ion and especially, by the ligand. As it is known from classical coordination chemistry, absorption characteristics of metal–ligand systems are not a simple sum, but owing to the formation of coordination bonds, the energy levels of ligands and of metal ions mix. In the case of transition metals, most often used for construction of MOFs, d–p orbital mixing results in overriding the d–d selection rules, as well as introducing intense metal-to-ligand or ligand-to-metal charge transfer bands (MLCT and LMCT, respectively). These new charge-transfer states or even simple polarization of ligand electron density due to electron-pushing/pulling effects of metal centers can render higher NLO responses than would be found for an uncoordinated ligand itself.
Indeed, the role of metal ions is rather not to provide an additional two-photon response by themselves, since pure d–d transitions have very low two-photon cross sections, but they act as efficient modifiers of the ligands' electron density.
Apart from the above, an additional value which is added by the metal centers comes from additional functionalities they bring. From the view point of optical effects of particular interest are the luminescence properties of heavy transition metals, with accessible triplet excited states via spin–orbit coupling as well as f–f transitions of lanthanides. Their long-lived emissions can be elicited by energy transfer from two-photon excited ligand molecules and can be used e.g. for time-resolved imaging. In addition, incorporation of metal ions, especially those with unpaired d electrons can impart redox, magnetic as well as magneto-optical properties onto MOFs. Such functionalities of MOFs are well recognized on their own merit, but conjugation of these effects with NLO excitation in these materials still remains to be realized.
3.1. Ligand design – intramolecular approach
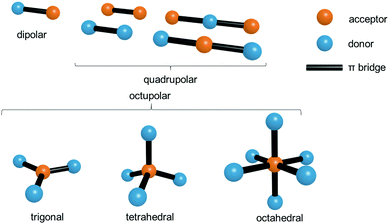
As shown in the previous section a crucial factor for the molecule-based design (intramolecular approach) of two-photon active MOFs is the optimal structure of the ligand. Over many years a great deal of effort has been expended on the search for design principles of multi-photon absorbing molecules.8 A fundamental structural feature giving rise to charge-transfer processes, which are among crucial factors needed for a high two-photon response, is the presence of an electron donor, an acceptor, or the presence of both types of these groups simultaneously.Considering the shape and arrangement of electron donating/accepting groups, NLO chromophores can be roughly classified into the following groups: dipolar (called alternatively push–pull), quadrupolar (push–push, D–π–D and pull–pull, A–π–A) and octupolar molecules (Fig. 1).
In the simplest examples of the first and second group, the molecules are linear, the dipolar ones having donor and acceptor sites separated by a π-bridge, while the quadrupolar ones are symmetrically substituted either with electron donors or with electron acceptors. Historically, the advent of molecule-based engineering of the two-photon property began from the exhaustive studies of NLO properties of these two subclasses.26 The name “quadrupolar” is used because of the quadrupole moment being the lowest electrical moment of those centrosymmetric molecules. Octupolar molecules encompass a broader range of geometries, beginning from the frequently encountered trigonal arrangement (C3v symmetry) to tetrahedral (Td) and octahedral (Oh) geometries.
The knowledge gained throughout the years allowed for drawing quite detailed design principles of two-photon chromophores, which can now be successfully adopted for ligand design for MOFs. Most of them were summarized in extant reviews on two-photon absorption,8,27,28 so we will point out only the most important concepts.
There are two most fundamental factors that determine the performance of a two-photon molecular chromophore: the π-conjugation length, and the presence of intramolecular charge transfer. The former property, in the first approximation can be treated in “the longer the better” terms, since large charge separation is beneficial for obtaining high polarizability of the system. The efficiency of charge delocalization is determined by linkages that are used to join aromatic rings. Indeed, electronic communication is enabled by high overlap of π orbitals, thus usually the best performance of NLO properties is obtained when vinylene linkages are used, ethylene bridges provide somewhat weaker performance while phenylene bridges are significantly inferior in that respect. Elongation of organic scaffolds gives rise to a certain number of repeating units, at which the nonlinearity saturates, because the length of the π-electron system exceeds the range of π-delocalization. Additional enhancement of the two-photon response is obtained when a given compound has many arms, as can be found in the octupolar class of NLO chromophores (e.g. compounds based on triphenylamine). In such cases the gain of NLO response can be much higher than what would be expected from the sum of all participating arms.29,30
Strong intramolecular charge transfer is obtained by separation of electron donating and withdrawing groups in one molecule. However, for design of NLO-active MOFs, one needs to be aware of restraints that are imposed by specific features of functional groups. For instance, strong electron withdrawal was achieved by insertion of nitro (–NO2),31,32 sulfonyl (–SO2R),33,34 and triflyl (CF3SO2−)33,35 functional groups, but their coordination abilities are rather low. Moreover, nitro-compounds, due to inherent high participation of nonradiative decay, tend to be rather weakly fluorescent, which in light of the need for high two-photon brightness (φσ2), lowers their applicability for the construction of MOFs that could be used for two-photon excited emission applications. Chemical stability needs to be taken into account as well – the nitrile group, another representative of the electron withdrawing groups that are well-recognized for NLO applications,26 can undergo hydrolysis under hydrothermal conditions, especially at basic pH.36
By and large, the most utilized ligating group in MOFs is the carboxylic one, which is also quite a strong electron acceptor. In general, the great majority of binding groups already used in MOF construction withdraw electron density (for example: carboxy, sulphonic, phosphonic, as well as N-heterocyclic: pyridines, imidazoles, pyrazoles, triazoles). In contrast, the presence of electron donor groups (amino, alkyl amino, phenol, and alkoxy) is much less common, due to their comparatively lower coordination abilities. Due to the presence of the carboxylic groups in the organic linkers, the majority of employed ligands are of A–π–A type and therefore lack the electron donor group needed for efficient charge transfer, which we stressed as a prerequisite for a large NLO response.
Consequently, third-order NLO properties of MOFs constructed from small dicarboxylic acids such as benzene-1,4-dicarboxylic acid (e.g. IRMOF-1) can be expected to be moderate at best. Thus, in accordance with the previously drawn design principles, we can see a bigger prospect for high nonlinearities in ligands possessing extended polarizable π-core such as anthracene, perylene, pyrene as well as those incorporating donor units in the interior of the molecule. Valuable building blocks for MOFs seem to be triphenylamine derived linkers (as a basis for D(–π–A)3 octupolar ligands) and planarity-enforced molecules such as carbazole and fluorene (as a basis for V-shaped D(–π–A)2 ligands sharing octupolar and quadrupolar properties). Apart from their donating ability, the enhancement of the two-photon response via the branching effect is highly expected.
3.2. Intermolecular approach
An especially appealing property of CPs and MOFs from the multi-photon absorption (MPA) point of view is that they are crystalline solids with precisely defined ordering. The self-assembly process gives the opportunity to fix the position of the ligand molecules and possibly allows for determination of which structural factors, especially those that are intermolecular, have the biggest influence on the two-photon cross section of a given MOF material.It should be stressed that, in general, the influence of intermolecular interactions (through-space interactions) on the two-photon response of condensed materials is not well understood; investigations of such systems had only a few experimental realizations.37 The currently available data, however, allow for the identification of some directions.
One of the prospective intermolecular tools seems to be π-stacking. For example, the formation of J-aggregates of sulfonated porphyrin species in solutions and thin films was found to increase the 2PA cross section around 3038 and 1.739 times with respect to the nonaggregated form, respectively. In this type of aggregate the origin of the two-photon response enhancement may be attributed to the combination of excitonic transitions between π-stacked aromatic units, so the delocalization of excitons takes place, essentially, through space. This kind of enhancement of nonlinear response has been also postulated to be responsible for unusually high two- and multi-photon cross sections in polymeric biomaterials like amyloid protein fibres40 and silk.41
A great majority of organic molecules, including ligands for MOFs, are non-flat and possess conformationally labile fragments. In such cases the enhancement upon aggregation (intermolecular steric effect)42 will additionally originate from planarization of organic scaffolds, since a more planar conformation favours efficient charge delocalization across the molecule due to a larger overlap of π orbitals. In other words, confining the molecular environment (e.g. surrounding molecules in the crystal lattice) improves through-bond charge delocalization by enforcing planarity. Indeed, this phenomenon has been postulated as the main cause of enhanced 2PA cross sections of 1,4-bis(cyanostyryl)benzene42 and 9,10-bis[4′-(4′′-aminostyryl)styryl]anthracene43 derivatives, and it can be viewed as the cause of the superior two- and three-photon performance of thin films of the rr-P3HT polymer (regioregular poly(3-hexylthiophene)).44
Considering structural complexity and also tailorability of CPs and MOFs, the above discussed intermolecular phenomena can be imparted onto the structure, and therefore can contribute to overall third-order nonlinearity. The remaining question is how to maximize their potential. Thus, future work should not only focus on the design of molecular structures of ligands for high third-order nonlinearities but also address intermolecular effects.
4. Measurement techniques of multi-photon absorption
4.1. Z-scan
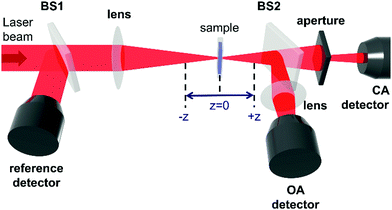
The Z-scan technique,45 initially introduced in 1990, is currently one of the main techniques for the characterization of third-order nonlinear properties (nonlinear absorption and nonlinear refraction) of materials, owing to its relative simplicity and the broad variety of information that it can provide. The name Z-scan is derived from the fact, that in this technique the sample is moved along the axis of a focused laser beam (z-axis). The sample moving in this manner experiences a gradual increase in intensity up to the focal point (z = 0), and subsequently, the decrease of intensity when it leaves that region (Fig. 2). Essentially, to elicit the intensity dependence of both the refractive index and the absorption coefficient very high light intensities are needed; in the case of femtosecond Z-scan, they usually are in the range of 50–250 GW cm−2.Intensity-caused change of the real part of the refractive index, described as n(I) = n(0) + n2I, results in the modification of the lensing properties of the investigated sample. When n2 is positive the sample behaves as an additional focusing lens, and conversely, a negative n2 causes the sample to act as if it were a defocusing lens. The most common way to measure the extent of change of beam divergence is to place an aperture before the detector. Thus, any sample-induced change of the beam profile is registered by the detector as a change in the intensity of transmitted light (Z-scan with an aperture is called closed-aperture (CA) Z-scan, Fig. 3a).
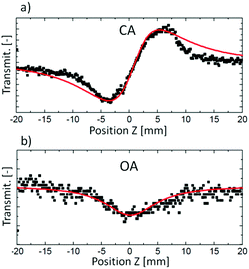 | ||
| Fig. 3 Examples of experimental Z-scan traces (black squares) and respective fits to theoretical equations (red lines) obtained from (a) CA measurement and (b) OA measurement. Reproduced from ref. 46 with permission from American Chemical Society. | ||
As presented in Fig. 2, a beam splitter (BS2) can be placed between the aperture and the moving sample. Beam distortion evoked by nonlinear refraction does not play a role here since all radiation is collected by the open-aperture (OA detector, for an example of the experimental OA Z-scan see Fig. 3b), which is here assured by using an additional focusing lens in front of the detector. Accordingly, any changes in the light transmittance are attributed to the nonlinear absorption processes. More specifically, the decrease of transmittance (a valley/a dip) in an OA trace is diagnostic of nonlinear absorption, while the increase of transmittance indicates saturable absorption properties.
The shapes of the CA and OA signals (or even simply the amplitudes of the transmittance changes) can be used to determine the magnitudes of the nonlinear refractive index and nonlinear absorption coefficient of the sample. This requires, however, the knowledge of the light intensity, which is not a trivial issue since the determination of the intensity requires careful evaluation of the laser pulse shape and the beam profile. An alternative is carrying out the measurements in a relative manner, using a well-known reference. In the lab of two co-authors of this paper (JKZ and MS), three Z-scans are conducted for obtaining each wavelength point of a spectrum of third-order NLO properties of various materials: for reference, usually a fused silica plate, for a cuvette with a solution/dispersion of the sample, and for a cuvette with the solvent. The silica plate is used to calibrate the light intensity, and it also serves as an indicator of possible, albeit undesirable, accompanying nonlinear processes, such as supercontinuum generation, which can occur when the laser irradiance is too high. Most of the Z-scan measurements are conducted in the so-called thin sample regime (meaning that the Rayleigh length of the beam is chosen to be longer than the thickness of the sample). In consequence, the glass walls of the cuvettes contribute to the determined nonlinearities, similar to the solvent. Thus, to correct for their contributions, the cuvette with the solvent has to be measured as well. Since the optical nonlinearities are determined for a solution, its concentration needs to be precisely known, to be able to extrapolate the data to a pure substance, or to calculate the molecular quantities using local field corrections.
The analysis of experimental Z-scan traces is conducted through fitting to theoretical equations, derived by Sheikh-Bahae et al.45 Basically, the fitting procedure involves determination of the nonlinear phase shifts, which are further used to calculate the real and imaginary part of the nonlinear refractive index (similarly to the linear refractive index n, n2 can be treated as a complex quantity). The latter parameter yields the nonlinear absorption coefficient α2, which, taking into account the molar concentration of the investigated substance, can also provide the two-photon absorption cross-section σ2. The issues of reporting the results in a proper way, as molecular or macroscopic quantities, are further discussed in Section 4.5.
The measurement and analysis of optical nonlinearities using Z-scan require special care, since the signals collected by CA and OA detectors may be influenced not only by practically instantaneous nonlinear refraction and nonlinear absorption due to electronic distribution distortion and multiphoton absorption in molecules. Factors that can contribute to the nonlinearity measured by Z-scan are molecular reorientations, nonlinear scattering, nonlinearities resulting from local heating of the sample (thermal nonlinearity connected with the temperature dependence of the refractive index) and absorption by excited states. The contribution of the latter two processes can be minimized by appropriate choice of the laser source and of the wavelength measurement region.
The optimal laser source for Z-scan is one that provides pulses which are on the femtosecond time-scale and of low repetition rate. The influence of both these factors can be easily demonstrated using standard kinetics of the excited state population. If the laser wavelength allows for even weak one-photon absorption, depending on the laser pulse length and its relation to the excited state lifetime, excited state absorption may dominate over the direct two-photon absorption process. The lifetime of the excited state is the picosecond to nanosecond range for most of the organic molecules and can be longer for metal complexes, including CPs. Therefore, the laser pulse should be much shorter than the half-life of those excited states, in order to minimize subsequent absorption of an additional photon, by an already present populated level. The low repetition rate additionally assures that all excited states, including triplet ones (or other long-lived states, depending on the type of the material), are relaxed to the ground state before the arrival of the next laser pulse and that the heat released in the absorption processes is dispersed.
Indeed, significant overestimation of the apparent two-photon cross sections due to the use of nanosecond long laser pulses has been documented.47,48 Prasad et al. reported a femtosecond Z-scan study of AF-350 dye (tris[4-(7-benzothiazol-2-yl-9,9-diethylfluoren-2-yl)phenyl]amine) which showed that the apparent two-photon cross section was found to be 240 times higher compared to the femtosecond result, when the nanosecond-long laser pulses were applied.47 Similar differences between cross sections determined in nano- and femtosecond regimes have been reported for AF-50 dye (N,N-diphenyl-7-[2-(4-piridinyl)ethenyl]-9,9-di-n-decyl-fluoren-2-amine).48
An important issue that is inherent in the Z-scan measurement is that it does not provide a simple way of differentiating between the instantaneous absorption of two or more photons and sequential processes. Therefore, for the spectral region where even weak one-photon absorption is present one may expect excited state absorption (often referred to as reverse saturable absorption, RSA) to be dominant over the true two-photon absorption, especially for longer laser pulses. On the other hand, in the two-photon absorption spectral range, the two-photon created excited state can also efficiently absorb a third photon, leading to apparent three-photon absorption (3PA). Distinguishing between instantaneous and sequential processes is, however, possible through the use of pump–probe techniques.
A severe limitation to the use of the Z-scan technique from the MOF science view point is the need for non-scattering samples. Since the great majority of MOFs are obtained in the form of insoluble single-crystals and/or microcrystalline solids, dispersion of such materials would yield mostly turbid samples, additionally with changing the degree of scattering and local concentration with time due to sedimentation. Therefore, the Z-scan method is best suited for the determination of nonlinearities of those CPs that can be obtained in the form of nanoparticles. For the same reason the use of pump–probe measurements and in general, of other transmission techniques that are employed for determination of kinetics of femtosecond and picosecond long processes, such as transient absorption spectroscopy, is limited to MOF nanoparticle dispersions.
4.2. Two-photon excited fluorescence (TPEF)
The second experiment most widely used for determination of nonlinear absorption, usually presented as two-photon absorption cross sections of molecules, is the two-photon excited fluorescence, initially introduced in a seminal paper of Xu and Webb.49 An absolute determination of σ2 is possible if exact data on the parameters of a laser beam exciting the upconverted fluorescence as well as those on the number of emitted photons and the quantum yield of TPEF are known. However, typically, this measurement is carried out in a relative way: at every wavelength in the investigated range the two-photon cross section is determined by comparison of the two-photon-induced fluorescence intensity of the sample with that of a reference for which the wavelength dependence of the cross section σ2ref is precisely known. Currently, a number of standard dyes are used which allow for the determination of σ2 values in the whole Vis-NIR range – an exhaustive set of data for two-photon dye standards has been reported by Makarov et al.50 The intensity of the TPEF process is given by eqn (3):| ATPEF = cI2n2σ2φFcol | (3) |
Ideally, the quantum yield φ of the two-photon excited fluorescence process should be known for both the sample and reference. Although the quantum yield may be a function of the wavelength of two-photon laser excitation (the Kasha's rule may not necessarily apply), given the issues connected with determination of quantum yield in the two-photon regime, the most common practice is just to use the quantum yield φ determined from one-photon experiments. Such an approach is justified by the assumption that the radiative process occurs from the same (lowest) excited state, regardless of the origin of excitation (one- or two-photon), according to Kasha's rule. Alternatively, the results obtained from TPEF measurements are often reported as two-photon brightness σ2φ, which quantifies the relative efficiency of the two-photon excited emission. The phenomenological collection factor Fcol is responsible for all setup-related parameters, that is: optical path, sensitivity of the detector, apertures, collection angle, but also may – which is extremely important for measurement of MOFs – account for light scattering processes in the sample.
In the standard TPEF technique, in which dilute solutions of the investigated substance sample and of a reference dye are used (optical density is typically taken to be lower than 0.1), the σ2 value of the investigated compound is calculated from the ratio of fluorescence intensities:
 | (4) |
In the case of CPs and MOFs the σ2 values cannot really be determined by simple comparison of the TPEF signal of a reference and that of suspension of a material in a non-dissolving medium. The collection factors for such measurements are significantly different due to negligible scattering in the solution of the reference and very high scattering of the suspension of crystals of a CP. To address this problem, we devised a modification of the standard TPEF method, which partly circumvents the issue of scattering –Internal Standard Two-Photon Excited Fluorescence (ISTPEF).
4.3. Internal standard two-photon excited fluorescence (ISTPEF)
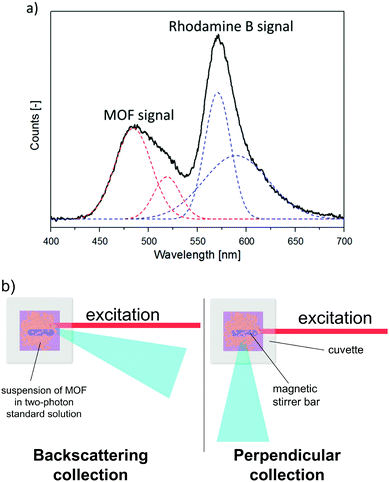
Since the two-photon emission of two samples cannot be compared due to different effects of scattering, the proposed remedy to this issue is to measure the two-photon emission of a CP suspended in a solution of a two-photon-standard, for example, Rhodamine B. Since emission of both CP and the standard experience a similar degree of scattering under such conditions (Fig. 4), it can be assumed that the collection factor term in expression (4) is cancelled out. An example of the experimental signal collected in this experiment is given in Fig. 4a. To obtain true integral intensities of emission of the MOF and of the standard, the deconvolution procedure must be applied.While this approach enables one to measure σ2 values for dispersions of CPs, some precautions need to be stressed. The most notorious problem encountered in this method is the presence of a tail of the exciting laser spectrum in the fluorescence spectra, especially for excitation wavelengths close to the emission of the sample or reference. Thus, the processing of the fluorescence data requires removal of the background. However, this problem could be alleviated to some extent by collecting the radiation in backscattering mode (Fig. 4b). This factor as well as the need for deconvolution of fluorescence data bring additional uncertainty into σ2 values obtained with the ISTPEF method. Hence, the relative error of measurements may be bigger than that of the standard TPEF method (∼15%).
4.4. Solid state two-photon excited fluorescence (SSTPEF)
The determination of σ2 values can also be performed on samples in the solid state. In this technique, the two-photon excited fluorescence signal is obtained via laser irradiation of microcrystalline samples of a CP and of a two-photon standard, for example perylene microcrystals. Here, an important issue is to use exactly the same collection geometry for both samples at the same wavelength, since they are measured separately.Concerns connected with collection factor Fcol for solid samples are also valid. Indeed, the intensity of the collected signals will depend on the grain size of the investigated samples that would cause a different degree of scattering as well as on the refractive index of the samples, influencing the collection efficiency. A step toward alleviating these problems is to sieve samples of MOFs and two-photon standards into the same particle size range, analogously to what is routinely done in the case of SHG measurements. Such a procedure should also increase the reproducibility of the results across different laboratories.
In the SSTPEF method, eqn (5) needs to be modified. For solid samples of a CP the concentration, c should be interpreted as the crystal density dsam divided by the molar mass of a selected repeating unit of the CP (Msam), while for the reference it is ‘dref/Mref’ ratio. The refractive indices usually are not equal, giving as a result:
 | (5) |
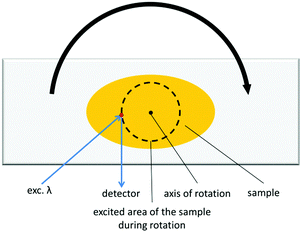
Focusing of the laser beam in one area for a longer period of time quite often causes photochemical reactions, which would cause the alteration of spectral characteristics. This is obviously an undesirable phenomenon, which can be avoided either by decreasing the input intensity until no photochemical change is observed, or by shortening the laser beam exposure on the sample. We devised a modification of that experiment, in which we placed the investigated sample on a rotating stage (Fig. 5). The measurements conducted in this manner possess two-fold advantages: (i) samples are less prone to undergo photochemical reaction due to shortened irradiation time; (ii) the emission signal is collected from different parts of the sample, which from the statistical point of view reflects the emission properties of the bulk sample much better. This method seems to be particularly useful for CPs, which are soluble or decompose in common solvents and for this reason TPEF cannot be measured with the ISTPEF technique.
An essential drawback of this method is the uncertainty connected with the two-photon cross sections of the two-photon standard. The great majority of reported σ2 values have been determined by Z-scan or TPEF measurements in solutions, in which the interactions between molecules are most often negligible. Clearly, although σ2 values correspond to two-photon properties of a material extrapolated to the pure substance, the same two-photon standard in the solid-state will most probably have different two-photon cross sections due to matrix interactions.
4.5. Reporting of NLO results
There is no uniform convention in the literature for the reporting of NLO parameters, such as the results obtained from the Z-scan measurements where the primary quantities characterizing a sample are the nonlinear absorption coefficient α2 (often denoted as β) and the nonlinear refractive index n2. These quantities are macroscopic parameters, which properly describe the results obtained on a slab of a single-component material but are of low comparative value in the case of solutions or any other host–guest system, such as dispersions of CPs.While microscopic NLO properties can be and indeed are often reported as values of the hyperpolarizabilities referring to a single molecule (or e.g. a repeat unit of a polymer), the most commonly used measure of nonlinear absorption relating to a chemical species are its two-photon absorption cross section σ2 and cross sections for higher-order absorption processes. Simple relations like α2 = Nσ2/hν which relate the macroscopic and microscopic parameters assume that absorptive NLO properties scale linearly with increasing concentration N (in molecules per cm3), which may not be always true, in particular, extrapolation to the pure substance is risky.
Even more troublesome is reporting of nonlinear refraction parameters, where any evaluation of the properties must take into account non-zero contributions from all components of the system (solvent and cuvette walls for solution measurements). It should be noted that it is possible to define a “nonlinear refraction cross section” σR,51 of a molecule, which provides a convenient way of reporting spectra of nonlinear absorption and refraction together.
In order to calculate the σ2 value, the concentration of species present in the system is needed as well as their molar mass must be known. While the calculation of the two-photon cross sections for organic molecules and discrete coordination complexes is straightforward, because the molar mass is well-defined, it is not so obvious in the case of polymeric systems, especially for hybrid materials. As a structural unit for σ2 calculation one can choose an asymmetric unit, its multiplication comprising one ligand molecule (molecular formula) or even the complete unit cell. Clearly, the reported σ2 value will depend on this choice, thus the chemical formula used for calculations should always be provided.
In order to avoid ambiguities connected with reporting and comparing of σ2 values between materials, various two-photon merit factors have been used that normalize the nonlinearity versus chosen quantity: molar mass (σ2/M), number of delocalized electrons (σ2/N), square of the number of delocalized electrons (σ2/N2), molecular volume (σ2/Vm) or even cost of manufacture (σ2/$).52–54
The molar mass based merit factor (σ2/M) is certainly the easiest to use to compare the nonlinear absorption efficiency between materials, even those of very different chemical character (for example organic molecules, MOFs, semiconductor nanoparticles and plasmonic nanoparticles).55 In the context of MOFs, the use of proper merit factors allows it to be clearly established whether the two-photon cross section of the metal–organic assembly is indeed enhanced in comparison to that of the ligand itself.
It should be stressed, however, that a number of conditions should be met for the determination of nonlinear optical parameters to be reliably compared between different materials. In the case of σ2 (and σR) determination the crucial conditions are: (a) the use of a femtosecond laser excitation source, in order to minimize thermal nonlinearity, and excited state absorption effects. For the Z-scan technique a low-repetition rate (kHz and less) source is a prerequisite, while for the TPEF technique a high repetition rate (of the MHz order) is not an obstacle; (b) measurement of NLO properties in the wide-wavelength range, which allows full NLO spectra to be determined; (c) reporting of the NLO properties in the form of intensive values (such as cross sections: σ2, σ3) instead of extensive values; (d) comparisons between different materials are only meaningful if the data are properly normalized.
5. Two-photon absorption in CPs
5.1 How much is known about third-order NLO properties of CPs?
Literature searches using different combinations of the phrases: “coordination polymer”, “metal–organic framework”, “two-photon absorption”, “NLO properties”, “third-order” and similar led us to around 50 papers which claim to report two-photon absorption in CPs (see Table 1).| No. | Technique | Measurement conditions | Molecular formula | NLO quantities | Ref. |
|---|---|---|---|---|---|
| Abbreviations: DFWM = degenerate four-wave mixing; Dpattp = 4′-(4-(diphenylamino)thienyl)-4,2′:6′,4′′-terpyridine; 1,2-bib = 1,2-bis((1H-imidazol-1-yl)methyl)benzene;H2ceda = cyclohex-4-ene-1,2-dicarboxylic acid; H2cada = cyclohexane-1,2-dicarboxylic acid; 1,4-bib = 1,4-bis((1H-imidazol-1-yl)methyl)benzene; H2bda = 1,2-benzenedicarboxylate; py = pyridine; 4,4′-bipy = 4,4′-bipyridine; bpea = 1,2-bis(4-pyridyl)ethane; tpt = 2,4,6-tri(4-pyridyl)-1,3,5-triazine; 1,3-bib = 1,3-bis((1H-imidazol-1-yl)methyl)benzene; NaH2stp = sodium 3,5-dicarboxybenzenesulfonate; H2oba = 4,4′-oxydibenzoic acid; Tp* = hydridotris((3,5-dimethylpyrazol-1-yl)borate); 3,3′-pytz = (3,6-bis(3-pyridyl)-1,2,4,5-tetrazine); bpea = 1,2-bis(4-pyridyl)ethane; bpee = 1,2-bis(4-pyridyl)ethylene; dca = dicyanamide; hmt = hexamethylenetetramine; pbbt = 1,10-(1,3-propylene)bis-1H-benzotriazole; H3chel = chelidamic acid (2,6-dicarboxy-4-hydroxypyridine); bpfp = N,N-bis(3-pyridylformyl)piperazine; fcz = fluconazole; bbbm = 1,1′-((1,4-butanediyl)bis-1H-benzimidazole); 4,4′-azpy = 4,4′-azopyridine; H4bta = biphenyl-3,3′,4,4′-tetracarboxylic acid; H2ca = camphanic acid; Hpca = pyrazine-2-carboxylic acid; Dpya = N,N-dimethyl-4-(pyridin-4-yldiazenyl)aniline; pz25dc = pyrazine-2,5-dicarboxylate; H4pyro = pyromellitic acid; benz = benzoic acid; dps = 4,4′-dipyridyl sulfide; bpp = 1,3-bis(4-pyridyl)propane; inh = N-(isonicotinoyl)-N-nicotinoylhydrazine; btx = 1,4-bis(triazol-1-ylmethyl)benzene; bbbm = 1,10-(1,4-butanediyl)bis-1H-benzimidazole; phen = 9,10-phenantroline; bbp = 4,4′-trimethylenedipyridine; bpfp = N,N′-bis(3-pyridylformyl)piperazine; bpms = 1,2-bis(4-pyridylmethyl)disulfenyl; p2ca = pyrazine-2-carboxylic acid; 2,2′-bipy = 2,2′-bipyridine. | |||||
| 1 | Z-scan | DMF, 680–1080 nm, 80 MHz, 140 fs | [Zn(dpattp)Cl2], [Zn(dpattp)Br2]·H2O, and [Zn(dpattp)I2]·H2O | α 2 = 1.289, 0.965 and 0.473 cm GW−1 at 720 nm | 56 |
| 2 | Z-scan | DMSO/thin film, 532 nm, 7 ns, 10 Hz | [Ni(1,2-bib)(ceda)]·1.5H2O, [Zn(1,2-bib)(cada)], and [Zn2(1,4-bib)2(ceda)2]·2H2O | Solution: α2 = 1.01 × 10⁻¹⁰, 0.42 × 10⁻¹⁰, and 0.46 × 10⁻¹⁰ mW−1, χ(3) = 3.54 × 10⁻¹², 1.47 × 10⁻¹², and 1.61 × 10⁻¹² esu | 57 |
| Thin film: α2 = 6.41 × 10⁻⁵, 3.26 × 10⁻⁵, and 0.39 × 10⁻⁵ mW−1 | |||||
| 3 | Z-scan | DMSO, 532 nm, 7 ns, 10 Hz | [Zn(bda)(1,4-bib)], [Ni(bda)(1,4-bib)], and [Ni(H2O)2(1,2-bib)2](hbda)2 | α 2 = 3.55 × 10⁻¹¹, 9.38 × 10⁻¹¹, and 1.14 × 10⁻¹⁰ mW−1 | 58 |
| χ (3) = 0.95 × 10⁻¹¹, 2.06 × 10⁻¹¹, and 2.51 × 10⁻¹¹ esu | |||||
| 4 | Z-scan | DMF, 532 nm, 21 ps | [Tp*WS3Cu2(CN)(μ-py)]2·py, [Tp*WS3Cu2(CN)2Cu(μ-py)2]2·3py, [Et4N][Tp*WS3(CuCN)2Cu2(CN)-(μ4-bipy)], [Tp*WS3Cu2(CN)(μ4-bpea)0.5]2·CH2Cl2, and [Tp*WS3Cu2(CN)(μ6-tpt)1/3]2 | α 2 = 2.80 × 10⁻¹³, 4.40 × 10⁻¹³, 2.10 × 10⁻¹³, 2.80 × 10⁻¹³, 1.30 × 10⁻¹² mW−1 | 59 |
| χ (3) = 4.31 × 10⁻¹³, 4.57 × 10⁻¹³, 6.09 × 10⁻¹³, 6.34 × 10⁻¹³, and 4.08 × 10⁻¹³ esu | |||||
| 5 | Z-scan | DMSO/thin film, 532 nm, 7 ns, 10 Hz | [Cd3(1,2-bib)4(stp)2(H2O)2]·10H2O, [Cd3(1,3-bib)5(stp)2]·3H2O | Solution: α2 = 6.53 × 10⁻¹¹, 7.15 × 10⁻¹¹ mW−1 | 60 |
| χ (3) = 2.23 × 10⁻¹², 2.50 × 10⁻¹² esu | |||||
| Thin film: α2 = 31.1 × 10⁻⁶, 3.80 × 10⁻⁶ mW−1 | |||||
| χ (3) = 1.09 × 10⁻⁶, 0.13 × 10⁻⁶ esu | |||||
| 6 | Z-scan | DMSO, 532 nm, 7 ns | [Co(oba)(1,3-bib)]2·H2O, [Co(oba)(1,2-bib)·H2O] | α 2 = 8.29 × 10⁻¹¹, 6.89 × 10⁻¹¹ mW−1 | 61 |
| χ (3) = 1.86 × 10⁻¹¹, 1.58 × 10⁻¹¹ esu | |||||
| 7 | Z-scan | Thin film, 532 nm, 7ns | [Co(bda)(1,2-bib)] | χ (3) = 1.07 × 10⁻⁸ esu | 62 |
| 8 | Z-scan | DMF, 532 nm, 4 ns | [Zn(μ2-3,3′-pytz)(NO2)2] | α 2 = 3.75 × 10⁻¹⁰ mW−1, χ(3) = 1.70 × 10⁻¹¹ esu | 63 |
| 9 | DFWM | DMF, 800 nm, 80 fs, 1 kHz | [Tp*WS3Cu2(4,4′-bipy)1.5](PF6)·2MeCN, [(Tp*WS3Cu2)2(bpea)3]-(PF6)2·2DMF, [Tp*WS3Cu2(μ-CN)(4,4′-bipy)0.5]·MeCN, and [Et4N][(Tp*WS3Cu2)2(Cu-(μ-CN)2.5)2(bpee)]·3MeCN | χ (3) = 3.4 × 10⁻¹⁴, 4.2 × 10⁻¹⁴, 3.1 × 10⁻¹⁴, 6.4 × 10⁻¹⁴ esu | 64 |
| 10 | DFWM | DMF, 800 nm, 80 fs, 1kHz | [Tp*W(μ3-S)3Cu2Cu(μ-SCN)(μ3-SCN)]2·Et2O, [Tp*W(μ3-S)3Cu3(μ1,5-dca)(μ1(3),5-dca)]2·CH2Cl2 | χ (3) = 3.41 × 10⁻¹⁴, 3.50 × 10⁻¹⁴ | 65 |
| 11 | DFWM | DMF, 800 nm, 80 fs, 1 kHz | [Tp*WS3Cu3(μ3-DMF)(CN)3-Cu(py)], [Tp*WS3Cu3(μ3-DMF)(CN)3Cu], [Tp*WS3Cu3(μ3-DMF)(CN)3Cu]·4(aniline), and [Tp*WS3Cu3(μ3-DMF)(CN)3Cu]·2DMF | χ (3) = 4.03 × 10⁻¹⁴, 3.99 × 10⁻¹⁴, 4.08 × 10⁻¹⁴, 4.20 × 10⁻¹⁴, and 4.16 × 10⁻¹⁴ esu | 66 |
| 12 | Z-scan | DMF, 532 nm, 5 ns | [(NO3)⊂(NMe4)3]⊂[MoOS3Cu3(CN)3], [(NH4)·2DMF]⊂[Mo2O2S6Cu6(CN)3(4,4′-bipy)4], and [(NH4)·2DMF]⊂[Mo2O2S6Cu6(CN)3(bpee)4] | γ = 7.33 × 10⁻³⁰, 3.54 × 10⁻²⁹, and 2.75 × 10⁻²⁹ esu | 67 |
| 13 | Z-scan | DMAc, 532 nm, 4 ns | [Ag(1,3-μ2-SCN)(μ2-hmt)], [Ag(1,1,3-μ3-SCN)]2(μ2-hmt), and [Ag(1,1,3-μ3-SCN)(μ4-hmt)0.5] | χ (3) = 1.82 × 10⁻¹², 3.64 × 10⁻¹², and 4.09 × 10⁻¹² esu | 68 |
| 14 | Z-scan | DMF, 532 nm, 7 ns | [Co(pbbt)2(NCS)2]·H2O | α 2 = 1.40 × 10⁻⁹ mW−1 | 69 |
| 15 | Z-scan | DMF, 532 nm, 8 ns | [AgCu2(chel)(Hchel)]·2H2O | χ (3) = 5.44 × 10⁻¹² esu | 70 |
| 16 | Z-scan | DMF, 532 nm, 8 ns, 2 Hz | [CoCl2(bpfp)] | α 2 = 3.31 × 10⁻¹¹ mW−1, χ(3) = 1.17 × 10⁻¹² esu | 71 |
| 17 | Z-scan | DMF, 532 nm, 8 ns | [Zn(fcz)Cl2]·CH3OH | α 2 = 1.2 × 10⁻⁹ mW−1, χ(3) = 4.48 × 10⁻¹² esu | 72 |
| 18 | Z-scan | DMF, 532 nm, 7 ns | [Pb(bbbm)2(NO3)2] | α 2 = 5.8 × 10⁻⁹ mW−1, χ(3) = 1.67 × 10⁻¹¹ esu | 73 |
| 19 | Z-scan | DMF, 532 nm, 4 ns | [Zn(μ2-4,4′-azpy)(NO2)2], [Cd2(μ2-4,4′-azpy)3(NO2)4] | α 2 close to zero; χ(3) = 9.85 × 10⁻¹², 1.05 × 10⁻¹¹ esu | 56 |
| 20 | Z-scan | DMF, 532 nm, 8 ns | [Cd(en)(NO3)2(4,4′-bipy)] | χ (3) = 1.5 × 10⁻¹¹ esu | 74 |
| 21 | Z-scan | DMF, 532 nm, 7 ns | [Mn(SO4)(4,4′-bipy)(H2O)2], [Mn(N3)2(4,4′-bipy)] | χ (3) = 5.0 × 10⁻¹², 1.2 × 10⁻¹¹ esu | 75 |
| 22 | Z-scan | DMSO, 532 nm, 7 ns, 10 Hz | [Ni(H2O)2(1,2-bib)2](H2bta)·2H2O, [Co2(1,2-bib)2(pyro)]·H2O, and [Co2(1,2-bib)2(CA)2]·H2O | α 2 = 1.44 × 10⁻¹⁰ mW−1, 1.68 × 10⁻¹⁰ mW−1, and −6.31 × 10⁻¹⁰ mW−1 | 76 |
| 23 | Z-scan | DMF, 532 nm, 15 ns | [Cd(pca)(H2O)2(SO4)0.5]2·H2O | α 2 = 1.62 × 10⁻¹¹ mW−1, χ(3) = 8.03 × 10⁻¹² esu | 61 |
| 24 | Z-scan | DMF, 532 nm, 4 ns, 10 Hz | [Zn(Dpya)SO4(H2O)3], [Cu(Dpya)SO4(H2O)3], and [Cu(Dpya)I] | α 2 = 0.891 × 10⁻¹⁰, 0.627 × 10⁻¹⁰, and 1.93 × 10⁻¹⁰ mW−1 | 77 |
| 25 | Z-scan | DMF, 532 nm, 15 ns | [CuCl2(phen)], [CuBr2(phen)], and [Cu3Br3(phen)2] | α 2 = 0.10 × 10⁻¹¹, 0.08 × 10⁻¹¹, 0.12 × 10⁻¹¹ mW−1 | 78 |
| χ (3) = 1.40 × 10⁻¹³, 1.78 × 10⁻¹³, 1.05 × 10⁻¹³ esu | |||||
| 26 | Z-scan | DMF, 532 nm, 15 ns | [Cu(im)2(NCS)2] | α 2 = 1.18 × 10⁻¹⁰ mW−1, χ(3) = 7.0 × 10⁻¹⁰ esu | 79 |
| 27 | Z-scan | DMF, 532 nm, 8 ns | [Cd(μ4-pz25dc)], [Zn(μ4-pz25dc)] | α 2 = 6.3 × 10⁻¹¹, 4.6 × 10⁻¹⁰ mW−1, χ(3) = 2.23 × 10⁻¹⁰, 8.25 × 10⁻¹¹ esu | 80 |
| 28 | Z-scan | DMF, 532 nm, 15 ns | [Fe2(μ10-pyro)0.5(μ2-ox)0.5(μ2-O)1.5] | α 2 = 5.03 × 10⁻¹¹ mW−1, χ(3) = 7.03 × 10⁻¹¹ esu | 81 |
| 29 | Z-scan | DMF, 532 nm, 15 ns | [Co2(μ2-4,4′-bipy)2(I2-benz)2(benz)2] | α 2 = 6.27 × 10⁻¹¹ mW−1, χ(3) = 7.62 × 10⁻¹¹ esu | 82 |
| 30 | Z-scan | DMF, 532 nm, 15 ns | KNa[Ni(μ6-pyro) (μ2-ox)(H2O)2], KNa[Co(μ6-pyro) (μ2-ox)(H2O)2] | α 2 = 0.43 × 10⁻¹⁰, 0.76 × 10⁻¹⁰ mW−1, χ(3) = 2.86 × 10⁻¹², 5.58 × 10⁻¹¹ esu | 83 |
| 31 | Z-scan | DMF, wavelength and length of pulse not provided | [Co(4,4′-bipy)3][Co2(I2-ox)3 | α 2 = 4.25 × 10⁻¹¹ mW−1 | 84 |
| 32 | Z-scan | DMF, 532 nm, 8 ns | [Zn(Hchel)]·H2O | χ (3) = 1.05 × 10⁻¹² esu | 85 |
| 33 | Z-scan | DMF, 532 nm, 8 ns | [Cu(dps)2(SO4)·3H2O·DMF] | NLO parameters not provided | 86 |
| 34 | Z-scan | DMF, 532 nm, 8 ns | [(CuI)4(bpp)4] | n 2 = 2.56 × 10⁻¹² esu | 87 |
| 35 | Z-scan | CH2Cl2, 8 ns pulses at 532 nm, 1 Hz | [Et4N][Ag2I3], [CuBr(C10H8N2S2)] | α 2 = 3.04 × 10⁻¹¹, 1.08 × 10⁻¹¹ mW−1 | 88 |
| 36 | Z-scan | DMF, 532 nm, 7 ns | [AgI(inh)]6(KI) | α 2 = 1.04 × 10⁻⁹ mW−1 | 89 |
| 37 | Z-scan | DMF, 532 nm, 7 ns | [Cd(btx)(SO4)(H2O)2] | α 2 = 1.15 × 10⁻⁹ mW−1 | 90 |
| 38 | Z-scan | DMF, 532 nm, 8 ns, 2Hz | [Co(H2O)2(CH3OH)2(4-bpfp)](NO3)2, [Co(NCS)2(CH3OH)2(3-bpfp)] | α 2 = 9.00 × 10⁻¹¹, 1.41 × 10⁻¹⁰ mW−1, χ(3) = 3.08 × 10⁻¹², 8.25 × 10⁻¹¹ esu | 78 |
| 39 | Z-scan | DMF, 532 nm, 7 ns | [Ni(bbbm)2(H2O)2](NO3)2·2CH3OH·6H2O, [Co(bbbm)2(H2O)2](NO3)2·2CH3OH·6H2O | α 2 = 4.2 × 10⁻⁹, 4.7 × 10⁻¹¹ mW−1 | 91 |
| 40 | Z-scan | DMF, 532 nm, 7 ns | [Zn(CH3COO)2(bbbm)]·(CH3OH)2 | n 2 = 1.38 × 10⁻¹⁷ m2 W−1 | 92 |
| 41 | Z-scan | DMF, 532 nm, 15 ns | [Cu6(CN)6(phen)4] | α 2 = 0.13 × 10⁻¹¹ mW−1, χ(3) = 1.61 × 10⁻¹³ esu | 93 |
| 42 | Z-scan | DMF, 532 nm, 7 ns | [Pb(bbbm)2(NO3)2] | α 2 = 5.8 × 10⁻⁹, χ(3) = 3.08 × 10⁻¹² | 73 |
| 43 | Z-scan | DMF, 532 nm, repetition rate and length of pulse not provided | [Mn(N3)2(bbp)2], [Mn(NCS)2(bbp)2]·0.25H2O] | χ (3) = 4.78 × 10⁻¹², 2.40 × 10⁻¹² esu, n2 = 1.21 × 10⁻¹⁸, 6.71 × 10⁻¹⁹ m2 W−1 | 94 |
| 44 | Z-scan | DMF, 532 nm, 8 ns | [Mn(H2O)2(SO4)(bpfp)](H2O)3(CH3OH), [Zn(NCS)2(bpfp)2]·2H2O, and [Cd(N3)2(bpfp)] | α 2 = 9.2 × 10⁻⁹, 6.9 × 10⁻⁹, and 7.1 × 10⁻⁹ mW−1, χ(3) = 6.39 × 10⁻¹¹, 4.52 × 10⁻¹¹, and 3.84 × 10⁻¹¹ esu | 95 |
| 45 | Z-scan | DMSO, 532 nm, 7 ns, 2 Hz | [Cd(im)3]2(pyro)·0.5H2O, [Cu4(H2O)2(im)8](pyro)2·7H2O | α 2 = 5.45 × 10⁻¹¹, 9.81 × 10⁻¹¹ mW−1, χ(3) = 1.25 × 10⁻¹¹, 2.32 × 10⁻¹¹ esu | 96 |
| 46 | Z-scan | DMF, 532 nm, 7 ns | [Co(NCS)2(bpms)2] | χ (3) = 1.07 × 10⁻¹¹ esu | 13 |
| 47 | Z-scan | DMF, 532 nm, 15 ns | [Cd(p2ca)(H2O)2(SO4)0.5]2·H2O | α 2 = 1.62 × 10⁻¹¹, χ(3) = 8.03 × 10⁻¹² | 97 |
| 48 | Z-scan | DMF, 532 nm, 15 ns | [Cu(phen)(μ-NCS)] | α 2 = 0.94 × 10⁻¹¹, χ(3) = 8.67 × 10⁻¹¹ | 58 |
| 49 | Z-scan | DMF, 532 nm, 15 ns | [Cu(μ-1,1,1,3-N3)] | α 2 = 1.73 × 10⁻¹¹, χ(3) = 9.23 × 10⁻¹¹ | 56 |
| 50 | Z-scan | DMF, 532 nm, 15 ns | [Mn(2,2′-bipy)2(μ2-S6)] | α 2 = 7.2 × 10⁻⁹, χ(3) = 3.35 × 10⁻¹² | 76 |
Therefore, a question may arise if these results provide a consistent (even if early) overview of the third-order NLO properties of CPs. Considering the conditions outlined in the previous section, one must conclude that the great majority of reports on NLO properties listed in Table 1 used experimental conditions which provided data that are of limited value.
In the section describing Z-scan measurements, we stressed that dispersions of microcrystalline CPs in solvents are not suitable for this technique due to excessive scattering. It is not uncommon that some CPs can dissolve in a strongly coordinating solvent such as N,N-dimethylformamide (DMF), N,N-dimethylacetamide (DMAc) or dimethyl sulfoxide (DMSO), yielding non-scattering samples. Nearly all Z-scan studies listed in Table 1 followed this “dissolution” approach, although questions concerning the chemical form of species present in the obtained solution may arise here. Given the high binding constants of d-block metal ions with coordinating solvents (DMF, DMSO, DMAc), it is plausible to suspect that the solubilisation may lead to decomposition of the coordination framework to metal–organic oligomers and possibly, to a mixture of ligand(s) and solvated metal ions.
The possibility of decomposition of coordination networks upon dissolution has been rarely discussed. In several papers measurements of the molecular weight-averaged molar mass (Mw) of species present in solution were reported.73,94,95 To highlight the problem of structure decomposition upon dissolution, we take for example a 2-dimensional (2D) CP investigated in ref. 95. This CP based on N,N-bis(3-pyridylformyl)-piperazine and manganese(II) ions was found to have Mw equal to 4181. The empirical formula is C17H30MnN4O12S which corresponds to one ligand molecule, one manganese(II) ion, and accompanying solvent molecules. By division of the Mw value by the molar mass of the empirical formula (569.5), one can see that an average species present in solution possess only seven units. Thus, although the authors assured that as reported by them CPs “remain polymeric in solutions”, a change of the form of the investigated compound had evidently occurred.
Z-scan measurements on dissolved samples of CPs are not a priori incorrect, but the influence of dissolution on the structure of the investigated species must be considered. Appropriately conducted NLO studies combined with careful analysis of species present in the solution may show that a mixture of metal–organic oligomers has superior two-photon properties to the ligand itself. Nevertheless, dissolution of CPs essentially removes the most crucial advantage of those systems – the possible enhancement of NLO response by both, intra- and intermolecular effects within the precisely defined periodic structure.
Apart from the concerns connected with the dissolution approach, one notes that studies listed in Table 1 have been mostly obtained at single wavelengths such as 532 nm (which typically corresponds to non-zero one-photon absorption) with the use of long pulse (usually several nanoseconds) laser sources. Such measurements, mostly carried out to demonstrate the optical power-limiting ability of a material, are usually dominated by excited state absorption processes (RSA) rather than by direct two-photon absorption.
5.2. More recent advances
Vittal and co-workers reported the first multi-photon (two-, three- and four-photon) absorption properties of MOFs by taking advantage of the solid-state multiphoton-excited luminescence (MPEF) technique using solid perylene as a standard.98 The investigated MOF, MOF-1, [Zn2(sdc)2(An2Py)] (where sdc = trans,trans-4,4′-stilbenedicarboxylate, and An2Py = trans,trans-9,10-bis(4-pyridylethenyl)anthracene) is a pillared layered structure, where the layers of “Zn-sdc” are bridged by An2Py pillars and result in the formation of a 3D framework structure. The anthracene-based ligand is an exemplification of two approaches leading to high nonlinearity (Fig. 6a). Firstly, the ligand has a donor–acceptor quadrupolar structure, in which pyridyl groups serve as electron withdrawing groups. Secondly, this ligand possesses a singlet biradical structure in the ground state, which is expected to increase the second hyperpolarizability (γ) of the aromatic systems.99,100 Open-shell character is present in the solid-state ligand and it is also translated into the MOFs, as evidenced by EPR measurements.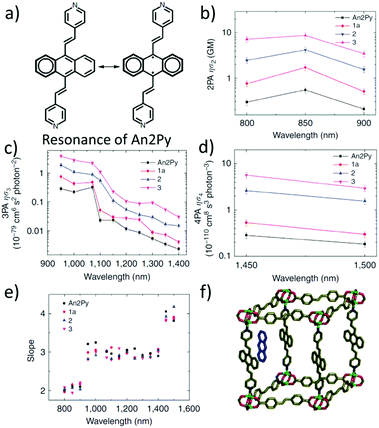 | ||
| Fig. 6 (a) Resonance structures of the An2Py ligand highlighting possible biradical configuration, (b) spectrum of 2PA brightness, (c) spectrum of 3PA brightness, (d) spectrum of 4PA brightness, (e) plot of experimentally determined slopes from intensity dependent measurements, and (f) representation of the structure of the MOF with embedded anthracene molecules.98 Reprinted with permission from Nature publishing group, copyright 2015. | ||
The nonlinear absorption properties of MOF-1 have been reported in the form of two-, three-, and four-photon action cross sections (brightness). Respective maxima are located at 800 nm (φσ2 equal to 7.2 GM), at 950 nm (φσ3 equal to 3.9 × 10−79 cm6 s2), and at 1450 nm (φσ4 equal to 5.7 × 10−110 cm8 s3) as shown in Fig. 6b–d. The multi-photon character of nonlinear absorption at all wavelengths has been confirmed with power-dependence measurements of emissions (Fig. 6e).
The infiltration of guest molecules into this MOF has been used as a tool to enhance multi-photon properties. Increase of reported multiphoton action cross section values has been mostly attributed to the increase of the quantum yield upon interaction with guests. Encapsulated anthracene@MOF-1 (MOF-2) and perylene@MOF-1 (MOF-3) interact via π–π stacking with MOF frameworks as shown by X-ray single-crystal analysis (Fig. 6f). Accordingly, given the proximity of guest molecules to the host lattice, the observed enhancement of NLO response has been explained in terms of the Förster resonance mechanism.
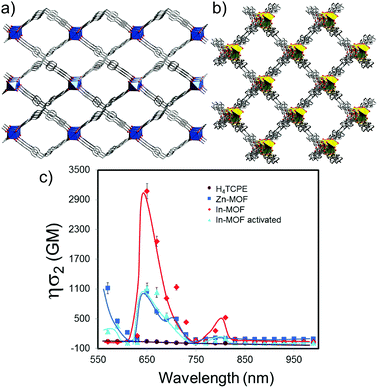
The SSTPEF method has been also used recently by Medishetty et al.101 for two cationic MOFs, (DMA)[In(TCPE)] (In-MOF; DMA = dimethylammonium cation; TCPE4− = tetrakis[4-((4-carboxylato)phenyl)phenyl]ethylene) and (DMA)[Zn(HTCPE)] (Zn-MOF; HTCPE = monoprotonated TCPE linker) (Fig. 7a and b), using solid perylene as the reference. Due to the presence of strong optically active molecule TCPE, its coordination to the metal nodes and its packing arrangement in the crystal structure, these materials showed exceptionally strong TPEF with absorption action cross section values of 3072 GM in the case of In-MOF and 1053 GM in the case of Zn-MOF (much higher compared to the linker alone, which is 55 GM) (Fig. 7b). Due to the very high porosity of the In-MOF, it is vulnerable to external forces, such as grinding and solvent removal under vacuum (activation), which results in the loss of long-range order and the formation of a low crystalline or amorphous phase as deduced from X-ray diffraction studies. IR of pristine and ground MOF shows that connectivity between ligands and metal ions (called therein as short-range order), remains practically untouched. Given these inputs, it seems that decay in two-photon absorption action cross section values to 1111 GM upon grinding can be attributed to the loss of the highly ordered arrangement of the linker molecules. This can be understood in terms of a decrease in linker rigidity as well as broadly seen amorphization (e.g. disorder/shifting of layers, alteration of aggregation modes between ligand molecules). As demonstrated, subtle structure–property relationships emphasize the complexity of MOFs, compared to various other materials and need for further NLO investigations of such kind (Fig. 7c).
Cleuvenbergen et al.102 has demonstrated the TPEF properties of ZIF-8 nano- and micro-particles upon femtosecond excitation at 800 nm using a microscopy setup, however, the absolute two-photon cross sections were not determined. This issue has been addressed by Zaręba et al. with the use of femtosecond Z-scan measurements on a ZIF-8 nanoparticle suspension.103 The two-photon cross section of ZIF-8 was estimated to be lower than 18 GM at 550 nm assuming the C8H10N4Zn formula. The introduction of Co(II) ions in place of half of the Zn(II) ones (50Co/ZIF-8, being formally the hybrid between ZIF-8 and ZIF-67) imparted the typical linear optical band deriving from d–d transition of tetrahedral cobalt(II). Despite its relatively high intensity in the linear regime, its strength did not translate into the two-photon property (σ2 lower than 8 GM at 950 nm, calculated per C8H10N4Zn0.5Co0.5 composition). These rather small two-photon cross sections can be justified by the lack of significant charge transfer processes within the ZIF framework, as there is no clear separation of donor and acceptor of electrons in that structure. Owing to the porous structure of ZIF-8, the interactions between 2-methylimidazole ligands are negligible. Hence, the intermolecular cooperative effects that may increase the nonlinear response are limited.
In contrast to ZIF-8 nanoparticles, Prussian Blue nanoparticles were found to be very strong nonlinear chromophores.104 Prussian Blue, a well-known pigment, which is in fact a three-dimensional (3D) inorganic CP, owes its colour to a very broad absorption band ranging from 450 nm to 1300 nm, with a maximum at 700 nm, due to Fe2+–CN–Fe3+ metal-to-metal charge transfer. Given the high density of these chromophores, since each Fe2+ ion is coordinated by six cyano groups, it seemed feasible to obtain intense nonlinear absorption in such a system (Fig. 8a). Indeed, Z-scan studies in D2O solutions in the 1350–1750 nm range (Fig. 8b) revealed a strong NLO response peaking at 1375 nm and interpreted as three-photon absorption (σ3 equal to 4.5 × 10−78 cm6 s2 per Fe4[Fe(CN)6]3·15H2O formula). As can be seen in Fig. 8c the narrowing of open aperture Z-scan traces suggested the three-photon origin of that process. Remarkably, a similar behaviour of these traces was noted for the whole investigated region. The symmetry considerations suggested that the presence of two-photon and three-photon processes is not excluded at the investigated wavelengths. Thus, to resolve the true origin of the undergoing process the degenerate pump–probe technique was used and it was found that the nonlinear absorption process consists of a fast component (characterized by the pulse length of the laser, 110 fs) and a second, slower mono-exponential process featuring the time constant equal to 260 fs (Fig. 8d). It unambiguously indicated that the observed three-photon absorption is not an instantaneous act, but in fact it is ascribed to be 2PA followed by excited state absorption (RSA).
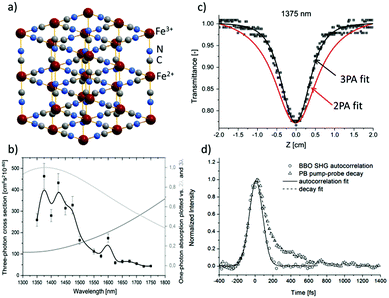 | ||
| Fig. 8 (a) Idealized crystal structure of Prussian Blue. (b) Open aperture Z-scan data for dispersion of PB in D2O at 1375 nm with overlaid theoretical curves assuming two-photon (red lines) or three-photon (black lines) absorption. (c) The plot of σ3 for PB in D2O (black squares) and plots of one-photon absorption spectrum as a function of twice (light grey) and three times (grey) the wavelength. (d) Degenerate pump–probe traces of the SHG autocorrelation signal at the BBO crystal and pump–probe decay signal of Prussian Blue. Both signals were measured using 1350 nm excitation.104 Reprinted with permission from American Chemical Society, copyright 2016. | ||
Worth noting is the relative strength of infrared three-photon absorption (3PA) of Prussian Blue nanoparticles that are expressed by a molar mass-normalized merit factor. This merit factor was found to be equal to 0.41 × 10−80 cm6 s2 g−1 mol at 1375 nm, which placed Prussian Blue nanoparticles as a better three-photon nonlinear chromophore than most semiconductor nanoparticles and the nonlinear material comparable to the best ruthenium organometallic dendrimers.
5.3. Applications of 2PA in MOFs
The advantages of two-photon excitation for induction of chemical and physical processes are well known.27 The biggest advantage of two-photon excitation over UV radiation results from quadratic intensity-dependence of the 2PA process that allows the spatial localization of a given physicochemical transformation at the focus of a laser beam. Hence, localized two-photon-induced fluorescence may be used for high-resolution imaging,105,106 photo-induced polymerization under tight-focusing conditions (or any other photochemical process, for example, isomerization) for ultrafast micro- and nanofabrication.107,108 Even more, if the occurring structural change can be efficiently read, a prospect for 3D optical data storage arrays is also feasible.109–111Following this path, Qian et al. extended the idea of two-photon lithography to MOFs.112 MOF ‘ZJU-56-0.20’ constructed from a mixture of 2,5-bis(isophtalic-5-yl)-1-methylpyridinium hydroxide (H4L1·OH, 20%), 2,5-bis(isophtalic-5-yl)-pyridine (H4L1, 80%) and Zn(II) ions served as a photoresist (Fig. 9a). The former ligand imparts photosensitive properties onto this MOF. Consequently, exposure of the MOF to UV light (355 nm) increases the intensity and redshifts its emission band from 450 nm to 550 nm. The same photochemical change is induced in response to a 710 nm laser (Fig. 9b). Indeed, using this wavelength a 3D pattern has been written (Fig. 9c). For reading, 900 nm was used which did not initiate photochemical transformation, but TPEF only. In such a way, the 3D pattern can be prepared and subsequently read with the use of two laser wavelengths. The resolution of the fluorescent pattern in ZJU-56-0.20 MOF was reported to be on the order of single micrometers (Fig. 9d). Moreover, the obtained fluorescent pattern was found to be stable for at least 30 days, thus providing the proof-of-concept of two-photon data storage in MOFs.
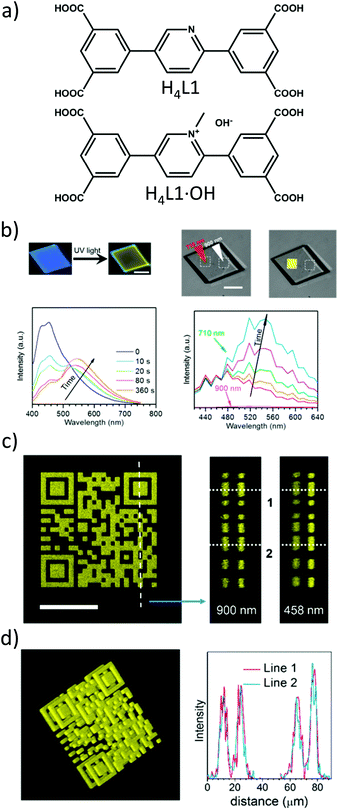 | ||
| Fig. 9 (a) Chemical structures of ligands used for the synthesis of ZJU-56-0.20; (b) upper part: fluorescent micrographs upon UV excitation (left) and fluorescent micrographs upon UV excitation (right), lower part: evolution of emission spectra upon UV excitation and (left) evolution of emission spectra upon excitation using 710 nm; (c) top view of two-photon excited fluorescent image of a 2D code stack. Scale bar equal to 25 μm (left), reconstructed lateral image along the indicated line in panel a (middle), lateral view imaged by using one photon fluorescence (right); (d) three-dimensional reconstructed image of the stacked 2D code pattern. (left) Intensity profiles of the fluorescent codes along lines 1 and 2 in panels b and c, respectively (right).112 Reprinted with permission from American Chemical Society, copyright 2015. | ||
The porosity of MOFs, together with their NLO properties can be used for various applications. De Vos's group used MOF single crystals as the platform to fabricate metallic microstructures and patterns by the two-photon induced reduction of Ag+ ions into metallic 3D structures.113 MOF-5 single crystals have been selected here as the host due to their high porosity allowing for sufficient diffusion of metal ions into the pores. In a similar manner, the Zn4O13 metal-nodes bridged by terephthalate linkers,114 which together act as an absorbing light antennae were used as a matrix enhancing the local reduction of Ag+ cations. Thus, the single crystals were soaked in an ethanolic AgNO3 solution to diffuse Ag+ ions into the pores of the MOF. Upon excitation of this composite matrix with a focused pulsed 780 nm laser beam, Ag-metallic dots have been created by the local reduction of the Ag+ ions. By controlling the exposure time and changing the location of the focused beam, various structures and patterns were obtained, such as two 2D quick-response (QR)-codes at different depths of the single crystals which are separated by 10 μm in the 3D space (3D controlled patterning) (Fig. 10). By proper design and fabrication of different metallic patterns, metallo-dielectric composites can easily be obtained for applications in various microelectronic and optoelectronic devices. Moreover, this technique has a high potential to fabricate different size and shaped metallic nano-particles in the MOF composites (nanoparticles@MOF) which is highly desirable for various catalytic and opto-electronic applications.115,116
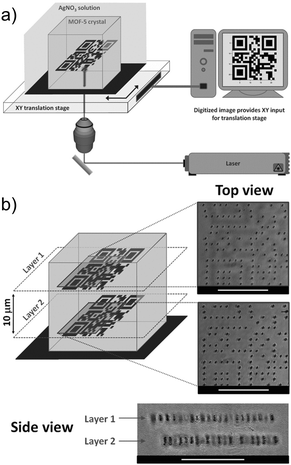 | ||
| Fig. 10 (a) Schematic representation of direct laser writing setup. (b) 3D control over pattern generation. Top and side views of two QR codes written inside a single MOF-5 crystal in planes spaced 10 μm apart. The side view was obtained by tipping the crystal. Scale bars: 25 μm.113 Reprinted with permission from John Wiley and Sons, copyright 2011. | ||
The TPEF has also been used to assess the pore size and accessible space in MOFs using various dye molecules.117 It is well known that some of the MOF frameworks are vulnerable to the removal of the lattice solvent and activation procedures. It follows that the estimation of the pore aperture size and guest accessible space of these materials is a challenge, as the regular gas sorption techniques are not very helpful in this situation, leaving crystallographic calculations of void spaces as alternatives. Instead, by replacement of lattice guest molecules to fluorescent dyes, one can prepare a map of fluorescence from guests in MOFs, which can be used e.g. to assess the available void space or to determine diffusion parameters. In this regard, two-photon microscopy would be a better technique than one-photon excitation due to the much higher resolution of excitation and possibility of in-depth penetration (3D scanning).
Jeong and co-workers selected various two-photon active dye molecules and incubated the MOF crystals in these dye solutions. The examination of these dye@MOF composite crystals under a two-photon fluorescence microscope allowed estimation of the possible accessible size of the molecules, which could be loaded into the MOFs.117 For this, MOF-5, KUMOF-2 and KUMOF-1 with aperture diameters of 9.248 Å, 12.107 Å and 16.018 Å, respectively, have been synthesized and probed with 2PA dye molecules. The pores of the MOF-5 were found to be accessible for dye molecules whose smallest dimension is equal to 3.5 Å (dimensions of the probed dye: 12.6 × 6.7 × 3.5 Å3). For larger molecules exceeding 5.1 Å size, the dye molecules remained trapped at the periphery of the crystal walls (Fig. 11). Similarly, KUMOF-1 and KUMOF-2 can accommodate molecules with dimensions up to 8.4 Å and 6.1 Å respectively. The method is a helpful tool that can also be used for MOFs with an unknown crystal structure and also for amorphous porous compounds in which it is hard to predict the solid-state structure. Moreover, this technique provided a semi-quantitative description of the pore sizes and also demonstrated the proof-of-concept two-photon tracing of diffusion processes, by the exchange of the lattice molecules to the two-photon emissive species. In our opinion, in future also of primary interest would be time- and spatially-resolved tracing of molecular diffusion within MOFs. Transport phenomena within pores are much more complex than diffusion in liquids due to the presence of a confining environment and host–guest interactions. Two-photon microscopy seems to be an ideal probe for real-time imaging of these processes, which will allow for more conscious design of catalytic, molecule-separating or drug-carrying MOFs.
 | ||
| Fig. 11 The optical images of MOF crystals upon soaking in dye molecules. The exchange of dye molecules in MOF crystals with small sized dye (left) and no-exchange of dye molecules with MOF crystals with the use of large dye molecules (right).117 Reprinted with permission from Royal Society of Chemistry, copyright 2014. | ||
6. SHG and THG in CPs
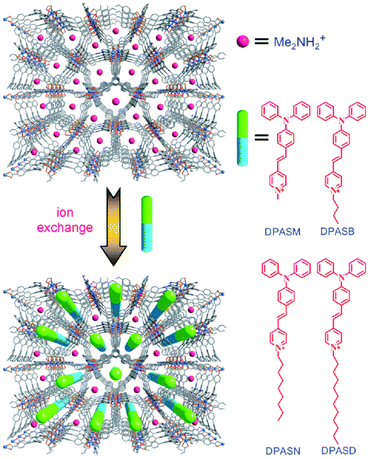
Together with other crystal noncentrosymmetry-related properties (such as ferroelectricity, piezoelectricity, and circular dichroism) the SHG process has been quite early recognized as a field in which CPs may be competitive materials. A virtually unlimited number of combinations of ligands and metal ions is probably the main reason why a plethora of papers on the SHG process in non-centrosymmetric polycrystalline CPs appeared, especially in the search of structure–property relationships.118–120 Extensive research in this field was the topic of several reviews throughout years.19–24 In a recent review, the SHG process in single crystals of CPs has been covered.19 Keeping in mind already documented and reviewed advances, we would like to highlight only selected papers, which open up new directions in SHG-characterization of CPs. This section also mentions the first report of third-harmonic generation (THG) in MOFs.Centrosymmetric MOFs, although lacking intrinsic second-order nonlinearity, can serve as hosts for external molecules, whose ordered arrangement within pores can impart the SHG property. A remarkable example of such an approach is porous anionic ZJU-28 MOF.121 It has been demonstrated that dimethyl ammonium (DMA) cations (as a result of DMF hydrolysis) present in the structure of ZJU-28 can be post-synthetically exchanged to dipolar alkyl-pyridinium hemicyanine dyes. This exchange is achieved by simple soaking the MOF materials in a concentrated dye solution. The length of the alkyl chain attached to the quaternary pyridinium nitrogen atom was found to be a crucial factor necessary for the creation of the second-harmonic activity (Fig. 12). Across the four dyes investigated, the exchange with the dodecyl derivative (DPASD) resulted in the highest SHG response (18.3 times that of α-quartz), while the exchange to the methyl-analogue (DPASM) led to SHG activity equal to 0.25 versus α-quartz (powder SHG measurements were conducted using a 1064 nm laser). Positive correlation of the SHG strength with alkyl chain length suggests that they play a directing role, most probably owing to two mechanisms: firstly, they restrict the molecule rotation within the MOF channels, so dipole moments of dye molecules are oriented roughly on the same axis. Secondly, their structure allows for head-to-tail arrangement, which separates positive charges and minimizes the occurrence of the centrosymmetric dimers.
 | ||
| Fig. 12 Upper part: The anionic structure of ZJU-28 MOF, constructed from 4,4′,4′′-benzene-1,3,5-triyl-tribenzoic acid and indium ions. Dimethyl ammonium cations are drawn as purple spheres. Lower part: The structure of ZJU-28 MOF in which some of the dimethyl ammonium cations have been exchanged by hemicyanine dyes aligned within the channels (green-blue rods). Structural formulae in the right represent dyes used for ion exchange.121 Reprinted with permission from John Wiley and Sons, copyright 2012. | ||
It can be envisioned that the concept of postsynthetic counterion exchange can be used not only to induce the SHG property within the centrosymmetric material, but also to enhance already present SHG activity in non-centrosymmetric MOFs.122 Following this route, Han et al. prepared a pair of enantiopure MOFs using Cd(II) ions, V-shaped 4,4′-oxybisbenzoic acid, and L- or D-2-amino-1-propanol (the resulting MOFs called 1L and 1D, respectively). The aminoalcohol served as a chirality-inducing agent as well as a counterion. The investigated L-homochiral MOF was firstly subjected to ion exchange with Li+ ions, and the obtained intermediate material was ion-exchanged with 4-nitroaniline (HA@1L), L-phenylalaninol (L-HPA@1L), and also with L-phenylglycinol (L-HPG@1L). Ion exchanges led to 1.3, 3.2, and 5.2-fold increase of SHG intensity versus the parent material, respectively (Fig. 13a). As can be seen, the use of highly polar 4-nitroaniline resulted in a moderate increase; this has been rationalized by the low rate of ion-exchange to this compound.
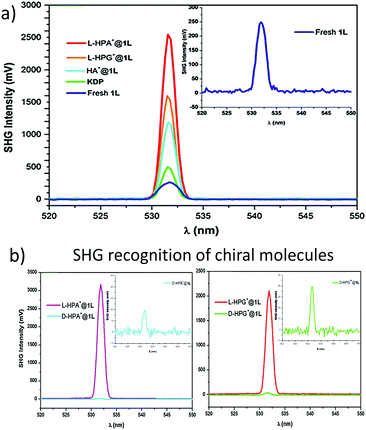 | ||
| Fig. 13 (a) SHG spectra traces of KDP, fresh 1L, and exchanged materials L-HPA@1L, L-HPG@1L, HA@1L. (b) The comparison of intensities of SHG signals of L-HPA@1L, D-HPA@1L (plot to the left) and L-HPA@1L, D-HPA@1L materials (plot to the right). The dependence of SHG activity on the absolute configuration of the guest can serve as a tool for differentiation of enantiomers.122 Reprinted with permission from Royal Society of Chemistry, copyright 2015. | ||
The presented homochiral MOF has been used as a platform for SHG sensing of chiral molecules. Treatment of L-homochiral MOF (1L) with D-phenylalaninol and D-phenylglycinol resulted not only in increased exchange efficiencies of those compounds when compared to L analogs (which in fact is the exemplification of the chiral recognition), but most importantly, led to significantly decreased SHG intensities. In such a way, the absolute configuration of the analyte can be determined by comparison of SHG intensities (Fig. 13b).
ZIF-8 is probably one of the most well-known MOFs especially in the context of gas sorption and separation. However, its interesting properties are not limited to gas storage. For example, Cleuvenbergen et al.102 demonstrated synthesis-dependent SHG activity of ZIF-8 nano- and microcrystals. ZIF-8 crystallizes in the I![[4 with combining macron]](https://www.rsc.org/images/entities/char_0034_0304.gif) 3m space group of the cubic crystal system, which lacks an inversion center. The noncentrosymmetric character of the materials has been additionally proved by SHG polarization microscopy experiments. It was found that SHG activity is related to the nucleation rate, since ZIF-8 microcrystals obtained in the classical hydrothermal manner revealed the biggest 〈deff〉 coefficient (0.25 pm V−1), while the nanocrystals afforded using a fast precipitation method from methanolic solution have shown the lowest second-order nonlinearity (〈deff〉 = 0.05 pm V−1).
3m space group of the cubic crystal system, which lacks an inversion center. The noncentrosymmetric character of the materials has been additionally proved by SHG polarization microscopy experiments. It was found that SHG activity is related to the nucleation rate, since ZIF-8 microcrystals obtained in the classical hydrothermal manner revealed the biggest 〈deff〉 coefficient (0.25 pm V−1), while the nanocrystals afforded using a fast precipitation method from methanolic solution have shown the lowest second-order nonlinearity (〈deff〉 = 0.05 pm V−1).
It has been proposed that crystal defects caused by faster nucleation may result in the subtle reorganization of 2-methylimidazole linkers. Indeed, as presented in Fig. 14, the tilting of 2-methylimidazole ligands introduces local centrosymmetry, which in consequence leads to partial cancellation of the SHG effect. These findings were corroborated theoretically by DFT calculations of hyperpolarizability on various models containing from one to twenty-four Zn(II) centers. Additionally, the nano- and microcrystals were found to be highly robust upon laser irradiation, which stays in agreement with the materials’ chemical and thermal stability known for ZIF-8-type MOFs.
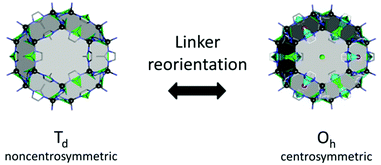 | ||
| Fig. 14 Schematic view of the possible reorientation of 2-methylimidazole ligands, which creates the inversion center.102 Reprinted with permission from American Chemical Society, copyright 2016. | ||
The great majority of existing SHG studies on CPs report SHG efficiencies determined using pumping at a single discrete wavelength only, most commonly 800 or 1064 nm. Such an approach gives a rough estimation of SHG performance of a given CP, but only when the one- and two-photon resonances are not interfering. In other words, if one- and two-photon absorption bands are present at the fundamental or second harmonic wavelength, then the SHG response becomes strongly wavelength-dependent. Thus, to compare the performance of different materials the regions in which the SHG process is resonance-suppressed or enhanced need to be identified which calls for the use of the spectrally-resolved SHG (SR-SHG) technique.
A series of isostructural tetraphenylmethane-based tetraphosphonate diester CPs with cobalt(II) halides (Cl−, Br−, and I− called 1-Cl, 1-Br, and 1-I, respectively) served as a proof of this concept.123 Exposure of these materials to femtosecond laser pulses in the 750–2000 nm range revealed that SHG efficiency is strongly dependent on the counterion present in the CP. For example, 1-Cl revealed two maxima in the SHG action spectra (versus reference material, KDP: 1150 nm – 0.1 and 1575 nm – 0.015) but iodide analogue 1-I showed one maximum in the deep infrared part of the spectrum solely (at 1575 nm – 0.074 of KDP). These results point to remarkable anion-tunability of the SHG response mainly via shifting of the absorption maxima of tetrahedral cobalt(II) d–d transitions.
For each compound, the SHG action spectra were compared with solid-state absorption spectra plotted versus once and twice the wavelength. The degree of self-absorption of the exciting wavelength can be assessed from the absorption spectrum of the CP (plotted in the usual way, against the wavelength). On the other hand, the emitted second harmonic will be self-absorbed as well, by states at the twice shorter wavelength – this is why the solid state absorption spectrum is also replotted versus twice the wavelength. The overlay of these two absorption plots allows for the determination of the ‘optical windows’ in which overall self-absorption of both the exciting and emitted wavelength is the lowest, and consequently, the SHG response is expected to be the highest (compare plots a and b for 1-Cl in Fig. 15). In this manner one can explain well the maxima observed in the SHG action spectrum, although only qualitatively.
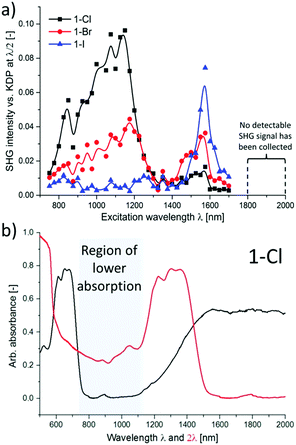 | ||
| Fig. 15 (a) Plots of normalized SHG intensity collected at λ/2 as a function of excitation wavelength λ for 1-Cl, 1-Br, and 1-I. (b) Overlays of the solid-state absorption spectra of 1-Cl plotted against one and two times the wavelength (black and red lines, respectively). The optical window region is highlighted in grey.123 Reprinted with permission from American Chemical Society, copyright 2015. | ||
Third harmonic generation (THG) is governed by a third-order optical susceptibility χ(3)(−3ω; ω, ω, ω); similarly to SHG, it belongs to the family of parametric processes.
Liu et al. realized a THG study of a MOF (MOF-1), which previously was described to reveal two-, three-, and also four-photon induced emissions (see “Two-photon absorption in CPs” section).124 Indeed, in this reinvestigation the excitation of solid samples resulted in both emission of photoluminescence and of a third harmonic signal (Fig. 16a). The individual character of these emissions has been confirmed with power-dependence measurements (Fig. 16c and d).
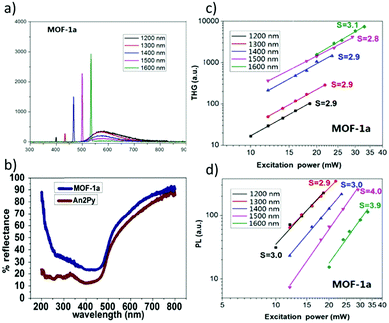 | ||
| Fig. 16 (a) PL and THG emission spectra obtained by femtosecond excitation in the 1200–1600 nm range, (b) solid state reflectance spectra of the ligand (An2Py) and of MOF-1a, (c) log–log plot of THG intensity as a function of excitation power, (d) log–log plot of PL intensity as a function of excitation power.124 Reprinted with permission from American Chemical Society, copyright 2016. | ||
The determination of THG strength for α-quartz and for MOF-1 allowed us to calculate the effective value of third-order optical susceptibility (χ(3)), equal to (1.5–0.8) × 10−11 esu for the polycrystalline sample. This value is approximately three orders of magnitude greater than that for α-quartz (2.6 × 10⁻¹⁴ esu) which can be ascribed to the biradical as well as the donor–acceptor structure of the participating ligand.
The observed suppression of THG intensity for excitation wavelengths in the 1000–1300 nm range was explained on the basis of the self-absorption effect since the third harmonic radiation (333–433 nm) falls within the range of the S0 → S1 ligand absorption band as shown in Fig. 16a and b. Note the analogy to the SR-SHG comparative analysis with solid-state absorption spectra discussed in the previous paragraph. As a possible cause of increased THG intensity at 1600 nm, a resonant enhancement via the S1 state was also suggested.
The same research group investigated the centrosymmetric one-dimensional CP (prepared from An2Py molecules, benzoate and zinc ions, but structurally different than the material described in the previous paragraph, MOF-1) on which was demonstrated the possibility of obtaining multiple nonlinear phenomena with the use of single excitation.125 For example, excitation of the CP at 1200 nm elicited THG, SHG, and comparatively weak three-photon induced fluorescence with a maximum at 615 nm. Moreover, it was found that the maximum intensity of the respective NLO phenomenon is dependent on the exciting wavelength: THG was strongest when exciting at 1500 nm, while the strongest SHG and two-photon fluorescence were achieved when exciting at 1200 and 800 nm, respectively.
Worth highlighting is the fact that an SHG response was observed, despite the centrosymmetric space group of the material (triclinic P![[1 with combining macron]](https://www.rsc.org/images/entities/char_0031_0304.gif) ). The authors of this research provided two explanations. Firstly, they suggested that metal ions may exert a static electric field on the four benzoate residues, shifting the electron density, in result giving local noncentrosymmetry electric charge on these groups. The second explanation relies on the presence of crystal defects, introduced for example by substitution of benzoate groups with nitrate ions, which would impart local breaking of inversion symmetry.
). The authors of this research provided two explanations. Firstly, they suggested that metal ions may exert a static electric field on the four benzoate residues, shifting the electron density, in result giving local noncentrosymmetry electric charge on these groups. The second explanation relies on the presence of crystal defects, introduced for example by substitution of benzoate groups with nitrate ions, which would impart local breaking of inversion symmetry.
7. Triplet–triplet annihilation (TTA)-based upconversion
7.1. Introduction
Photon upconversion (UC, also referred to as frequency upconversion) is meant as the photophysical process of converting low-energy photons to photons of higher energy.126,127 The previous sections covered nonparametric NLO processes of simultaneous absorption of multiple-photons leading to upconverted emission and parametric processes of second- and third-harmonic generation. Other known upconversion processes, but of one-photon underlying origin, include multistep excitation of lanthanides by making use of their discrete and long-lived atomic states and triplet–triplet annihilation (TTA) of organic chromophores.128–132 In contrast to multi-photon processes, requiring excitation power densities of MW cm−2 to GW cm−2,126 these two upconversion processes can be exploited even with irradiation with low-cost continuous-wave laser diodes. TTA does not require the simultaneous absorption of two photons, which allows it to work at very low power excitations.67,126,133 It is not formally an NLO process as it utilizes ordinary one-photon absorption, although the bimolecular character of the exciton interactions makes it similar to two-photon NLO processes.The mechanism of TTA-UC involving two different species, a donor and an acceptor is as follows (but it should be noted that TTA is also well known in single component molecular crystals). One-photon excitation of a triplet sensitizer (donor) to a singlet state S1 is followed by intersystem crossing (ISC) to give a triplet state T1. Alternatively, the triplet states can sometimes be obtained with good efficiency by direct S0 → T1 excitation. This triplet energy is transferred to an acceptor molecule (emitter) via triplet–triplet energy transfer (TTET). If the excitation can diffuse in the system, either by molecular diffusion (in liquid) or by diffusion of excitons (in solid), there is a possibility that two excitons may interact within their lifetime to form a higher excited singlet state, S1 and a ground state S0 by the TTA. The resultant excited singlet state emits delayed upconverted fluorescence with an anti-Stokes shift with respect to the initial excitation wavelength (Fig. 17a). It should be noted that the triplet energy transfer and the TTA process both occur via short-range exchange (Dexter energy transfer). Therefore, an overlap of the wave functions between donors and acceptors is strongly required (Fig. 17b).67,128,134,135
The UC quantum yield (ΦUC, the fraction of upconverted photons per absorbed photons) can be described as the product of the quantum efficiencies of all involved photophysical processes according to the following equation:
 | (6) |
| Ith = (αΦET8πDTa0)−1(τ)−2 | (7) |
So far, the most effective TTA-UC systems could be achieved by dissolution of the active media in a suitable solvent, since this architecture allows fast diffusion of the excited molecules. However, molecular diffusion-based UC suffers from solubility limits of aromatic chromophores. The use of volatile organic solvents and the deactivation of excited triplet states by oxygen require material handling under an inert atmosphere. Furthermore, the diffusion constant even in low-viscosity solvents is often not high enough to achieve maximum UC efficiency. A way of solving these problems is the blending of the active compounds into specific solid polymers or viscous liquid materials that could act as matrices which prevent or reduce the triplet quenching by oxygen. Nevertheless, the usage of matrices restricts the diffusion capability of the excited triplet emitters enormously, which necessitates the use of high power incident light. Consequently, it is of big interest to develop systems, which show oxygen blocking abilities and allow efficient upconversion under low excitation powers.134,137–139
Kimizuka et al. demonstrated the principle of triplet energy migration-based upconversion (TEM-UC) by combining the concept of TTA-UC and molecular self-assembly.137,139–143 The basic idea behind TEM-UC is to regularly self-assemble acceptor molecules in the near vicinity such that the triplet energy can migrate among the organized acceptor arrays via electron exchange. Moreover, the donor molecules have to be integrated into these arrays adjacent to an acceptor molecule ensuring efficient sensitization of the acceptor triplets. In the assembly, schematically shown in Fig. 18, the excitation of a sensitizer molecule is followed by a sequence of the donor to acceptor TTET events, triplet energy migration among the acceptor molecules and finally TTA to emit upconverted light (Fig. 18). Less concentration quenching due to the spatial alignment of acceptor molecules as well as the larger diffusion constants of solid state triplet excitons allows TEM-UC to lower the incident excitation intensities immensely.138 A proof-of-concept of TEM-UC was obtained on a high number of model systems ranging from condensed π-liquid acceptor systems over ionic liquids to non-aqueous molecular membranes, gels, molecular crystals and recently in MOFs and CPs.132,138
7.2. Triplet–triplet annihilation in MOFs and CPs
Kimizuka et al. demonstrated triplet energy migration in a MOF by evenly arranging emitter molecules in the near vicinity and incorporating a donor moiety into the system. Employing 4,4′-(anthracene-9,10-diyl)dibenzoate (adb), Zn(II) ions and 1,4-diazabicyclo[2.2.2]octane (dabco) as a co-ligand gives [Zn2(adb)2dabco], which was originally reported by Kaskel et al.137,144 This MOF shows two dimensional sheets with the adb ligands coordinated to pairs of Zn(II) ions, which are pillared by dabco units. Following the bottle-around-ship approach,145,146 Kimizuka's group encapsulated Pt(II) octaethylporphyrin (PtOEP) into this MOF and determined the doping degree of PtOEP with absorption and phosphorescence spectroscopy, resulting in a donor to acceptor ratio of 1![[thin space (1/6-em)]](https://www.rsc.org/images/entities/char_2009.gif) :
:![[thin space (1/6-em)]](https://www.rsc.org/images/entities/char_2009.gif) 1100 of monomerically doped donor@MOF. Furthermore, donor@MOF nanoparticles were synthesized utilizing microwave reactions and, subsequently, the donor@nano-MOF particles were surface modified with Coumarin 343 molecules via covalent surface bonding (donor@nano-MOF@collector). This approach was chosen since it still remains difficult to ensure the compatibility of fast triplet energy migration with high photoluminescence efficiency. TEM can only be fast when the neighbouring acceptor molecules have close contact. However, the acceptor fluorescence quantum yield often drops in closely packed molecular arrays, due to nonradiative relaxation processes. Combining a sequence of photophysical steps like triplet energy migration, annihilation and upconverted singlet energy collection (TEM-UPCON) produces a priority photoluminescence pathway, which circumvents the nonradiative decay of upconverted singlets. Each of the particles, donor@nano-MOF and donor@nano-MOF@collector then were dispersed in poly-vinylalcohol polymer (PVOH) to obtain solid films, which showed stable upconverted emission in air. The processes were quantified by fluorescence and absorption spectroscopy, time-resolved PL measurements as well as quantum yield determinations (Fig. 19).
1100 of monomerically doped donor@MOF. Furthermore, donor@MOF nanoparticles were synthesized utilizing microwave reactions and, subsequently, the donor@nano-MOF particles were surface modified with Coumarin 343 molecules via covalent surface bonding (donor@nano-MOF@collector). This approach was chosen since it still remains difficult to ensure the compatibility of fast triplet energy migration with high photoluminescence efficiency. TEM can only be fast when the neighbouring acceptor molecules have close contact. However, the acceptor fluorescence quantum yield often drops in closely packed molecular arrays, due to nonradiative relaxation processes. Combining a sequence of photophysical steps like triplet energy migration, annihilation and upconverted singlet energy collection (TEM-UPCON) produces a priority photoluminescence pathway, which circumvents the nonradiative decay of upconverted singlets. Each of the particles, donor@nano-MOF and donor@nano-MOF@collector then were dispersed in poly-vinylalcohol polymer (PVOH) to obtain solid films, which showed stable upconverted emission in air. The processes were quantified by fluorescence and absorption spectroscopy, time-resolved PL measurements as well as quantum yield determinations (Fig. 19).
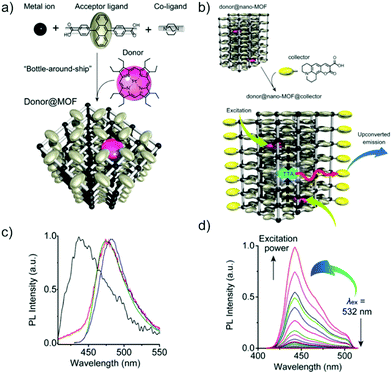 | ||
| Fig. 19 Bottle-around-ship, donor incorporation in a pillared Zn(II), dba and dabco MOF (left side) and surface anchored singlet collector molecules (right side) clarifying effective singlet energy transport to collector molecules. In-air photoluminescence spectra of the donor@nano-MOF in PVOH polymer film and fluorescence spectra of benzene dispersions of nano-MOF (black) and donor@nano-MOF@collector (red) as well as protonated and deprotonated Coumarin 343 (blue respectively green).147 Reprinted with permission from American Chemical Society, copyright 2016. | ||
The fluorescence spectra of donor@MOF showed a blue emission at 440 nm after excitation at 532 nm. Energy transfer, however, reflected in the average lifetime of the fluorescence, was shorter for the MOF compared to the pure ligand adb (1.4 ns and 4.1 ns, respectively), which is a typical feature for condensed materials. Nevertheless, the donor@MOF showed a clear upconversion (440 nm band), indicating the successful inclusion of PtOEP as well as triplet migration and triplet–triplet annihilation processes inside the MOF. The polymer embedded donor@nano-MOF crystals showed a quantitative TTA quantum yield ΦTTA of 97%, a triplet lifetime of 3.5 ms and a remarkably low threshold intensity Ith of 5.7 mW cm−2, but a low upconversion quantum yield ΦUC of 0.35%. Compared to the donor@nano-MOF@collector species in PVOH, the fluorescence quantum yield ΦFL could be increased to 40% and the overall quantum upconversion yield to 2.3% at an excitation power of 6.2 mW cm−2, illustrating the positive singlet energy transfer of upconverted singlets to the surface bonded Coumarin molecules.137
Recently, Harvey and his co-workers found TTA and TEM in a copper based and highly dense CP, [(Cu2Br2)(μ-EtS(CH2)4SEt)]148 The network of this compound consists of centrosymmetric Cu(μ2-Br)2Cu rhomboids (= SBU), which are linked by μ2-SEt donors in a Cu–S–Cu fashion. An absorption band at 347 nm was confirmed to be a S0 → T1 excitation, elucidated by temperature dependent absorption measurements and underpinned by TD-DFT calculations. The CP shows a triplet lifetime of 3.45 ns at 298 K. Upon increasing the laser power and monitoring the λmax values, a quadratic dependence between the intensity of photoluminescence and the laser power was found, whereas cooling to 77 K and performing the same measurements gave a linear dependence, which is due to a temperature restriction of the acceptor carrier movement making recombination processes negligible and resulting in a slope of 1 (Fig. 20d). Moreover, the triplet lifetime of the CP stayed constant during the laser power dependent measurements at 298 K. These facts clearly demonstrated the presence of another efficient energy dissipation process, which is triplet energy migration over the frontier orbitals of the rhomboid Cu–Br moieties, followed by TTA. However, no measurements of UC quantum yield or Ith have been performed to quantify the ongoing processes.
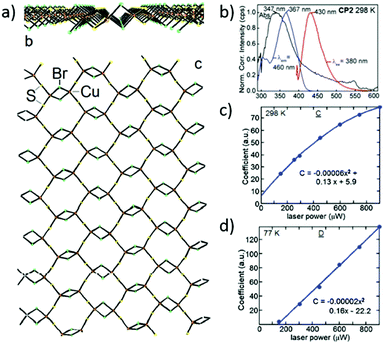 | ||
| Fig. 20 X-ray structure of [(Cu2Br2)(μ-EtS(CH2)4SEt)]n along the b and the c axes (left side). Absorption (black) excitation (red) and emission (blue) spectra as well as the λmax dependency on the laser power at 298 K (quadratic fit) and 77 K (linear fit).148 Reprinted with permission from Royal Society of Chemistry, copyright 2016. | ||
Another approach has been demonstrated by Howard and Richards et al. who synthesized surface-anchored metal–organic framework (SURMOF) heterojunctions by layering a series of A–B–A or B–A heterostructures.149 Herein, A stands for an emitter layer and B for a sensitizer layer. Using the layer-by-layer deposition technique,150,151 Pd(II) 5,15-diphenyl-10,20-di(4-carboxyphenyl) porphyrin (Pd-DCP, B-layer) and 4,4′-(anthracene-9,10-diyl)dibenzoate linkers (adb, A-layer) were spray-cast from ethanol onto a silicon substrate (SURMOF-2 class,152,153 dicarboxylate terminated linkers and Zn(II) nodes). Starting with the A–B–A structure, the thicknesses of the B layer were varied which allowed the upconversion properties to be studied as a function of the layer's width. The layer arrangement resulted in upconverted blue emission with threshold intensities in the range of 25 to 117 mW cm−2 (layer thicknesses 16 to 165 nm for the B-layer). Due to increasing intersystem crossing events, one would assume that with increasing B-layer width, the threshold intensity Ith would be lowered. However, this assumption was not confirmed by experiments, as checked in the studies of the A–B–A heterostructure. This fact was traced back to triplet trapping inside the sensitizer layer because of possible inhomogeneities in the structure. They then turned towards the B–A heterostructures and tried to reduce the number of defect sites by sonication of the solution during the deposition process. A B–A bilayer was synthesized and the upconversion properties were studied as a function of the layer widths. The sonicated B–A stacks all exhibited much lower threshold intensity values than the A–B–A layers. Furthermore, the lowest threshold was found for the thickest B and the thinnest A layer, as originally hypothesized. Nevertheless, the SURMOF heterojunction approach for TTA-UC still suffers from aggregate-like state affected triplet lifetimes and low fluorescent quantum yields for the emitter layers due to aggregate quenching. However, achieving the expected trend in threshold intensities highlights a unique advantage of SURMOF heterojunctions, namely, providing a spatial method for tailoring the UC threshold.
8. Stimulated emission and Lasing in MOFs
8.1. Introduction
In recent years, lasers became ubiquitous in our daily life from scanners, printers, sensors and laser displays to commercial automobile headlights. Although most applications are currently dominated by solid-state lasers using either semiconductor materials or rare-earth doped crystals, it is still of high interest to find alternate solid-state materials with high stability, wide applicability, low fabrication cost and environmentally friendly synthesis and processing methods. Hybrid materials such as CPs and MOFs are very interesting candidates that may provide a great flexibility in these challenging applications.For creating a laser, one needs three main components, a gain material, optical feedback or a resonator and a pumping source. In recent years, hybrid materials have been shown to be very promising materials as the gain media.6 In this regard, MOFs are the eminent candidates which could be used in various applications due to their solid-state character, stability, tunability, and tailorability of properties with a judicious choice of metal-nodes and organic linkers as well as potentially easy large-scale and economical production.
As mentioned in earlier sections, MOFs may contain highly luminescent organic linkers, which are coordinated to the metal-nodes. Besides, luminescent chromophores can also be introduced into the pores of MOFs as guest molecules (dye@MOF composites) to generate various optical properties.154 Compared to classical dye lasers, lasers based on MOFs may still provide broad wavelength tunability characteristics for solution dye lasers but also demonstrate unique optical properties due to the control over the arrangement of molecules, regular ordering and the suppression of radiationless decays, such as aggregation caused quenching (ACQ), nonradiative intramolecular charge transfer (ICT) and twisted ICT (TICT). Such quenching mechanisms usually cause difficulties in obtaining facile population inversion. Moreover, the smooth surfaces of the single crystals and the regular arrangement of molecules in MOFs would help to obtain in-built high-quality resonant cavities and may lead to the fabrication of low threshold miniaturized lasers with high performance.155–158
The potential of a material to be used as a gain medium in lasers can be evaluated by observation of the presence of stimulated emission, even without any feedback mechanism, through the following main indicators: the power dependence profile of the fluorescence intensity and the fluorescence spectrum profile as well as its lifetime. With increasing pumping, a change in the slope of the fluorescence dependence on pumping power can be observed and that pump power is considered to be the threshold power (a threshold pump pulse energy Eth can also be quoted). The presence of stimulated emission also leads to shortening of the fluorescence lifetime and narrowing of the fluorescence spectra that may additionally be modified by the presence of feedback.111,125,159
8.2. Feedback mechanisms in MOFs
There are several scenarios for providing the feedback that transforms stimulated emission into lasing. A laser cavity can be simply formed by two mirrors that form a Fabry–Perot resonator. In the case of a material in the form of a plate with parallel faces, some spontaneous feedback will be provided by the reflections from those faces. Practical lasers use, however, highly reflective mirrors that are judiciously designed to provide optimum operation in certain cavity modes. Miniaturized systems such as semiconductor lasers and fibre lasers often use technologies such as feedback by Bragg gratings (distributed feedback, DFB). An alternate geometry of a laser is that of a ring cavity that can be formed by several mirrors or by splicing optical fibres. In the case of the gain medium in the form of a disk or a polygon with smooth edges, so-called whispering gallery cavity modes (standing waves formed in the cavity by total internal reflection) may exist. These resonances depend greatly on the geometry of the resonator cavity.Finally, lasing is also possible without a strictly defined cavity, if the feedback is provided by random scattering in a highly disordered medium. Such random lasing may be relevant for applications of gain media that are available in the form of microcrystals rather than large single crystals that are required for building lasers in more conventional ways.160
Narrowing of emission peaks arising from stimulated emission in the presence of feedback is quantified by the quality factor (Q-factor) which is an important characteristic of a laser cavity. It is defined as the ratio between the resonant frequency and full-width at half-maximum (FWHM) of the emission peak.
| Q = f/δf | (8) |
8.3. Recent advances in MOF based materials for lasing
Most of the so far reported work has concerned lasing from dye@MOF composites, where the cationic dye molecules have been infiltrated in the pores of anionic MOFs. Due to this encapsulation and immobilization of the dye molecules along a particular crystal axis with various non-covalent interactions, charge polarity has been enhanced in the material, resulting from the arrangement of the dyes, and the polarity enhancement has helped in the observation of polarity driven lasing. In addition, the confinement of dyes in the pores of MOFs helps to minimize the radiationless decay channels such as ACQ, TICT and other aggregation-derived mechanisms. Moreover, the smooth crystal surfaces and the regularly ordered arrangement of molecules in the framework have helped in the formation of in situ feedback structures and facilitated the formation of micro-sized laser cavities suitable for the development of micro-lasers. Depending on the arrangement, degree of freedom of the dye molecules in the pores of MOFs, and the polarity, multi-photon pumped lasing has also been observed in dyes@MOF crystal composites.One of the interesting types of dyes are intramolecular charge transfer (ICT) dyes, which usually show two different conformations, such as planar and twisted conformation. The planar molecules are known to show better optical performance compared to the twisted form. However, the stabilization of planar molecules in various applications is challenging because these molecules tend to stabilize in a non-fluorescent form, especially in polar solvents. In this regard, MOFs are the potential candidate matrices which could stabilize the radiative form due to the pore size, shape and morphology along with other noncovalent interactions. This causes the restrictive conformation of the dye molecules in the polar environments of the material without losing its optical effectiveness or the stabilization of the optically active form.
By taking this as an advantage, polarity driven wide-wavelength range tunable microlasers have been achieved by using a hemicyanine dye, DSMP (DSMP = (4-p-(dimethylamino)styryl)-1-methylpyridinium) as the ICT dye. For this, the DMA cations of bio-MOF-100 have been exchanged with DSMP cationic dye molecules. The reduction of non-radiative decay could be easily observed along with the enhancement of quantum yield of the dye molecules from <1.5% to 32% under UV excitation.
As mentioned above, the smooth surfaces of the regular rhombic dodecahedron structures of the crystal facets acted as in-built optical feedback and formed the resonant micro-sized laser cavity and helped in the production of lasing from the crystal at a laser fluence as low as 45 μJ cm−2 with a whispering gallery resonant feedback cavity mechanism. The change in microenvironment near these infiltrated dye molecules by changing the lattice solvent in the framework helped in the polarity controlled population distribution in locally excited (LE) and ICT states and enabled tuning the lasing wavelength over a wide range. Thus, by changing the lattice solvent of the material from pristine DSMP@bio-MOF-100 (highly polar) to toluene (much less polar), the wavelength of the lasers could be varied from 650 to 608 nm (λex = 500 nm) (see Fig. 21). Hence, these materials showed a proof-of-principle to tune the wavelength of the micro-lasers by changing the polarity environment within the material.
 | ||
| Fig. 21 (a) Schematic view presenting the solvation of MOF pores and dye molecules. (b) Blue shifting of the lasing peaks by decreasing the polarity of the solvent. (c) Fluorescence spectra of DSMP@bio-MOF-100 at different laser powers. (d) Plot showing the emission intensity dependence on laser pump density.157 Reprinted with permission from John Wiley and Sons, copyright 2016. | ||
Multi-photon pumped lasers are considered to be an important topic, among others, due to the potential biological applications of the process. The first solid-state two-photon pumped (2PP) laser from a MOF has been produced by Chen and Qian's group in 2013,155 where DSMP has been encapsulated in the pores of anionic bio-MOF-1. For this, single crystals of bio-MOF-1 ([Zn8(Ad)4(BPDC)6O]·2DMA, Ad = adeninate; BPDC = biphenyldicarboxylate) were synthesized and the DMA cations in the channels have been exchanged with the DSMP dye molecule through soaking (Fig. 22). Due to the nanochannel sizes, 7 Å and 10 Å of MOFs, the cationic DSMP molecules (dimensions 6.4 Å width and 14.3 Å length)155 have been oriented along the crystallographic c-axis. The infiltrated dye molecules were also stabilized by the π–π interaction. This oriented infiltration of the dye molecules in the MOF pores assisted in the polarization in the DSMP@bio-MOF-1 composite crystal and helped in the strong optical activity. The strong two-photon activity of the DSMP molecules with absorption cross-section ∼104 GM helped in the generation of two-photon pumped stimulated emission that showed sharp lasing peaks at 640 nm (acted as a red laser) upon excitation with a 1064 nm laser (Fig. 22b). Like mentioned above, the smooth surfaces of the MOF crystals acted as the optical feedback set-up and caused the micro-sized laser cavity formation to produce a laser with the threshold energy as low as 0.148 mJ (Fig. 22b). By using different crystal sizes, in other words controlling the cavity size, the mode spacing between the peaks has been controlled in these crystals, which confirmed the Fabry–Perot mechanism. The quality of the cavities (Q factor) in these composites was quantified as 1500.
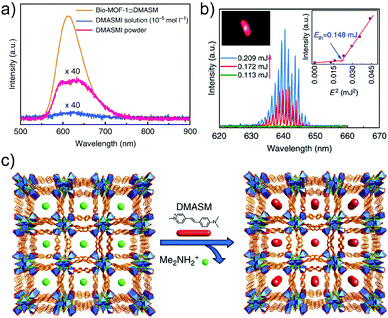 | ||
| Fig. 22 (a) Fluorescence spectra of DSMP in solution, solid-state powder and after impregnation in bio-MOF-1, (b) fluorescence spectra of DSMP@bio-MOF-1 and the power dependence plot (inset), (c) schematic view presenting the exchange of DMA cations with DSMP.155 Reprinted with permission from Nature publishing group, copyright 2013. | ||
The polarity in DSMP@bio-MOF-1 might not be enough to produce higher order lasing, such as three-photon pumped lasing, due to the relative freedom of movement of the DSMP (width of dye molecule 6.4 Å) molecules in the channels of bio-MOF-1 (channel size 7 and 10 Å). Hence, a new anionic MOF, ZJU-68 (H2[Zn3O(CPQC)3], CPQC = 7-(4-carboxyphenyl)quinoline-3-carboxylate), has also been synthesized from the same group157 with an average channel size of 6 Å, relatively thinner than bio-MOF-1. Due to the thinner channels, the exchange of these cationic dye molecules with the protons (cations) in the pores of ZJU-68 is not possible. So, in situ assembly has been conducted which resulted in the successful loading of dye molecules with 35% of the cationic moiety, (DSMP)0.33H1.67[Zn3O(CPQC)3] (DSMP@ZJU-68), and this loading percentage can be improved up to 40%. The orientation and the arrangement of the dye molecules along the c-axis in 1D channels of the MOF have been confirmed by electron density mapping using SXRD.162 Due to the very close size match between the dye and the pore size of the MOF, the degree of freedom of the dye molecules in the pores of ZJU-68 was much lower and showed better polarity in the material compared to DSMP@bio-MOF-1.155 Due to the tight confinement and high orientation of DSMP dye molecules in the framework, upon excitation with a 1380 nm laser, these crystals showed strong lasing peaks at ∼643 nm arising from the absorption of three photons simultaneously (three-photon pumped (3PP) lasing). The power dependence plot between the power of the laser and the fluorescence intensity showed that the threshold pump-energy to observe lasing was approximately equal to 224 nJ. Similarly, one- and two-photon pumped lasing (1PP and 2PP respectively) have also been investigated by exciting the single crystals with 532 nm and 1064 nm lasers, which showed single-mode and linearly polarized (degree of polarization >99.9%) lasing at low threshold of energies, 12.6 pJ with a Q-factor of 1165 for 1PP and 19.6 nJ with a Q-factor of 943 for 2PP. This is due to the aligned dye molecules in the single MOF microcrystal.162 The investigation of the feedback mechanism and optical cavity on these hexagonal prism crystals showed that in these crystals two-opposite crystal facets acted as a standing wave feedback resonator and caused the observation of a F–P optical feedback mechanism and the six walls of the hexagonal crystal helped to form a possible ring resonator and caused a whispering gallery type optical-feedback mechanism. These mechanisms have been confirmed to be responsible for 3PP lasing in DSMP@ZJU-68 composite crystals. However, this polarity-driven lasing from MOFs still needs significant studies both from experimental and theory.
Although strong lasing is possible from the dyes@MOF composite materials made by the impregnation/infiltration of the dye molecules in the pores of MOFs, they are not without disadvantages such as limitations of dye loading, optical properties, and thermal stability of the dyes in the MOF framework. Long-term stability of the dyes is known to be not optimal without any significant stability enhancement factors such as bonding to metal. Hence, there is still a great need to investigate the use of pure MOFs for the stimulated emission/lasing, where the chromophore-linkers are bridged between the metal-nodes and significant enhancement can be expected in the optical and thermal stability of these dye linkers compared to their incorporation in the pores of MOFs (Fig. 23).22
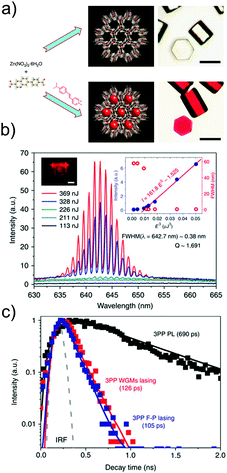 | ||
| Fig. 23 (a) Schematic view of ZJU-68 synthesis and DSMP@ZJU-68 and its optical images, (b) fluorescence spectra of DSMP@ZJU-68 upon excitation with different powered lasers, (c) time-resolved fluorescence spectra upon excitation of the MOF with different kinds of lasers.157 Reprinted with permission from Nature publishing group, copyright 2016. | ||
The highly nonlinear active In- and Zn-MOFs, which have been mentioned above in Section 4.2, also showed stimulated emission in the blue region of the visible spectrum with wavelength ∼472 nm (blue colour emission).101 The plot of the dependence between the fluence and the fluorescence intensity showed threshold pump fluences of 36 mJ cm−2 and 27 mJ cm−2 respectively. Possibly due to the tighter packing of the molecules in the space, Zn-MOF showed a lower threshold energy compared to the In-MOF with the same linker. Besides, the time-resolved photo-luminescence (TRPL) of In-MOF showed a decrease in fluorescence life-time from 900 ns to 500 ns after the stimulated emission has been observed. Similarly, Zn-MOF also showed a decrease in fluorescence life-time from 1.2 μs to 380 ns. Unlike regular stimulated emission/lasing active optical materials, the emission peak was observed in the blue/higher energy region of the fluorescence in these MOFs.5–7 Hence, theoretical calculations (density of states and transitions between these bands) were performed on the Zn-MOF, which showed that the band related to the STE with highest transition density is located at the higher region of fluorescence, hence causing the emission from the higher energy region of the fluorescent peak (Fig. 24).
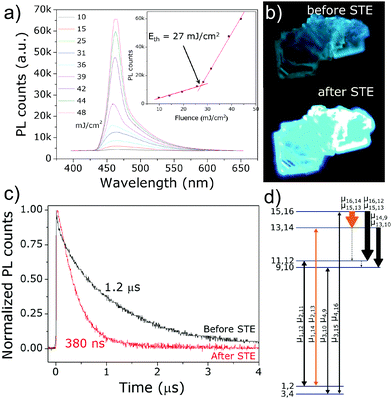 | ||
| Fig. 24 (a) Fluorescence spectra of Zn-MOF upon excitation with different powered laser pulses, (b) optical images of Zn-MOF before and after STE, (c) time-resolved fluorescence spectra of Zn-MOF before and after STE and (d) energy level diagram (density of states) of Zn-MOF and the transition densities between these energy levels or density of states.101 Reprinted with permission from John Wiley and Sons, copyright 2017. | ||
Thus, these studies open up new avenues to use MOFs as promising candidates to produce miniaturized solid-state lasers. By using diverse metal-nodes, organic chromophore linkers in different packing manners/arrangements in space, it will be possible to control the energy level structure of the material to optimize the generation of stimulated emission and lasing in MOFs as new generation solid-state lasing materials.
9. Conclusions
In the current review, we have summarized some preliminary reports that indicated that nonlinear optical effects in MOFs such as multi-photon absorption might provide high efficiencies, superior to those in other materials. We also highlighted that modified methodologies may need to be used to evaluate multi-photon cross-sections to avoid ambiguity in results through standardization of measurement techniques. At the present time, various extant literature reports have only limited validity for evaluations of the relative merits of the CP and MOF materials.Even the relatively scarce current results have already highlighted the importance of hybrid materials for applications involving NLO properties, upconversion and lasing. The reported proof-of-principle results have already indicated the possibility of outperforming various commercial materials. However, this is still a very new upcoming area of research and significant efforts are needed to evaluate in a reliable manner the basic parameters, which could influence e.g. the higher-order nonlinear optical characteristics of CPs and MOFs. To accomplish this, substantial theoretical work would also be needed to understand the results and postulate the basic principles as well as to provide some suggestions for the preparation of optimized materials for a given solid-state material future application.
The stability and performance of MOFs or CPs make them attractive potential candidates for solid-state nonlinear optical applications and miniaturization of solid-state optical devices. Besides, the possibility for the incorporation of magnetic and, possibly, electric properties through inorganic fragments would also be very easy and useful for various devices.
Acknowledgements
M. S. and J. K. Z. acknowledge financial support from the Polish National Science Centre under “Maestro” DEC-2013/10/A/ST4/00114 grant and the Faculty of Chemistry, Wrocław University of Science and Technology. D. M. would like to thank Faculty of Chemistry, Technical University of Munich (TUM) and the TUM graduate school for financial support. R. A. F. would like to acknowledge German Research Foundation for installation of Priority Program 1928 “COORNETs” (http://www.coornets.tum.de). The authors also would like to thank Dr Venkatram Nalla for fruitful discussions.References
- R. W. Munn and C. N. Ironside, Principles and applications of nonlinear optical materials, Blackie Academic & Professional, 1993 Search PubMed.
- V. Degiorgio and C. Flytzanis, Nonlinear Optical Materials: Principles and Applications, IOS Press, 1995 Search PubMed.
- K. Rottwitt and P. Tidemand-Lichtenberg, Nonlinear Optics: Principles and Applications, CRC Press, 2014 Search PubMed.
- L. Tong and J.-X. Cheng, Mater. Today, 2011, 14, 264–273 CrossRef CAS.
- A. J. C. Kuehne and M. C. Gather, Chem. Rev., 2016, 116, 12823–12864 CrossRef CAS PubMed.
- S. A. Veldhuis, P. P. Boix, N. Yantara, M. Li, T. C. Sum, N. Mathews and S. G. Mhaisalkar, Adv. Mater., 2016, 28, 6804–6834 CrossRef CAS PubMed.
- J. M. Pietryga, Y.-S. Park, J. Lim, A. F. Fidler, W. K. Bae, S. Brovelli and V. I. Klimov, Chem. Rev., 2016, 116, 10513–10622 CrossRef CAS PubMed.
- G. S. He, L.-S. Tan, Q. Zheng and P. N. Prasad, Chem. Rev., 2008, 108, 1245–1330 CrossRef CAS PubMed.
- B. Lebeau and P. Innocenzi, Chem. Soc. Rev., 2011, 40, 886–906 RSC.
- T. He, R. Chen, Z. B. Lim, D. Rajwar, L. Ma, Y. Wang, Y. Gao, A. C. Grimsdale and H. Sun, Adv. Opt. Mater., 2014, 2, 40–47 CrossRef.
- H.-C. Zhou and S. Kitagawa, Chem. Soc. Rev., 2014, 43, 5415–5418 RSC.
- Y. Cui, B. Li, H. He, W. Zhou, B. Chen and G. Qian, Acc. Chem. Res., 2016, 49, 483–493 CrossRef CAS PubMed.
- S. Kaskel, The Chemistry of Metal-Organic Frameworks: Synthesis, Characterization, and Applications, Wiley VCH Verlag GmbH, 2016 Search PubMed.
- Z. Hu, G. Huang, W. P. Lustig, F. Wang, H. Wang, S. J. Teat, D. Banerjee, D. Zhang and J. Li, Chem. Commun., 2015, 51, 3045–3048 RSC.
- Z. Wei, Z.-Y. Gu, R. K. Arvapally, Y.-P. Chen, R. N. McDougald, J. F. Ivy, A. A. Yakovenko, D. Feng, M. A. Omary and H.-C. Zhou, J. Am. Chem. Soc., 2014, 136, 8269–8276 CrossRef CAS PubMed.
- M. D. Allendorf, C. A. Bauer, R. K. Bhakta and R. J. T. Houk, Chem. Soc. Rev., 2009, 38, 1330–1352 RSC.
- Z. Hu, B. J. Deibert and J. Li, Chem. Soc. Rev., 2014, 43, 5815–5840 RSC.
- N. B. Shustova, T.-C. Ong, A. F. Cozzolino, V. K. Michaelis, R. G. Griffin and M. Dincă, J. Am. Chem. Soc., 2012, 134, 15061–15070 CrossRef CAS PubMed.
- L. R. Mingabudinova, V. V. Vinogradov, V. A. Milichko, E. Hey-Hawkins and A. V. Vinogradov, Chem. Soc. Rev., 2016, 45, 5408–5431 RSC.
- S. Du and H. Zhang, Struct. Bonding, 2014, 157, 145–165 CrossRef CAS.
- C. Wang, T. Zhang and W. Lin, Chem. Rev., 2012, 112, 1084–1104 CrossRef CAS PubMed.
- O. R. Evans and W. Lin, Acc. Chem. Res., 2002, 35, 511–522 CrossRef CAS PubMed.
- M. A. van der Veen, T. Verbiest and D. E. De Vos, Microporous Mesoporous Mater., 2013, 166, 102–108 CrossRef CAS.
- C. Wang, D. Liu and W. Lin, J. Am. Chem. Soc., 2013, 135, 13222–13234 CrossRef CAS PubMed.
- M. G. Kuzyk, K. D. Singer and G. I. Stegeman, Adv. Opt. Photonics, 2013, 5, 4–82 CrossRef.
- M. Albota, D. Beljonne, J.-L. Brédas, J. E. Ehrlich, J.-Y. Fu, A. A. Heikal, S. E. Hess, T. Kogej, M. D. Levin, S. R. Marder, D. McCord-Maughon, J. W. Perry, H. Röckel, M. Rumi, G. Subramaniam, W. W. Webb, X.-L. Wu and C. Xu, Science, 1998, 281, 1653 CrossRef CAS PubMed.
- M. Pawlicki, H. A. Collins, R. G. Denning and H. L. Anderson, Angew. Chem., Int. Ed., 2009, 48, 3244–3266 CrossRef CAS PubMed.
- Q. Zhang, X. Tian, H. Zhou, J. Wu and Y. Tian, Materials, 2017, 10, 223 CrossRef.
- M. Barzoukas and M. Blanchard-Desce, J. Chem. Phys., 2000, 113, 3951–3959 CrossRef CAS.
- P. Norman, Y. Luo and H. Ågren, J. Chem. Phys., 1999, 111, 7758–7765 CrossRef CAS.
- T.-C. Lin, G. S. He, P. N. Prasad and L.-S. Tan, J. Mater. Chem., 2004, 14, 982–991 RSC.
- K. D. Belfield, D. J. Hagan, E. W. Van Stryland, K. J. Schafer and R. A. Negres, Org. Lett., 1999, 1, 1575–1578 CrossRef CAS.
- L. Porrès, O. Mongin, C. Katan, M. Charlot, T. Pons, J. Mertz and M. Blanchard-Desce, Org. Lett., 2004, 6, 47–50 CrossRef PubMed.
- H. J. Lee, J. Sohn, J. Hwang, S. Y. Park, H. Choi and M. Cha, Chem. Mater., 2004, 16, 456–465 CrossRef CAS.
- C. Le Droumaguet, O. Mongin, M. H. V. Werts and M. Blanchard-Desce, Chem. Commun., 2005, 2802–2804 RSC.
- B. S. Furniss, A. J. Hannaford, V. Rogers, P. W. G. Smith and A. R. Tatchell, Vogel's Textbook of Practical Organic Chemistry, 1978 Search PubMed.
- E. Collini, Phys. Chem. Chem. Phys., 2012, 14, 3725–3736 RSC.
- E. Collini, C. Ferrante and R. Bozio, J. Phys. Chem. B, 2005, 109, 2–5 CrossRef CAS PubMed.
- E. Collini, C. Ferrante, R. Bozio, A. Lodi and G. Ponterini, J. Mater. Chem., 2006, 16, 1573–1578 RSC.
- P. Hanczyc, M. Samoc and B. Norden, Nat. Photonics, 2013, 7, 969–972 CrossRef CAS.
- B. Lee, H. Kwon, S. Kim and F. Rotermund, Opt. Mater. Express, 2016, 6, 993–1002 CrossRef CAS.
- S. B. Noh, R. H. Kim, W. J. Kim, S. Kim, K.-S. Lee, N. S. Cho, H.-K. Shim, H. E. Pudavar and P. N. Prasad, J. Mater. Chem., 2010, 20, 7422–7429 RSC.
- S. Kim, Q. Zheng, G. S. He, D. J. Bharali, H. E. Pudavar, A. Baev and P. N. Prasad, Adv. Funct. Mater., 2006, 16, 2317–2323 CrossRef CAS.
- J. Szeremeta, R. Kolkowski, M. Nyk and M. Samoc, J. Phys. Chem. C, 2013, 117, 26197–26203 CAS.
- M. Sheik-Bahae, A. A. Said, T. H. Wei, D. J. Hagan and E. W. Van Stryland, IEEE J. Quantum Electron., 1990, 26, 760–769 CrossRef CAS.
- M. Nyk, J. Szeremeta, D. Wawrzyńczyk and M. Samoć, J. Phys. Chem. C, 2014, 118, 17914–17921 CAS.
- G. S. He, J. Swiatkiewicz, Y. Jiang, P. N. Prasad, B. A. Reinhardt, L.-S. Tan and R. Kannan, J. Phys. Chem. A, 2000, 104, 4805–4810 CrossRef CAS.
- J. Swiatkiewicz, P. N. Prasad and B. A. Reinhardt, Opt. Commun., 1998, 157, 135–138 CrossRef CAS.
- C. Xu and W. W. Webb, J. Opt. Soc. Am. B, 1996, 13, 481–491 CrossRef CAS.
- N. S. Makarov, M. Drobizhev and A. Rebane, Opt. Express, 2008, 16, 4029–4047 CrossRef CAS PubMed.
- M. Balu, L. A. Padilha, D. J. Hagan, E. W. Van Stryland, S. Yao, K. Belfield, S. Zheng, S. Barlow and S. Marder, J. Opt. Soc. Am. B, 2008, 25, 159–165 CrossRef CAS.
- R. L. Roberts, T. Schwich, T. C. Corkery, M. P. Cifuentes, K. A. Green, J. D. Farmer, P. J. Low, T. B. Marder, M. Samoć and M. C. Humphrey, Adv. Mater., 2009, 21, 2318–2322 CrossRef CAS.
- T. Schwich, M. P. Cifuentes, P. A. Gugger, M. Samoć and M. G. Humphrey, Adv. Mater., 2011, 23, 1433–1435 CrossRef CAS.
- J. Pérez-Moreno and M. G. Kuzyk, Adv. Mater., 2011, 23, 1428–1432 CrossRef PubMed.
- M. Samoć, K. Matczyszyn, M. Nyk, J. Olesiak-Bańska, D. Wawrzyńczyk, P. Hańczyc, J. Szeremeta, M. Wielgus, M. Gordel, L. Mazur, R. Kołkowski, B. Straszak, M. P. Cifuentes and M. G. Humphrey, Proc. SPIE, 2012, 8258 Search PubMed.
- M. Zhao, J. Tan, J. Su, J. Zhang, S. Zhang, J. Wu and Y. Tian, Dyes Pigm., 2016, 130, 216–225 CrossRef CAS.
- R.-Q. Liu, N. Zhao, F.-X. Yang, A.-R. Wang, P. Liu, C.-X. An and Z.-X. Lian, Polyhedron, 2016, 111, 16–25 CrossRef CAS.
- N. Zhao, Y.-E. Deng, P. Liu, C.-X. An, T.-X. Wang and Z.-X. Lian, Polyhedron, 2015, 85, 607–614 CrossRef CAS.
- Q. Liu, X. Zhao, F. Zhou, Y.-L. Song, W.-H. Zhang and J.-P. Lang, Cryst. Growth Des., 2016, 16, 3206–3214 CAS.
- Z. Lian, K. Jiang and T. Lou, RSC Adv., 2015, 5, 82781–82788 RSC.
- N. Zhao, P. Liu, C.-X. An, T.-X. Wang and Z.-X. Lian, Inorg. Chem. Commun., 2014, 50, 97–100 CrossRef CAS.
- P. Liu, Q. Liu, N. Zhao, C. An and Z. Lian, Acta Crystallogr., Sect. C: Struct. Chem., 2016, 72, 890–894 CAS.
- H. Zhao, D. Jia, J. Li, G. J. Moxey and C. Zhang, Inorg. Chim. Acta, 2015, 432, 1–12 CrossRef CAS.
- C. Xu, Z.-Y. Zhang, Z.-G. Ren, L.-K. Zhou, H.-X. Li, H.-F. Wang, Z.-R. Sun and J.-P. Lang, Cryst. Growth Des., 2013, 13, 2530–2539 CAS.
- X. Chen, H.-X. Li, Z.-Y. Zhang, C. Xu, K.-P. Hou, L.-K. Zhou, J.-P. Lang and Z.-R. Sun, CrystEngComm, 2012, 14, 4027–4033 RSC.
- Q. Liu, Z.-G. Ren, L. Deng, W.-H. Zhang, X. Zhao, Z.-R. Sun and J.-P. Lang, Dalton Trans., 2015, 44, 130–137 RSC.
- J. Zhang, S. Meng, Y. Song, Y. Zhou, Y. Cao, J. Li, H. Zhao, J. Hu, J. Wu, M. G. Humphrey and C. Zhang, Cryst. Growth Des., 2011, 11, 100–109 CAS.
- J. Li, S. Meng, J. Zhang, Y. Song, Z. Huang, H. Zhao, H. Wei, W. Huang, M. P. Cifuentes, M. G. Humphrey and C. Zhang, CrystEngComm, 2012, 14, 2787–2796 RSC.
- X. Meng, J. Li, H. Hou, Y. Song, Y. Fan and Y. Zhu, J. Mol. Struct., 2008, 891, 305–311 CrossRef CAS.
- J. P. Zou, G. W. Zhou, X. Zhang, M. S. Wang, Y. B. Lu, W. W. Zhou, Z. J. Zhang, G. C. Guo and J. S. Huang, CrystEngComm, 2009, 11, 972–974 RSC.
- H. Xu, Y. Song, L. Mi, H. Hou, M. Tang, Y. Sang, Y. Fan and Y. Pan, Dalton Trans., 2006, 838–845 RSC.
- H. Han, Y. Song, H. Hou, Y. Fan and Y. Zhu, Dalton Trans., 2006, 1972–1980 RSC.
- X. Meng, Y. Song, H. Hou, Y. Fan, G. Li and Y. Zhu, Inorg. Chem., 2003, 42, 1306–1315 CrossRef CAS PubMed.
- L. Li, B. Chen, Y. Song, G. Li, H. Hou, Y. Fan and L. Mi, Inorg. Chim. Acta, 2003, 344, 95–101 CrossRef CAS.
- H. Hou, Y. Fan, C. Du, Y. Zhu, Y. Song, Y. Niu, X. Xin and Y. Wei, Inorg. Chim. Acta, 2001, 319, 212–218 CrossRef CAS.
- N. Zhao, Y.-E. Deng, P. Liu, C.-X. An, T.-X. Wang and Z.-X. Lian, Transition Met. Chem., 2015, 40, 11–19 CrossRef CAS.
- L.-Y. Xu, H.-X. Chen, X.-J. Sun, P.-Y. Gu, J.-F. Ge, N.-J. Li, Q.-F. Xu and J.-M. Lu, Polyhedron, 2012, 35, 7–14 CrossRef CAS.
- J.-H. Yu, Z.-L. Lu, J.-Q. Xu, H.-Y. Bie, J. Lu and X. Zhang, New J. Chem., 2004, 28, 940–945 RSC.
- H.-Y. Bie, J.-H. Yu, J.-Q. Xu, J. Lu, Y. Li, X.-B. Cui, X. Zhang, Y.-H. Sun and L.-Y. Pan, J. Mol. Struct., 2003, 660, 107–112 CrossRef CAS.
- F.-Q. Liu, R.-X. Li, Y.-Y. Deng, W.-H. Li, N.-X. Ding and G.-Y. Liu, J. Organomet. Chem., 2009, 694, 3653–3659 CrossRef CAS.
- Y. Li, Z.-X. Zhang, P.-Z. Hong, Z.-X. Wua and K.-C. Li, Inorg. Chem. Commun., 2008, 11, 761–764 CrossRef CAS.
- Z.-X. Zhang, Y. Li, K.-C. Li, W.-D. Song and Q.-S. Li, Inorg. Chem. Commun., 2007, 10, 1276–1280 CrossRef CAS.
- L.-J. Zhang, J.-H. Yu, J.-Q. Xu, J. Lu, H.-Y. Bie and X. Zhang, Inorg. Chem. Commun., 2005, 8, 638–642 CrossRef CAS.
- Y. Li, Z.-X. Zhang, K.-C. Li, W.-D. Song and Q.-S. Li, Inorg. Chem. Commun., 2007, 10, 1557–1560 CrossRef CAS.
- G.-W. Zhou, Y.-Z. Lan, F.-K. Zheng, X. Zhang, M.-H. Lin, G.-C. Guo and J.-S. Huang, Chem. Phys. Lett., 2006, 426, 341–344 CrossRef CAS.
- Y. Niu, Z. Li, Y. Song, M. Tang, B. Wu and X. Xin, J. Solid State Chem., 2006, 179, 4003–4010 CrossRef CAS.
- Y. Niu, Y. Song, N. Zhang, H. Hou, D. Che, Y. Fan, Y. Zhu and C. Duan, Eur. J. Inorg. Chem., 2006, 2259–2267 CrossRef CAS.
- J.-L. Zhou, Q.-Y. Chen, Y.-Y. Gu, G.-Q. Mei and H.-W. Yang, Transition Met. Chem., 2005, 30, 1036–1041 CrossRef CAS.
- Y. Niu, Y. Song, H. Hou and Y. Zhu, Inorg. Chem., 2005, 44, 2553–2559 CrossRef CAS PubMed.
- X. Meng, Y. Song, H. Hou, H. Han, B. Xiao, Y. Fan and Y. Zhu, Inorg. Chem., 2004, 43, 3528–3536 CrossRef CAS PubMed.
- Q. Chang, X. Meng, Y. Song and H. Hou, Inorg. Chim. Acta, 2005, 358, 2117–2124 CrossRef CAS.
- B. Xiao, H. Han, X. Meng, Y. Song, Y. Fan, H. Hou and Y. Zhu, Inorg. Chem. Commun., 2004, 7, 378–381 CrossRef CAS.
- J.-H. Yu, J.-Q. Xu, Q.-X. Yang, L.-Y. Pan, T.-G. Wang, C.-H. Lü and T.-H. Ma, J. Mol. Struct., 2003, 658, 1–7 CrossRef CAS.
- H. Hou, Y. Wei, Y. Song, Y. Zhu, L. Li and Y. Fan, J. Mater. Chem., 2002, 12, 838–843 RSC.
- H. Hou, Y. Song, H. Xu, Y. Wei, Y. Fan, Y. Zhu, L. Li and C. Du, Macromolecules, 2003, 36, 999–1008 CrossRef CAS.
- H.-C. Zhou and S. Kitagawa, Chem. Soc. Rev., 2014, 43, 5403–6176 RSC.
- Y. Li, W.-C. Pan, P.-Z. Hong, Z.-X. Zhang and K.-C. Li, J. Coord. Chem., 2014, 67, 2630–2642 CrossRef CAS.
- H. S. Quah, W. Chen, M. K. Schreyer, H. Yang, M. W. Wong, W. Ji and J. J. Vittal, Nat. Commun., 2015, 6, 7954 CrossRef CAS PubMed.
- M. Nakano and B. Champagne, J. Phys. Chem. Lett., 2015, 6, 3236–3256 CrossRef CAS.
- R. Kishi, M. Dennis, K. Fukuda, Y. Murata, K. Morita, H. Uenaka and M. Nakano, J. Phys. Chem. C, 2013, 117, 21498–21508 CAS.
- R. Medishetty, V. Nalla, L. Nemec, S. Henke, D. Mayer, H. Sun, K. Reuter and R. A. Fischer, Adv. Mater., 2017, 29, 1605637 CrossRef PubMed.
- S. Van Cleuvenbergen, I. Stassen, E. Gobechiya, Y. Zhang, K. Markey, D. E. De Vos, C. Kirschhock, B. Champagne, T. Verbiest and M. A. van der Veen, Chem. Mater., 2016, 28, 3203–3209 CrossRef CAS.
- J. K. Zaręba, M. Nyk and M. Samoć, Cryst. Growth Des., 2016, 16, 6419–6425 Search PubMed.
- J. K. Zaręba, J. Szeremeta, M. Waszkielewicz, M. Nyk and M. Samoć, Inorg. Chem., 2016, 55, 9501–9504 CrossRef PubMed.
- W. Denk, J. H. Strickler and W. W. Webb, Science, 1990, 248, 73–76 CAS.
- J. H. Strickler and W. W. Webb, Proc. SPIE, 1990, 1398, 107–118 CrossRef.
- E. S. Wu, J. H. Strickler, W. R. Harrell and W. W. Webb, Proc. SPIE, 1992, 1674, 776–782 CrossRef CAS.
- S. Maruo, O. Nakamura and S. Kawata, Opt. Lett., 1997, 22, 132–134 CrossRef CAS PubMed.
- J. H. Strickler and W. W. Webb, Opt. Lett., 1991, 16, 1780–1782 CrossRef CAS PubMed.
- B. H. Cumpston, S. P. Ananthavel, S. Barlow, D. L. Dyer, J. E. Ehrlich, L. L. Erskine, A. A. Heikal, S. M. Kuebler, I. Y. S. Lee, D. McCord-Maughon, J. Qin, H. Rockel, M. Rumi, X.-L. Wu, S. R. Marder and J. W. Perry, Nature, 1999, 398, 51–54 CrossRef CAS.
- D. A. Parthenopoulos and P. M. Rentzepis, Science, 1989, 245, 843–845 CAS.
- J. Yu, Y. Cui, C.-D. Wu, Y. Yang, B. Chen and G. Qian, J. Am. Chem. Soc., 2015, 137, 4026–4029 CrossRef CAS PubMed.
- R. Ameloot, M. B. J. Roeffaers, G. De Cremer, F. Vermoortele, J. Hofkens, B. F. Sels and D. E. De Vos, Adv. Mater., 2011, 23, 1788–1791 CrossRef CAS PubMed.
- S. Bordiga, C. Lamberti, G. Ricchiardi, L. Regli, F. Bonino, A. Damin, K. P. Lillerud, M. Bjorgen and A. Zecchina, Chem. Commun., 2004, 2300–2301 RSC.
- H. R. Moon, D.-W. Lim and M. P. Suh, Chem. Soc. Rev., 2013, 42, 1807–1824 RSC.
- M. Meilikhov, K. Yusenko, D. Esken, S. Turner, G. Van Tendeloo and R. A. Fischer, Eur. J. Inorg. Chem., 2010, 3701–3714 CrossRef CAS.
- S. M. Shin, M. S. Lee, J. H. Han and N. Jeong, Chem. Commun., 2014, 50, 289–291 RSC.
- O. R. Evans and W. Lin, Chem. Mater., 2001, 13, 2705–2712 CrossRef CAS.
- O. R. Evans and W. Lin, Chem. Mater., 2001, 13, 3009–3017 CrossRef CAS.
- O. R. Evans, R. G. Xiong, Z. Wang, G. K. Wong and W. Lin, Angew. Chem., Int. Ed., 1999, 38, 536–538 CrossRef CAS.
- J. Yu, Y. Cui, C. Wu, Y. Yang, Z. Wang, M. O'Keeffe, B. Chen and G. Qian, Angew. Chem., Int. Ed., 2012, 51, 10542–10545 CrossRef CAS PubMed.
- Y.-H. Han, Y.-C. Liu, X.-S. Xing, C.-B. Tian, P. Lin and S.-W. Du, Chem. Commun., 2015, 51, 14481–14484 RSC.
- J. K. Zaręba, M. J. Białek, J. Janczak, M. Nyk, J. Zoń and M. Samoć, Inorg. Chem., 2015, 54, 10568–10575 CrossRef PubMed.
- M. Liu, H. S. Quah, S. Wen, Z. Yu, J. J. Vittal and W. Ji, Chem. Mater., 2016, 28, 3385–3390 CrossRef CAS.
- M. Liu, H. S. Quah, S. Wen, J. Wang, P. S. Kumar, G. Eda, J. J. Vittal and W. Ji, J. Mater. Chem. C, 2017, 5, 2936–2941 RSC.
- A. Monguzzi, R. Tubino, S. Hoseinkhani, M. Campione and F. Meinardi, Phys. Chem. Chem. Phys., 2012, 14, 4322–4332 RSC.
- I. Aharonovich, A. Woolf, K. J. Russell, T. Zhu, N. Niu, M. J. Kappers, R. A. Oliver and E. L. Hu, Appl. Phys. Lett., 2013, 103, 021112 CrossRef.
- T. N. Singh-Rachford and F. N. Castellano, Coord. Chem. Rev., 2010, 254, 2560–2573 CrossRef CAS.
- T. F. Schulze and T. W. Schmidt, Energy Environ. Sci., 2015, 8, 103–125 CAS.
- S. Baluschev, T. Miteva, V. Yakutkin, G. Nelles, A. Yasuda and G. Wegner, Phys. Rev. Lett., 2006, 97, 143903 CrossRef CAS PubMed.
- J. Zhou, Q. Liu, W. Feng, Y. Sun and F. Li, Chem. Rev., 2015, 115, 395–465 CrossRef CAS PubMed.
- K. Tanaka, K. Inafuku and Y. Chujo, Chem. Commun., 2010, 46, 4378–4380 RSC.
- X. Cao, B. Hu and P. Zhang, J. Phys. Chem. Lett., 2013, 4, 2334–2338 CrossRef CAS.
- N. Yanai and N. Kimizuka, Chem. Commun., 2016, 52, 5354–5370 RSC.
- V. Gray, D. Dzebo, M. Abrahamsson, B. Albinsson and K. Moth-Poulsen, Phys. Chem. Chem. Phys., 2014, 16, 10345–10352 RSC.
- Y. C. Simon and C. Weder, J. Mater. Chem., 2012, 22, 20817–20830 RSC.
- P. Mahato, N. Yanai, M. Sindoro, S. Granick and N. Kimizuka, J. Am. Chem. Soc., 2016, 138, 6541–6549 CrossRef CAS PubMed.
- N. Kimizuka, N. Yanai and M. Morikawa, Langmuir, 2016, 32, 12304–12322 CrossRef CAS PubMed.
- P. Mahato, A. Monguzzi, N. Yanai, T. Yamada and N. Kimizuka, Nat. Mater., 2015, 14, 924–930 CrossRef CAS PubMed.
- N. Kimizuka and T. Kunitake, J. Am. Chem. Soc., 1989, 111, 3758–3759 CrossRef CAS.
- M. Morikawa, M. Yoshihara, T. Endo and N. Kimizuka, J. Am. Chem. Soc., 2005, 127, 1358–1359 CrossRef CAS PubMed.
- T. Nakashima and N. Kimizuka, Adv. Mater., 2002, 14, 1113–1116 CrossRef CAS.
- T. Shiraki, M. Morikawa and N. Kimizuka, Angew. Chem., Int. Ed., 2008, 47, 106–108 CrossRef CAS PubMed.
- I. M. Hauptvogel, R. Biedermann, N. Klein, I. Senkovska, A. Cadiau, D. Wallacher, R. Feyerherm and S. Kaskel, Inorg. Chem., 2011, 50, 8367–8374 CrossRef CAS PubMed.
- M. H. Alkordi, Y. Liu, R. W. Larsen, J. F. Eubank and M. Eddaoudi, J. Am. Chem. Soc., 2008, 130, 12639–12641 CrossRef CAS PubMed.
- J. Juan-Alcaniz, J. Gascon and F. Kapteijn, J. Mater. Chem., 2012, 22, 10102–10118 RSC.
- M. A. Noginov, N. E. Noginova, H. J. Caulfield, P. Venkateswarlu, T. Thompson, M. Mahdi and V. Ostroumov, J. Opt. Soc. Am. B, 1996, 13, 2024–2033 CrossRef CAS.
- A. Bonnot, P.-L. Karsenti, F. Juvenal, C. Golz, C. Strohmann, D. Fortin, M. Knorr and P. D. Harvey, Phys. Chem. Chem. Phys., 2016, 18, 24845–24849 RSC.
- M. Oldenburg, A. Turshatov, D. Busko, S. Wollgarten, M. Adams, N. Baroni, A. Welle, E. Redel, C. Woell, B. S. Richards and I. A. Howard, Adv. Mater., 2016, 28, 8477–8482 CrossRef CAS PubMed.
- V. Stavila, J. Volponi, A. M. Katzenmeyer, M. C. Dixon and M. D. Allendorf, Chem. Sci., 2012, 3, 1531–1540 RSC.
- H. K. Arslan, O. Shekhah, J. Wohlgemuth, M. Franzreb, R. A. Fischer and C. Woell, Adv. Funct. Mater., 2011, 21, 4228–4231 CrossRef CAS.
- J. Liu, W. Zhou, J. Liu, I. Howard, G. Kilibarda, S. Schlabach, D. Coupry, M. Addicoat, S. Yoneda, Y. Tsutsui, T. Sakurai, S. Seki, Z. Wang, P. Lindemann, E. Redel, T. Heine and C. Woell, Angew. Chem., Int. Ed., 2015, 54, 7441–7445 CrossRef CAS PubMed.
- B. Liu, O. Shekhah, H. K. Arslan, J. Liu, C. Woell and R. A. Fischer, Angew. Chem., Int. Ed., 2012, 51, 807–810 CrossRef CAS PubMed.
- H. Dong, C. Zhang and Y. S. Zhao, J. Mater. Chem. C, 2017 10.1039/C6TC05474A.
- J. Yu, Y. Cui, H. Xu, Y. Yang, Z. Wang, B. Chen and G. Qian, Nat. Commun., 2013, 4, 2719 Search PubMed.
- H. He, E. Ma, Y. Cui, J. Yu, Y. Yang, T. Song, C.-D. Wu, X. Chen, B. Chen and G. Qian, Nat. Commun., 2016, 7, 11087 CrossRef CAS PubMed.
- Y. Wei, H. Dong, C. Wei, W. Zhang, Y. Yan and Y. S. Zhao, Adv. Mater., 2016, 7424–7429 CrossRef CAS PubMed.
- M. T. Hill and M. C. Gather, Nat. Photonics, 2014, 8, 908–918 CrossRef CAS.
- W. Koechner and M. Bass, Solid-State Lasers: A Graduate Text, Springer, New York, 2003 Search PubMed.
- D. S. Wiersma, Nat. Photonics, 2013, 7, 188–196 CrossRef CAS.
- R. Chen, T. Van Duong and H. D. Sun, Sci. Rep., 2012, 2, 244 Search PubMed.
- H. He, E. Ma, J. Yu, Y. Cui, Y. Lin, Y. Yang, X. Chen, B. Chen and G. Qian, Adv. Opt. Mater., 2017, 5, 1601040 CrossRef.
Footnote |
| † These authors contributed equally. |
| This journal is © The Royal Society of Chemistry 2017 |

