Hydrothermal disruption of algae cells for astaxanthin extraction†
Xiang
Cheng
,
Jason
Riordon
,
Brian
Nguyen
,
Matthew D.
Ooms
and
David
Sinton
*
Department of Mechanical and Industrial Engineering, and Institute of Sustainable Energy, University of Toronto, 5 King's College Road, Toronto, Ontario, Canada M5S 3G8. E-mail: sinton@mie.utoronto.ca
First published on 1st December 2016
Abstract
We demonstrate a hydrothermal method of astaxanthin extraction from wet biomass using a high temperature and high pressure microfluidic platform. Haematococcus pluvialis cysts are trapped within the device and visualized in situ during the cell wall disruption and astaxanthin extraction processes. The device provides a highly controlled environment and enables direct comparison of chemical vs. hydrothermal processes at the cellular level. Hydrothermal disruption at a temperature of 200 °C was shown to be highly effective, resulting in near-complete astaxanthin extraction from wet biomass – a significant improvement over traditional methods.
Astaxanthin is a highly valuable microalgal bioproduct with uses ranging from human health to aquaculture. While synthetic production is currently favoured in industry due to lower production costs, natural astaxanthin is considered more beneficial than synthetic astaxanthin due to its superior antioxidant activity.1–3 The microalgae Haematococcus pluvialis is by far the richest natural source of astaxanthin4 and has become the primary source for the nutraceutical industry.5 However, extraction of astaxanthin remains a challenge; the stress conditions that induce astaxanthin accumulation in H. pluvialis cells also induce cell wall thickening. This barrier is extremely robust to chemical and physical disruption,6 making astaxanthin extraction difficult, particularly for mature cysts which are larger and have thicker cell walls compared to cells at other life-cycle stages. Effective cell wall disruption increases the effectiveness of post-disruption recovery approaches, which include organic solvents,7 ionic liquids,8,9 and supercritical CO2.10,11 Chemical disruption using acids or bases typically results in low (<40%) extraction efficiencies.7 Mechanical disruption is therefore the primary method used in industry, but requires dry biomass.5 Biomass drying in combination with mechanical disruption enhances the extraction efficiency (>80%) but also significantly increases the energy and financial costs of processing.12,13
Hydrothermal processes – where wet biomass is subject to high pressures (5–20 MPa) and temperatures (150–350 °C) – have shown promise for several applications, including pressurized hot water extraction of bioactives,14,15 woody biomass decomposition16 and biocrude formation.17–20 Hydrothermal processes leverage the physiochemical characteristics of water at elevated temperature and pressure, including: (i) a significantly higher fraction of water ions which aids acid or base-catalysed reactions to break cell walls; (ii) a lower dielectric constant, which enhances the hydrothermal conversion of carbohydrate biomass;21 and (iii) energy savings by avoiding the need for water evaporation.22 Importantly, hydrothermal disruption represents an environmentally friendly approach, in sharp contrast to traditional chemical methods.23 However, despite the strong potential of hydrothermal processes for cell wall-disruption, such an approach has not been applied to astaxanthin extraction.
Current approaches to studying cell disruption and extraction processes of this nature generally involve relatively large opaque batch reactors.7,24 Significant chemical and thermal gradients are inherent in such reactors given their size, and pressure vessel requirements generally preclude direct observation of the process.25–27 Operating at smaller length scales, as with silicon-glass microfluidic reactors, can minimize gradients, improve control, and provide access to high temperatures and pressures, all while allowing direct optical access to the process.28,29 While such microfluidic systems are themselves impractical for the production of bulk product, they are ideally suited to screening conditions and quantifying unit process efficiencies – valuable information for commercial-scale processing.
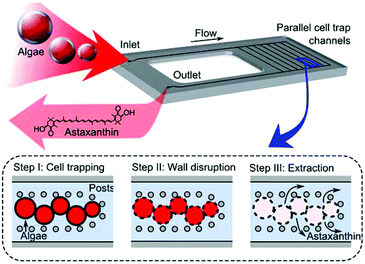
In this work, we demonstrate a hydrothermal approach to cell wall disruption for astaxanthin extraction from wet biomass, where extraction is visualized on a microfluidic screening platform. Extraction was performed using a microfluidic device to provide real-time visualization of the disruption and extraction processes. The glass/silicon microfluidic chip was designed to allow optical access, while providing uniform heating and both chemical and thermal resiliency. The device features parallel reaction channels with trapping posts, where H. pluvialis cysts are trapped and monitored during wall disruption and astaxanthin extraction (Fig. 1). Direct visualization of the process enables quantitative comparison of chemical and hydrothermal methods at the cell level. It was found that biomass treated hydrothermally, at a temperature of 200 °C and a pressure of 6 MPa, demonstrated near-complete astaxanthin extraction efficiency – a significant improvement over traditional approaches.
Device design and fabrication
The silicon-glass microfluidic device featured 40 parallel reaction channels, each 200 μm wide and 100 μm tall. Each of these channels was lined with cylindrical posts of 20 μm diameter separated by a distance of 40 μm. These posts served to trap cells while allowing fluid flow. The device was fabricated by deep reactive ion etching (DRIE) of the silicon, with subsequent bonding to borosilicate glass of 1.75 mm thickness. The full fabrication procedure for devices of this type is reported elsewhere.28Cell culture and trapping
Haematococcus pluvialis cultures were obtained from Algae Analytics (Las Cruces, New Mexico) and cultured at 25 °C under continuous white light illumination at ∼30 μmol m−2 s−1 in media according to the recipe of Fábregas et al.30 Encystment was induced by exposure to red and blue light at ∼60 μmol m−2 s−1 until the cultures developed red coloration indicative of astaxanthin accumulation (irradiation spectrum shown in Fig. S2†). For each experiment, a suspension of H. pluvialis cysts in media was injected into the chip using a pump and trapped in the post arrays (a video of initial cell trapping is presented in ESI – Video S1†). Cysts with thickened cell walls were selected by using a 70 μm cell strainer. After the cells were loaded, deionised water was flowed into the chip at a rate of 1 mL min−1 for 5 min to flush the media prior to cell disruption. During cell loading, and at all stages of astaxanthin recovery, the cells were observed using darkfield microscopy (Olympus BXFM microscope, 10× objective).Cell wall disruption and extraction
The cell wall disruption method was varied to test both chemical treatments (HCl, NaOH) and hydrothermal treatments (30 min @ 150 °C, 30 min @ 200 °C, 10 min @ 200 °C and 5 min @ 200 °C), and compared to a control case (no treatment). For chemical disruption, solutions were pumped into the device at a flow rate of 1 mL min−1 for 1 min to rapidly fill the volume of the chip before stopping the flow for 30 min. The hydrothermal processes were performed at a pressure of 6 MPa, chosen to be sufficiently high to maintain water at liquid phase at the selected temperatures. The device was then heated to the desired temperature at a heating rate of ∼60 °C min−1 using a custom heating chuck and maintained at the set temperature for 5–30 min by a PID temperature controller. Once the hydrothermal treatment was completed, the heating chuck was removed to allow the device to cool to room temperature.The temperature of 200 °C was chosen to correspond to the approximate temperature where structural cell wall polysaccharides rapidly depolymerize without degradation of other biomass as a result of secondary reactions.31,32 After cell wall disruption, acetone was flowed at a rate of 1 mL min−1 for 1 min, before being reduced to a constant rate of 100 μL min−1 for another 20 min to fully purge the microchannels. The solvent extraction process was identical in all cases.
Quantifying astaxanthin content
To compare the efficiency of astaxanthin extraction methods, the change in coloration of individual H. pluvialis cells was quantified by image processing for all cases. An equation was devised which converts the 8-bit RGB values measured for each pixel within the area of a cell, into a coloration-based global “extracted red content” metric, indicative of the relative astaxanthin concentration: | (1) |
HPLC analysis of extracted astaxanthin
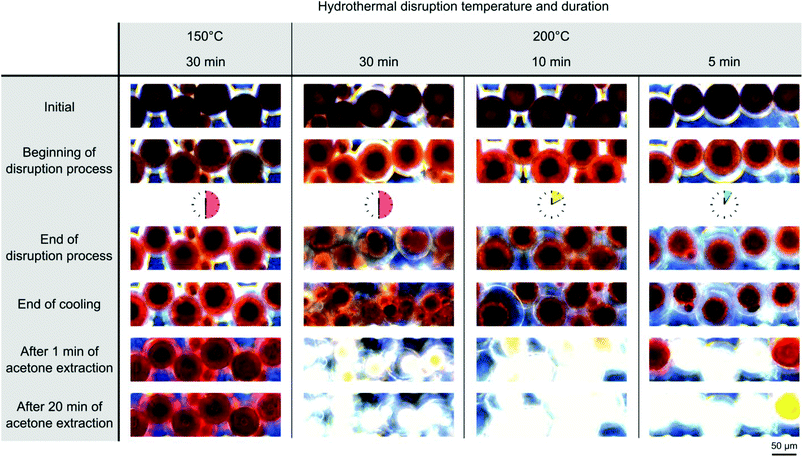
The acetone extracts from the hydrothermally treated (200 °C for 10 min) cells and mechanically disrupted cells (by mortar and pestle) were analysed using a high-performance liquid chromatograph (HPLC) (Shimadzu SPD-10A) equipped with a reversed phase C18 (Supelco, 25 cm × 4.6 mm) column. The detection wavelength was set to 475 nm and the analysis protocol was identical to previous research.33Initial and post-extraction cell images are presented for each wall disruption method in Fig. 2a, enabling direct comparison of different wall disruption methods. Each post-extraction image was taken immediately after acetone extraction. Fig. 2b shows normalized extracted red content, as obtained with eqn (1). Notably, hydrothermal disruption methods demonstrated the largest change in coloration, with cells transitioning from a dark red hue to bright red (at 150 °C) or white (200 °C), indicative of near-complete astaxanthin extraction (>95% red content reduction for the 200 °C cases). Shorter duration tests at 200 °C indicate that the disruption process is rapid at this temperature and insensitive to duration. A hydrothermal disruption temperature of 200 °C was sufficient to quickly decompose the cell wall in a span of a few minutes, which is in agreement with previous research.31 Cells that were not subjected to any wall disruption treatment (control case) show very little coloration change (7.5% red content reduction). The exchange of media from deionized water to acetone causes water to exit via the water-permeable cell wall, resulting in a 34% reduction in cell area. That cells retain their circular shape is indicative that the cell wall and plasmalemma were not significantly compromised during acetone exposure. As the cell wall contracts, however, light scattering at the cell wall – responsible for the white halos seen in the initial images – is greatly reduced, with only light blue outlines remaining. This change is attributed to water loss within the cell, and the related contraction of the plasmalemma and outer cell wall (disappearance of inner bright ring, corresponding to the plasmalemma, confirmed by brightfield imaging, ESI†). The extraction efficiencies for acid and base treatments were higher than the control, achieving 19.3% and 13.2% recovery, respectively. Cell size reduction was similar to the control case (36%, 34%). During the HCl disruption process, astaxanthin bleeding was observed in one of the cells, indicting minor cell wall disruption in isolated cases. For the NaOH disruption process, no discernible structural changes other than size reduction occurred. The relative extraction efficiencies achieved are slightly improved and shows similar improvement (control, 20%; acid treatment, 35%; and base treatment 40%) to those published previously in bulk reactors with longer extraction time.7 Collectively, these result demonstrate that short duration treatment at 200 °C is very effective for subsequent astaxanthin extraction, in sharp contrast to traditional acid and base disruption methods.
Fig. 3 shows detailed time-course images of cells during the full extraction protocol, for each of the four hydrothermal cell wall disruption recipes (detailed intermediate steps in the processes of Fig. 2). As shown, a treatment temperature of 150 °C was sufficient to disrupt the plasmalemma, but it was insufficient to disrupt the cell wall. In the 150 °C case run for 30 min, the cells darkened during heating followed by continuous fading of the outer regions (between the “initial” and “beginning of the disruption process” images). After a return to room temperature, a 5 μm layer of interspace between the plasmalemma and cell wall was observed. A video of acetone extraction is presented in ESI – Video S2.†
Fig. 3 also shows the high efficiency of hydrothermal astaxanthin recovery at 200 °C, for all tested disruption times – with slight improvements at longer times. For the 30 min at 200 °C case, initial fading around the cell periphery was observed during heating (as observed in the 30 min at 150 °C case). However, rapid growth of the interspace and significant astaxanthin bleeding occurred 1 min into the disruption process (Fig. 3), indicating disruption of both the plasmalemma and the cell wall. Rapid cell wall disruption within 1 min of treatment is also supported by our study of the role of flow rate, presented in ESI – Fig. S5.† During the 200 °C disruption, the polysaccharide wall is expected to slowly depolymerise into furan compounds,36 however, no discernible color change was observed on the cell wall, and furan-based RGB value modifications are considered negligible. Astaxanthin flow from the cell to the channel was observed 20 min into the disruption process. The majority of the pigmentation change occurred 1 min into acetone extraction, indicating high cell permeability, in contrast to that observed for other cell disruption conditions. After 20 min of solvent extraction the cells showed virtually no pigmentation indicating near complete astaxanthin recovery. The other tested times for the 200 °C case (10 min, 5 min) produced similar results, with the 5 min case showing a pigmentation change during extraction that was less complete. These observations, which were made possible through the direct visualization enabled by our microfluidic platform, have implications for the optimum processing parameters of cell wall disruption techniques in larger commercial systems. These findings indicate an optimal disruption duration between 5 and 10 min to both maximize the extraction efficiency, and minimize the amount of time and energy required for processing.
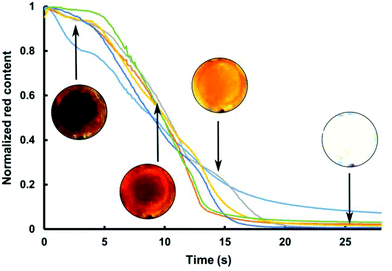
The first 25 s of the extraction profile for six individual cells disrupted for 10 min at 200 °C is shown in Fig. 4. The plot demonstrates the speed at which cell respond to acetone extraction after hydrothermal treatment. Six cells were tracked to monitor the astaxanthin content which was normalized to the post-treatment conditions of each cell. The first 25 seconds of solvent extraction show a rapid decrease in astaxanthin (>90%) in each cell (a video showing rapid extraction is presented in ESI – Video S3†).
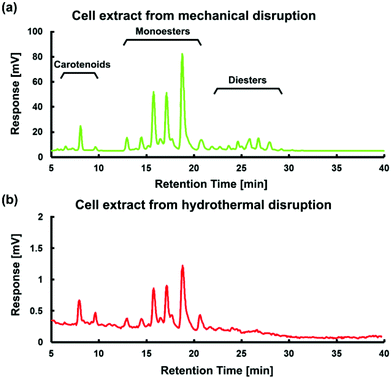
The HPLC analysis in Fig. 5 demonstrates that the extracted red content for the case of 200 °C for 10 min is similar in profile to that of cells mechanically disrupted using a mortar and pestle – and correspond to expected astaxanthin HPLC peaks. Such a similarity demonstrates the effectiveness of rapid hydrothermal treatment as an attractive alternative to mechanical disruption methods. There are, however, two notable differences between the spectra. First, diester peaks are clearly identifiable in the mechanical extraction case, but not in the hydrothermal case. Such a difference could be due to a portion of diesters being hydrolyzed into monoesters and further converted to free form astaxanthin. Second, the magnitude of peaks overall is much lower in the hydrothermal on-chip case due to a level of dilution (a few nanograms of astaxanthin dissolved in 1 mL of acetone), and is only an artefact of the visualization method here – trapping a small number of cells in a flow – and is not a practical limitation of high temperature hydrothermal disruption at larger scales. Notably, the presence of monoester and carotenoid HPLC peaks suggests the high temperature, high pressure hydrothermal process did not have a significant adverse effect on astaxanthin in general, perhaps due to the presence of largely intact rigid cell walls, which have been shown to protect astaxanthin from thermal degradation at higher temperatures (e.g. spray drying at 220 °C).37 The absence of oxidising agents within the cells, and inability for external oxygenating species to enter the reactor, led to effective astaxanthin extraction.
 | ||
| Fig. 5 HPLC analysis of cell extract products for (a) mechanical extraction using a mortar and pestle and (b) hydrothermal extraction for 10 min at 200 °C treatment. | ||
Whereas the presence of strong astaxanthin HPLC peaks in Fig. 5b demonstrates the effectiveness of our hydrothermal disruption method, there remains uncertainty as to any temperature-induced conformational changes, such as trans–cis isomerization of extracted carotenoids. Kaczor and Baranska performed in situ Raman spectroscopy to monitor astaxanthin structural change in a single cell with thermal stress up to 150 °C.38 It was found that astaxanthin experienced only minor conformational change. While more study is required to elucidate astaxanthin structural changes under high pressure and high temperature conditions, strong HPLC peaks here demonstrate the potential of the hydrothermal extraction method.
There is potential to adapt the hydrothermal astaxanthin extraction method presented herein for commercial-scale reactors. To achieve industrial-scale hydrothermal astaxanthin recovery, the results of our chip-scale experiments suggest three criteria that must be met: (i) an inert environment is required to prevent astaxanthin oxidation, (ii) temperature, pressure and residence time must be precisely controlled, and (iii) low shear conditions must be satisfied to prevent cell wall rupture and subsequent astaxanthin degradation (as observed in ESI Fig. S5† in flow experiments). Such a combination of criteria could be met by with a continuous flow-through reactor approach, similar in principle to the experiments performed herein, albeit with macroscale reactor tubes in parallel. In short, while the chip allows unprecedented cell-scale resolution of the process, the reaction conditions achieved here are in no way unique to the chip-based reactor. The observations here can be readily applied to engineer scaled processes, with careful engineering to ensure similar conditions and residence times.
Conclusions
In summary, we have demonstrated a hydrothermal method of cell wall disruption for astaxanthin extraction uniquely enabled by a high-pressure, high-temperature microfluidic device. Individual H. pluvialis cells were trapped and visualized throughout one of several procedures, both chemical and hydrothermal, and extracted red content was quantified optically. Hydrothermal disruption at 200 °C was the most effective wall disruption technique, enabling near complete astaxanthin extraction from wet biomass, a significant improvement over traditional methods.Acknowledgements
This work was supported through a Strategic Grant from the Natural Science and Engineering Research Council of Canada, the University of Toronto McLean Fellowship (DS), ongoing operational funding from Discovery and Discovery Accelerator grants, a Canada Research Chair (DS), the Vanier Canada Graduate Scholarship (MO), and Queen Elizabeth II Graduate Scholarship (BN). Fabrication was performed at the Toronto Nanofabrication Centre and the Centre for Microfluidic Systems in Chemistry and Biology at the University of Toronto. Ongoing infrastructure support from the Canadian Foundation for Innovation and Ontario Research Fund is also gratefully acknowledged.Notes and references
- R. T. Lorenz and G. R. Cysewski, Trends Biotechnol., 2000, 18, 160–167 CrossRef CAS PubMed.
- P. Kidd, Altern. Med. Rev., 2011, 16, 355–364 Search PubMed.
- J. Ruiz, G. Olivieri, J. de Vree, R. Bosma, P. Willems, J. H. Reith, M. H. M. Eppink, D. M. M. Kleinegris, R. H. Wijffels and M. J. Barbosa, Energy Environ. Sci., 2016, 9, 3036–3043 Search PubMed.
- P. Z. Margalith, Appl. Microbiol. Biotechnol., 1999, 51, 431–438 CrossRef CAS PubMed.
- M. M. R. Shah, Y. Liang, J. J. Cheng and M. Daroch, Front. Plant Sci., 2016, 7, 531 Search PubMed.
- D.-Y. Kim, D. Vijayan, R. Praveenkumar, J.-I. Han, K. Lee, J.-Y. Park, W.-S. Chang, J.-S. Lee and Y.-K. Oh, Bioresour. Technol., 2016, 199, 300–310 CrossRef CAS PubMed.
- M. M. Mendes-Pinto, M. F. J. Raposo, J. Bowen, A. J. Young and R. Morais, J. Appl. Phycol., 2001, 13, 19–24 CrossRef.
- R. Praveenkumar, K. Lee, J. Lee and Y.-K. Oh, Green Chem., 2015, 17, 1226–1234 RSC.
- R. K. Desai, M. Streefland, R. H. Wijffels and M. H. M. Eppink, Green Chem., 2016, 18, 1261–1267 RSC.
- A. Paudel, M. J. Jessop, S. H. Stubbins, P. Champagne and P. G. Jessop, Bioresour. Technol., 2015, 184, 286–290 CrossRef CAS PubMed.
- L. Soh and J. Zimmerman, Green Chem., 2011, 13, 1422 RSC.
- G. Panis and J. R. Carreon, Algal Res., 2016, 18, 175–190 CrossRef.
- E. Günerken, E. D'Hondt, M. H. M. Eppink, L. Garcia-Gonzalez, K. Elst and R. H. Wijffels, Biotechnol. Adv., 2015, 33, 243–260 CrossRef PubMed.
- C. C. Teo, S. N. Tan, J. W. H. Yong, C. S. Hew and E. S. Ong, J. Chromatogr., A, 2010, 1217, 2484–2494 CrossRef CAS PubMed.
- M. Plaza and C. Turner, TrAC, Trends Anal. Chem., 2015, 71, 39–54 CrossRef CAS.
- L. Nazari, Z. Yuan, S. Souzanchi, M. B. Ray and C. (Charles) Xu, Fuel, 2015, 162, 74–83 CrossRef CAS.
- S. Leow, J. R. Witter, D. R. Vardon, B. K. Sharma, J. S. Guest and T. J. Strathmann, Green Chem., 2015, 17, 3584–3599 RSC.
- D. C. Hietala and P. E. Savage, Chem. Eng. J., 2015, 265, 129–137 CrossRef CAS.
- C. Zhang, X. Tang, L. Sheng and X. Yang, Green Chem., 2016, 18, 2542–2553 RSC.
- M. Déniel, G. Haarlemmer, A. Roubaud, E. Weiss-Hortala and J. Fages, Energy Fuels, 2016, 30, 4895–4904 CrossRef.
- F. Jin and H. Enomoto, Energy Environ. Sci., 2011, 4, 382–397 CAS.
- C. Tian, B. Li, Z. Liu, Y. Zhang and H. Lu, Renewable Sustainable Energy Rev., 2014, 38, 933–950 CrossRef CAS.
- P. Anastas and N. Eghbali, Chem. Soc. Rev., 2010, 39, 301–312 RSC.
- X. Yu, J. Yang, H. Lu, S.-T. Tu and J. Yan, Appl. Energy, 2015, 160, 648–655 CrossRef CAS.
- K. S. Elvira, X. C. i Solvas, R. C. R. Wootton and A. J. DeMello, Nat. Chem., 2013, 5, 905–915 CrossRef CAS PubMed.
- V. Hessel, D. Kralisch, N. Kockmann, T. Noël and Q. Wang, ChemSusChem, 2013, 6, 746–789 CrossRef CAS PubMed.
- L. Wang, B. Yang, B. Yan and X. Yao, Innovative Food Sci. Emerging Technol., 2012, 13, 120–127 CrossRef CAS.
- X. Cheng, M. D. Ooms and D. Sinton, Lab Chip, 2016, 16, 256–260 RSC.
- S. Marre, A. Adamo, S. Basak, C. Aymonier and K. F. Jensen, Ind. Eng. Chem. Res., 2010, 49, 11310–11320 CrossRef CAS.
- J. Fábregas, A. Domínguez, M. Regueiro, A. Maseda and A. Otero, Appl. Microbiol. Biotechnol., 2000, 53, 530–535 CrossRef.
- W. S. L. Mok and M. J. Antal, Ind. Eng. Chem. Res., 1992, 31, 1157–1161 CrossRef CAS.
- O. Bobleter, Prog. Polym. Sci., 1994, 19, 797–841 CrossRef CAS.
- R. Sarada, R. Vidhyavathi, D. Usha and G. A. Ravishankar, J. Agric. Food Chem., 2006, 54, 7585–7588 CrossRef CAS PubMed.
- S. Boussiba, W. Bing, J.-P. Yuan, A. Zarka and F. Chen, Biotechnol. Lett., 1999, 21, 601–604 CrossRef CAS.
- R. Ranga, A. R. Sarada, V. Baskaran and G. A. Ravishankar, J. Microbiol. Biotechnol., 2009, 19, 1333–1341 CAS.
- H. Lin, J. Su, Y. Liu and L. Yang, Application of Hydrothermal Reactions to Biomass Conversion, Springer Berlin Heidelberg, Berlin, Heidelberg, 2014 Search PubMed.
- M. F. J. Raposo, A. M. M. B. Morais and R. M. S. C. Morais, World J. Microbiol. Biotechnol., 2012, 28, 1253–1257 CrossRef CAS PubMed.
- A. Kaczor and M. Baranska, Anal. Chem., 2011, 83, 7763–7770 CrossRef CAS PubMed.
Footnote |
| † Electronic supplementary information (ESI) available: Experimental apparatus, irradiation spectrum, hydrothermal disruption images and videos for cell trapping and solvent extraction. See DOI: 10.1039/c6gc02746f |
| This journal is © The Royal Society of Chemistry 2017 |


