Controlled production of sub-millimeter liquid core hydrogel capsules for parallelized 3D cell culture†
Hugo
Doméjean
a,
Mathieu
de la Motte Saint Pierre
a,
Anette
Funfak
a,
Nicolas
Atrux-Tallau
a,
Kevin
Alessandri
bc,
Pierre
Nassoy
bc,
Jérôme
Bibette
a and
Nicolas
Bremond
*a
aLaboratoire Colloïdes et Matériaux Divisés, CNRS, Chemistry Biology & Innovation, ESPCI Paris, PSL Research University, 10 Rue Vauquelin, F-75005 Paris, France. E-mail: nicolas.bremond@espci.fr
bLP2N, Université de Bordeaux, F-33400 Talence, France
cLP2N, UMR 5298, Institut d'Optique & CNRS, F-33400 Talence, France
First published on 9th November 2016
Abstract
Liquid core capsules having a hydrogel membrane are becoming a versatile tool for three-dimensional culture of micro-organisms and mammalian cells. Making sub-millimeter capsules at a high rate, via the breakup of a compound jet in air, opens the way to high-throughput screening applications. However, control of the capsule size monodispersity, especially required for quantitative bioassays, was still lacking. Here, we report how the understanding of the underlying hydrodynamic instabilities that occur during the process can lead to calibrated core–shell bioreactors. The requirements are: i) damping the shear layer instability that develops inside the injector arising from the co-annular flow configuration of liquid phases having contrasting viscoelastic properties; ii) controlling the capillary instability of the compound jet by superposing a harmonic perturbation onto the shell flow; iii) avoiding coalescence of drops during jet fragmentation as well as during drop flight towards the gelling bath; iv) ensuring proper engulfment of the compound drops into the gelling bath for building a closed hydrogel shell. We end up with the creation of numerous identical compartments in which cells are able to form multicellular aggregates, namely spheroids. In addition, we implement an intermediate composite hydrogel layer, composed of alginate and collagen, allowing cell adhesion and thus the formation of epithelia or monolayers of cells.
1 Introduction
The ongoing development of three-dimensional (3D) cell culture techniques enables better replication of in vivo conditions which are needed for recovering the proper cellular function as compared to two-dimensional culture methods.1 The applications of such approaches range from fundamental biological questions2 to tissue engineering3 or drug development and discovery.4 For example, spheroids, i.e. multicellular aggregates formed by aggregation or proliferation using scaffold-free methods,5 have become a popular model in cancer research.6,7 Despite numerous strategies of 3D cell culture, a standardized method that would allow high-throughput screening and easy manipulation of the micro-tissues having controlled and reproducible features is still lacking and is thus a subject of intensive investigations.8The encapsulation of cells in hydrogel-based compartments is a promising way towards this goal.9,10 Indeed, hydrogels offer to the cells a physical barrier against any mechanical stress during manipulation but also against host immune response for in vivo delivery applications.11 In addition, the fabrication methods for such bioreactors rely on the formation of liquid droplets, either by emulsification12 or by atomization,13 which can be often produced on a large scale. However, the entrapment of cells in a polymer matrix inhibits cell–cell interactions which are crucial for stimulating functions of cells forming tissues, like epithelia, or organs. Various strategies have been then developed for creating liquid core capsules where cells can aggregate and form micro-tissues. These include the deposition of polyelectrolyte layers on a gelled core that is further liquified,14–16 diffusion of the gelling agent towards the core of the drop containing the polymers with precise control of the reaction time that sets the shell thickness,17 and finally gelling the outer layer of a compound drop.18 Compound drops are usually obtained by a co-extrusion technique19 where an electric field can be used to further decrease the capsule size.20,21
Another key feature for achieving an efficient bioreactor for 3D cell culture is capsule size homogeneity. When using an atomization step, monodisperse capsules can be realized by controlling compound jet fragmentation by imposing harmonic vibrations.22–24 Calibrated hydrogel compartments can also be obtained by using an emulsification strategy combined with microfluidic techniques.25–30 Core–shell objects can then be produced with three-dimensional co-flow microsystems31,32 or via water–water–oil double emulsions.33
Recently, we proposed a process for making capsules having a thin alginate hydrogel membrane and an aqueous core.34 The method relies on a co-extrusion step in air followed by a sol–gel transition of the shell in a gelling bath and does not require the use of any organic phase, in contrast to emulsification-based strategies. Robust formation of capsules having a thin hydrogel membrane is achieved by precisely controlling the physicochemical properties of liquid interfaces. The capsule size varies from a few millimeters, when compound drops are made in a dripping mode,34 down to a few hundreds of micrometers in a jetting mode.35 As demonstrated for micro-organisms34 and for the formation of mammalian cell aggregates,35 it is a promising tool for cell culture. The major advantages of this process are first the involvement of only biocompatible aqueous solutions, which makes further manipulation that can be carried out with classical pipetting techniques easier. Moreover, the hydrogel shell offers mechanical protection to the cells but also prevents any adhesion between micro-tissues during culture. Finally, its high production rate, of the order of 1 kHz, opens the way to high-throughput applications. However, control of the capsule size monodispersity resulting from the fragmentation of a compound jet, especially required for quantitative bioassays, is still lacking. Indeed, without any control of the compound jet fragmentation, the coefficient of variation of the capsule size is about 25%.35
In this article, we report in detail how the understanding of the underlying hydrodynamic instabilities arising during the process makes the creation of calibrated core–shell bioreactors possible. We demonstrate that it is then possible to create numerous identical compartments where cells are able to grow and form spheroids. In addition, we implement an intermediate composite hydrogel layer, composed of alginate and collagen, allowing cell adhesion and thus the formation of epithelia.
2 Results and discussion
2.1 Working principle of the encapsulation method
The basic principle of the capsule formation implies a co-extrusion step in air, followed by a fragmentation step and finally a gelling step of the resulting compound drops in an aqueous bath. Since all liquid phases are aqueous solutions, mixing should be suppressed. This is achieved by adding surfactants into the outer polymer solution and the gelling bath that favor proper engulfment of the compound drop and thus a homogeneous sol–gel transition of the alginate layer.34 Depending on the flow rates of the different liquid phases, and thus on liquid inertia, drops are formed either in a dripping regime or a jetting one.36 In the dripping regime, since drop formation is the result of a competition between gravity and surface tension, the drop diameter d varies like do1/3 for low liquid flow rates and small outer diameter do of the tube from which the liquids exit.37 Although this process gives rise to perfectly monodisperse drops and thus capsules, it is thus difficult to create sub-millimeter drops. One option to further decrease the drop size is to shear off the pending drops attached to the nozzle with the help of an air co-flow.38 An alternative way is to increase fluid inertia in order to form a jet whose fragmentation under capillary instability leads to a drop size that scales with the jet size itself.39 This strategy, which has been previously used,35 is also followed in the present work but with better control.The working principle of the sub-millimeter capsule formation process is reported in Fig. 1. A compound jet is generated by a co-axial injector, made by a stereolithography technique, and terminated by a tapered glass capillary whose inner diameter di is 150 μm for most of the reported experiments, or 170 μm. The outer liquid is an alginate solution. It flows through a chamber where an elastic membrane is subjected to harmonic vibrations with the help of a piezoelectric actuator.23 In that way, the capillary instability is forced at a controlled wavelength λ.40 By mass conservation and for monodisperse drops, the drop diameter d is equal to (3/2dj2λ)1/3, where dj is the jet diameter. The shell thickness h is tuned by the flow rate ratio rq = qi/qo, where qi and qo are the flow rates of the inner phase and the outer phase, respectively. Indeed, by mass conservation, h = d/2(1 – (rq/(1 + rq))1/3). As originally proposed by Brandenberger et al.,41 eventual coalescence of drops while they are moving to or entering into the gelling bath is prevented by electrically charging the drops. This is achieved by adding an electrode at the location of the jet break-up and set at a potential of the order of 1 kV while grounding the alginate solution. The drops then gain a net electric charge42 and repel each other before impacting the gelling bath where the outer alginate layer turns into a gel.
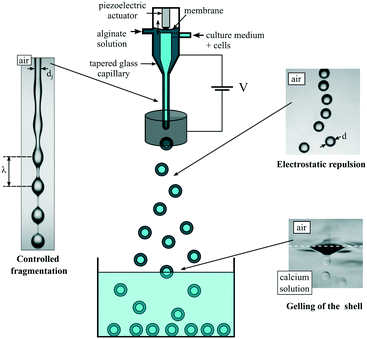 | ||
| Fig. 1 Workflow of the process for creating calibrated sub-millimeter liquid core hydrogel capsules. | ||
2.2 Compound jet formation and fragmentation
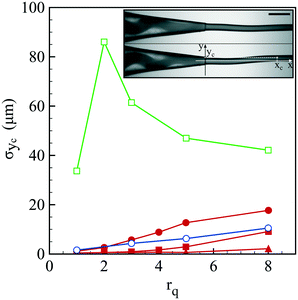
Before discussing the compound jet breakup, let us focus on the formation of the jet itself. As reported in Fig. 2 and Movie S1,† the jet exhibits a flapping motion whose amplitude depends on the liquid phase composition and flow rate ratio. The oscillatory motion of the jet is here characterized by the standard deviation σyc of the jet's center location yc. All reported data have been taken at a distance xc from the capillary tip around 3 mm. For a core only composed of water, the jet moderately beats up to an amplitude of 10 μm for large flow rate ratios. On the other hand, we observe a marked flapping motion with an amplitude of a few tens of μm once NaCl is added into the core solution. The undulations of the jet can be damped if a polymer, here hydroxyethyl cellulose (HEC), is also added into the core solution. Indeed, σyc is almost not measurable for an HEC concentration of 0.5 wt% that corresponds to the most viscous conditions (see Table 2).Flapping can thus be attenuated but we may wonder what is the origin of such a behavior. As revealed by the snapshots shown in Fig. 2, the co-flow inside the injector also exhibits a non-stationary feature, i.e. the core center location oscillates. This motion is the signature of a viscoelastic shear instability triggered by the contrast of viscoelastic properties between the core and the shell solutions.43,44 In addition, the observed spiral motion, which corresponds to a non-axisymmetric mode, has been predicted to be the most unstable one.43 The remarkable effect of NaCl is linked to the nature of alginate which is a polyelectrolyte, i.e. an ionic polymer. Indeed, the presence of ions in solution screens electrostatic repulsion between polymer chains that affects the entanglement conformation of the polymer and thus the rheological properties of the solution.45 This is confirmed by oscillatory rheological measurements where tan![[thin space (1/6-em)]](https://www.rsc.org/images/entities/char_2009.gif) δ, which is the ratio between the viscous and elastic moduli,46 varies from 12.9 to 6 at a pulsation of 1 rad s−1 when 75 mM NaCl is incorporated into the alginate solution. This difference persists at a higher pulsation of 100 rad s−1 where tan
δ, which is the ratio between the viscous and elastic moduli,46 varies from 12.9 to 6 at a pulsation of 1 rad s−1 when 75 mM NaCl is incorporated into the alginate solution. This difference persists at a higher pulsation of 100 rad s−1 where tan![[thin space (1/6-em)]](https://www.rsc.org/images/entities/char_2009.gif) δ is equal to 1.5 and 1.3 without and with salt, respectively. We note that the viscoelastic instability of the co-flow is here triggered at the interface between the core and the shell by diffusion of ions from the core. Fortunately, this shear instability is damped by increasing the core viscosity by adding a small amount of a non-gelling polymer. This flapping motion has a direct impact on the efficiency of capsule formation as discussed in the next section.
δ is equal to 1.5 and 1.3 without and with salt, respectively. We note that the viscoelastic instability of the co-flow is here triggered at the interface between the core and the shell by diffusion of ions from the core. Fortunately, this shear instability is damped by increasing the core viscosity by adding a small amount of a non-gelling polymer. This flapping motion has a direct impact on the efficiency of capsule formation as discussed in the next section.
Another consequence of such a non-Newtonian behavior is the increase of the jet diameter as compared to the inner injector one. This phenomenon, known as die-swelling, is linked to normal stresses built within the injector that relax within the free jet and slows down the flow.47,48 We note that jet swelling may also result from viscous stress relaxation.49 The jet diameter increase is accentuated for thick alginate layers, i.e. for small flow rate ratios rq. Indeed, for a core having a viscosity of 34 mPa s, an alginate solution (LF200FTS) at a concentration of 1.7 wt% and a total flow rate of 120 mL h−1, the jet diameter dj varies from 1.2 times di to 1.5 times di when rq is tuned from 10 to 0. As previously discussed, this has a direct impact on the final capsule size since it is correlated with jet size.
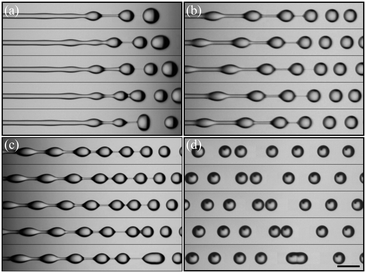
The atomization of the compound jet when the primary viscoelastic instability is damped is then investigated. Time sequences showing the jet fragmentation are reported in Fig. 3. In the absence of any external forcing, several wavelengths develop along the jet and thus lead to a heterogeneous drop size (Fig. 3(a), Movie S2†). Imposing flow rate modulations, with the help of a piezoelectric actuator, then allows the selection of a specific wavelength that results in a train of monodisperse drops (Fig. 3(b)). We note that the drops are connected by cylindrical liquid filaments, thus forming drops in a string structure. The radius of the liquid bridge linearly decreases with time until it ruptures.50 This is reminiscent of the pinch-off of a viscous liquid cylinder.39 Despite controlled perturbations, we observe the occurrence of drop coalescence either during the jet fragmentation (Fig. 3(c)) or after breakup (Fig. 3(d)) that ultimately leads to size polydispersity. A representative high-speed recording of such phenomena is shown in Movie S3.† The origin of such coalescence events is linked to the spatial feature of the capillary instability where capillary and viscous forces acting on the drops evolve along the jet and ultimately amplify small velocity fluctuations. Such velocity fluctuations are linked to the unstable nature of the annular co-flow of liquids having contrasting viscoelastic properties.43,44 More details about this unstable fragmentation can be found elsewhere.50
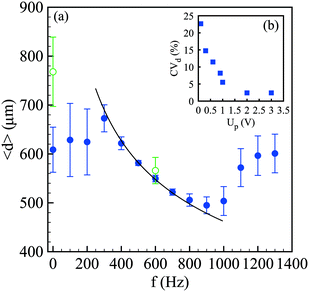
Since the growth rate of the capillary instability depends on the wavenumber k = 2π/λ in a non-monotonic way, with a maximum and a cut-off wavenumber equal to 1/dj, the controlled perturbation features must be set with care.39 Here, we tune the frequency f and the voltage Up applied to the piezoelectric component that imposes periodic oscillations of an elastic membrane that finally modulate the velocity of the alginate solution. Since the capillary instability is a convective instability, i.e. the waves travel at the fluid velocity u, the selected wavenumber is linked to the frequency by k = 2πf/u. As a consequence, for a given flow rate condition, the spray characteristics depend on f and Up. For a single frequency breakup, the drop size should be related to the frequency in such a way: d = (3/2dj2u/f). The average drop size <d> along with the standard deviation represented by error bars is reported in Fig. 4(a) as a function of the frequency for a constant voltage Up. For a low frequency, up to 200 Hz, the drop size is rather constant and is largely distributed. Indeed, the coefficient of variation of the drop size CVd, defined by the ratio between the standard deviation of the drop size σd and the mean size, i.e. CVd = σd/<d>, is more than 15%. Then, the drop size follows the expected power law f−1/3 which is valid for monodisperse drops. This criterion is met for a frequency lying between 500 Hz and 700 Hz where CVd is around 2%. Then, for frequencies larger than 1000 Hz, the average drop size as well as the standard deviation increase and finally saturate. This behavior is a signature of the dispersion relationship of the capillary instability. Indeed, the forcing amplitude is not high enough compared to the background noise level for being able to select a frequency, and thus a wavenumber, far from the optimal one. This is exemplified in Fig. 4(b) where the drop size variation is reported as a function of Up for a fixed frequency. The initial value of CVd is close to 20% at Up = 0.1 V and quickly falls down to 5% at Up = 1 V and then saturates around 2%, i.e. a homogeneous drop size, for Up larger than 2 V. The drop sizes reported in Fig. 4 have been measured in the presence of an electric field. For comparison, the case without electrically charging the drops is also shown with and without controlled perturbations. The effect of the electric field on avoiding drop coalescence is clearly visible at the optimal frequency equal to 600 Hz where the polydispersity switches from 2% to 10% when the drops are not electrically charged.
2.3 Encapsulation efficiency
The spray of compound drops then impacts onto the calcium chloride bath that induces a sol–gel transition of the alginate shell. At impact, the drops flatten while deforming the free interface and rapid and homogeneous engulfment is required for creating a closed hydrogel shell.34 We now discuss the influence of the operating conditions on the capsule formation efficiency. The efficiency of encapsulation is assessed by collecting a few hundreds of capsules and by counting the broken capsules (nb) among the intact ones (nc). The corresponding probability Pc = nc/(nc + nb) to form a capsule is reported in Fig. 5(a) as a function of the core viscosity ηi with and without NaCl for three flow rate ratios, 1, 3 and 5. We notice that Pc is equal to 1 regardless of ηi for rq = 1 but the encapsulation fails for small inner fluid viscosity when the flow rate ratio is increased, corresponding to thinner outer layers. The probability to form a capsule is plotted in Fig. 5(b) as a function of the amplitude of lateral jet fluctuations σyc as defined in Fig. 2. We note that Pc is a linear function of σyc, i.e. Pc = 1 − ασyc, where α is equal to 0.63 × 10⁻² μm−1 and 1.5 × 10⁻² μm−1 for rq equal to 3 and 5, respectively. The viscoelastic shear instability that develops inside the injector leads to off-centering of the core (Fig. 2) and thus to a flapping motion of the jet but also to an inhomogeneous alginate layer thickness. Then, the compound drop may burst at impact if the shell thickness is too thin.34 As a consequence, the probability to form a capsule is directly linked not only to the amplitude of the lateral jet fluctuations but also to the flow rate ratio that sets the mean shell thickness.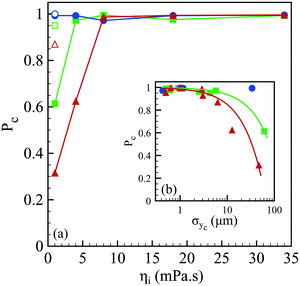 | ||
| Fig. 5 (a) Probability to form a capsule Pc as a function of the core viscosity ηi in the presence of 75 mM NaCl for three flow rate ratios: rq = 1 (●), rq = 3 (■) and rq = 5 (▲), as well as the corresponding probabilities for a pure water core (empty symbols). Lines are here to guide the eye. (b) Probability to form a capsule as a function of the transversal fluctuation σyc of the jet's center location (see Fig. 2) for three flow rate ratios (the same symbols as those in (a)). The continuous lines represent a linear fit, Pc = 1 − ασyc, where α is equal to 0.63 × 10⁻² μm−1 and 1.5 × 10⁻² μm−1 for rq equal to 3 and 5, respectively. | ||
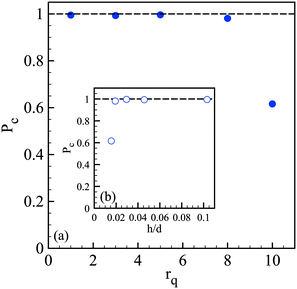
We then wonder what is the value of the critical alginate layer below which encapsulation fails. Experiments are thus performed with a core viscosity such that the jet does not flap anymore. As shown in Fig. 6, the critical rq is between 5 and 8 which corresponds to a critical relative thickness h/d of the outer layer between 0.02 and 0.03. For a compound drop diameter of 500 μm, the critical thickness is then about 12 μm.
We can conclude that the probability to form a capsule is governed by a critical shell thickness below which the full gelling of the alginate layer fails, like for millimeter capsules.34 However, here the critical thickness is either solely set by the flow rate ratio (Fig. 6) or also correlated with the viscoelastic shear instability that develops inside the injector (Fig. 2) which leads to off-centering of the core and thus inhomogeneous shell thickness (Fig. 5).
The outer solution viscosity also impacts on the encapsulation efficiency. We use an alginate having a lower molecular weight in order to be able to vary the solution viscosity by changing the alginate concentration while being above the gelling concentration which is about 1 wt%.51 The core viscosity is such that the viscoelastic shear instability is damped, i.e. the core of the compound jet is kept centered. The values of Pc are reported in Table 1 for a challenging flow rate ratio of 5, i.e. for a rather relatively thin alginate layer. The encapsulation efficiency rapidly decreases for a shell viscosity lower than that used in most of the experiments presented in this study and close to 1.8 Pa s. We assume that the origin of this failure is linked to the higher degree of deformation of the compound drop at the impact. A core having a lower viscosity favors internal mixing and thus erosion of the alginate layer before it turns into a gel, which is not the case with an immiscible core.34
| η o (Pa s) | η i (mPa s) | SDS (mM) | CaCl2 (wt%) | P c |
|---|---|---|---|---|
| 0.12 | 34 | 0.5 | 1 | 0.49 |
| 0.16 | 34 | 0.5 | 1 | 0.70 |
| 0.44 | 34 | 0.5 | 1 | 0.94 |
| 0.57 | 34 | 0.5 | 1 | 0.89 |
| 1.00 | 34 | 0.5 | 1 | 0.91 |
| 1.82 | 34 | 0.5 | 1 | >0.99 |
| 1.94 | 34 | 0.5 | 1 | >0.99 |
| 1.82 | 51 | 0.1 | 1 | 0 |
| 1.82 | 51 | 0.25 | 1 | 0 |
| 1.82 | 51 | 0.5 | 1 | >0.99 |
| 1.82 | 51 | 1 | 1 | >0.99 |
| 1.82 | 51 | 0.5 | 0.1 | 49 |
| 1.82 | 51 | 0.5 | 0.5 | 84 |
| 1.82 | 51 | 0.5 | 1 | >0.99 |
| 1.82 | 51 | 0.5 | 2.5 | >0.99 |
Finally, two other physicochemical parameters, namely the calcium and SDS concentrations, are important to succeed in creating aqueous core hydrogel capsules. The efficiency of the encapsulation process is also reported in Table 1. From these experiments, we can conclude that the minimum SDS concentration is 0.5 mM and that of calcium chloride is 1 wt% which corresponds to 9 mM. Also, traces of surfactant (here Tween 20) in the gelling bath should be present for ensuring proper compound drop engulfment and thus efficient solidification of the whole shell.34
2.4 A tool for parallelized 3D cell culture
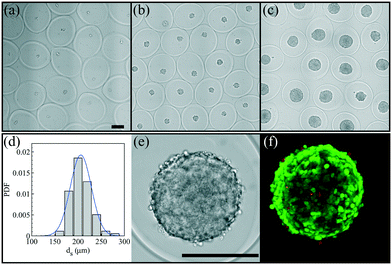
After having defined the right workflow along with the optimal flow, actuation and physicochemical parameters for making a robust process leading to well-calibrated liquid core hydrogel capsules, the process is now applied to cell culture experiments.We study the encapsulation of CT26 cells, cancer cells from mice, that are known to aggregate without adhesion on the alginate hydrogel.35 The core is composed of a cell solution with 0.5 wt% HEC that corresponds to a core viscosity of 34 mPa s. The cell concentration is 5 × 10⁵ cells per mL and leads to an initial expected number of encapsulated cells of around 14 per capsule. The flow rate ratio is 2 and the total flow rate is set to 150 mL h−1. The optimal frequency of the harmonic forcing is found to be 500 Hz that gives rise to a capsule size of the order of 500 μm. Bright field images of a collection of capsules into which cells proliferate are shown in Fig. 7(a–c) for different days after encapsulation. At day 1, cells mostly form a single aggregate. Then, the spheroids reach a size of around 200 μm at day 7. The distribution of spheroid diameter ds at day 7 is reported in Fig. 7(d). It is well described by a normal distribution with an average diameter of 205 μm and a standard deviation equal to 21 μm. The corresponding coefficient of variation is 11%. This value is comparable to those obtained using other protocols of spheroid formation like the hanging drop technique,53 microfabricated wells54 or droplet-based microfluidics32 that show a CV between 10 and 15%. All these techniques are based on a compartmentalization step. The variability in spheroid size is principally due to sampling at a low cell concentration that unavoidably leads to a statistically distributed initial cell number.52 The presence of initial cell aggregates can widen the size distribution. A way to overcome this size heterogeneity is to sample highly diluted cell suspensions for favoring single cell encapsulation. On the other hand, this leads to empty compartments (capsules, drops, microwells, etc.) that impact on the throughput capabilities. An alternative way is to encapsulate dense cell suspensions since the CV is equal to where ν is the average number of cells per compartment. This condition might be relevant for cells having a low proliferation rate. The size of cell aggregates is actually an important factor for cell viability and function since nutrients, oxygen or drugs have to diffuse through all such avascular tissues.3 The optimal spheroid size then depends on the cell type. For example, aggregates of hepatocytes with a diameter of 100 μm have been shown to exhibit maximal activity55 and viability.56
The cell viability of this cell line after encapsulation has been previously estimated at 95%.35 For spheroids, the use of standard live/dead assay combined with epifluorescence microscopy images is rather difficult. First of all, the dye does not penetrate more than a few cell layers, thus the viability is estimated from cells at the periphery of the spheroid. Then, cell counting is not easy with such a three-dimensional structure. An example of a confocal image taken at day 7 is shown in Fig. 7(f). At day 7, the relative intensity of the green channel (alive cells) is close to 90% (Fig. S2†). Therefore, as previously demonstrated,35 the compartmentalized cell culture in liquid core hydrogel capsules allows long duration growth of mammalian cells without altering the cell viability.
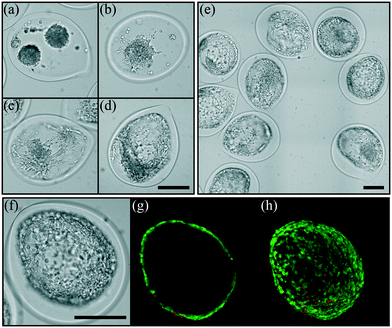
Some cell types, like epithelial cells, require connection to the extracellular matrix (ECM) to enable proper polarization that regulates their function. The adhesion is promoted through a cell receptor's interaction with specific motifs of its environment which are not present in the alginate hydrogel. To circumvent this non-adherence feature, one can functionalize alginate with peptides,57,58 or by using a polymer blend with proteins extracted from the ECM59 or by adsorption of proteins on the inner wall of the capsule after encapsulation.60 In order to make the present bioreactor a more versatile tool for cell culture, an intermediate layer between the core where cells are suspended and the alginate hydrogel membrane is added. The intermediate layer is composed of alginate and collagen type I. Optimal concentrations of collagen and alginate that properly induce cell adhesion have been evaluated with another cell type, keratinocytes61 (see Material and methods). Here, we investigate the effect of the flow rate ratio rq2 between the core and the intermediate solutions on the ability of cells to spread or not on the inner surface of the capsules. This flow rate ratio sets not only the average thickness of the composite hydrogel layer but also the homogeneity of the adhesive layer. Indeed, as shown in Fig. 8, the flow rate ratio governs the ability of cells to spread on such a substrate. For the highest rq2 equal to 10, the loaded cells do not initially aggregate together for building a single spheroid, but multiple spheroids nucleate instead (Fig. 8(a)). This is a signature of weak adhesion that contrasts the non-adhesive case reported in Fig. 7. Then, for rq2 two times lower, multiple spheroids are also observed but in this case some cells at the contact area between the spheroid and the composite substrate exhibit an elongated shape (Fig. 8(b)). For rq2 equal to or lower than 2, cells adopt an elongated shape and spread out all over the composite hydrogel layer without any preferential location. This clearly indicates the formation of a homogeneous adhesive layer. The area occupied by the cells, which reflects the affinity between the cells and the hybrid hydrogel, shows a marked increase for rq2 smaller than 2 (Fig. S2†). Confocal microscopy images reported in Fig. 8(g) and (h) illustrate the possibility to form a single cell layer, like simple epithelium. After 7 days of growth inside the structured hydrogel-based bioreactor, the relative intensity of the fluorescence signal from live cells is around 80% (Fig. S1†).
3 Conclusion
This manuscript reports a methodical study of the process for creating calibrated sub-millimeter liquid core hydrogel capsules that act as bioreactors for 3D cell culture. Let us summarize the key parameters that should be accounted for in achieving efficient cell encapsulation. First, since the capsule formation involves a co-flow of polymer solutions, the viscoelastic properties of the different solutions should be adapted for avoiding hydrodynamic instabilities. A core viscosity larger than 10 mPa s is required. This can be obtained by adding a small amount of a non-gelling polymer into the core solution. The amount of cations, either monovalent or divalent, present in the core solution should be minimized during the encapsulation as they alter the viscoelastic features of the alginate solution. Then, in order to create calibrated capsules, the frequency and amplitude of the forcing should be correctly adjusted. Since the capillary instability of the jet exhibits a resonance-like behavior, i.e. there exists a most amplified mode, the frequency can be adjusted such that the jet fragmentation length is minimal. However, we recommend that a visual inspection of jet fragmentation features with the help of a camera having a fair enough low time exposure, at least 0.1 ms, be performed. Finally, SDS with a minimal concentration of 0.5 mM should be added to the alginate solution and a minimal CaCl2 concentration of 1 wt% with traces of surfactant should be used for the gelling bath.Today, the present technology allows the creation of calibrated sub-millimeter compartments enclosing cells at a production rate of the order of 1000 capsules per second. Automated manipulation of the capsules combined with pre-existing high-throughput technologies, for example based on microplates, would then strengthen the use of the present bioreactor for high-throughput screening applications, like drug development or discovery. The potential use of a millifluidic machine, initially developed for manipulating water-in-oil emulsion drops,62,63 is currently under investigation.
4 Material and methods
4.1 Chemicals
During the characterization of the capsule formation process, aqueous shell solutions are made with sodium alginate Protanal LF200FTS, LF200S or LF10/60 (FMC Biopolymer) and sodium dodecyl sulfate (SDS) (Sigma Aldrich), an anionic surfactant. Aqueous core solutions are composed of hydroxyethyl cellulose (HEC) with a mean molecular weight of 1.3 × 10⁶ g mol−1 (Sigma Aldrich) and NaCl (Sigma Aldrich). All polymer solutions are prepared from milliQ water and set under magnetic stirring at least half a day before use. Rheological properties of the solutions are determined with an MCR501 rheometer (Anton Paar) in a Couette geometry or with an ARES LS1 rheometer (TA Instruments) in a cone-plane geometry. For oscillatory measurements, the imposed strain is 1% and falls into the linear regime. All experiments are performed at 20 °C. Alginate and HEC solutions exhibit a shear-thinning behavior, i.e. viscosity is a decreasing function of the shear rate beyond a critical shear rate. The zero-shear viscosity of the various polymer solutions is reported in Table 2. Gelling baths are CaCl2 (Sigma Aldrich) solutions where a small amount (<0.1 wt%) of Tween 20 (Sigma Aldrich) is added before starting the encapsulation experiments.| Polymer | C (wt%) | η 0 (Pa s) |
|---|---|---|
| LF200FTS | 1.7 | 1.82 |
| LF200S | 2 | 1.70 |
| LF10/60 | 1.8 | 0.12 |
| LF10/60 | 2 | 0.16 |
| LF10/60 | 2.5 | 0.44 |
| LF10/60 | 3.1 | 0.57 |
| LF10/60 | 3.7 | 1.00 |
| LF10/60 | 4.7 | 1.94 |
| HEC | 0.14 | 4 × 10⁻³ |
| HEC | 0.25 | 8 × 10⁻³ |
| HEC | 0.37 | 18 × 10−3 |
| HEC | 0.50 | 34 × 10−3 |
4.2 Encapsulation device
The compound jet is created by using a hybrid injector made by stereolithography and glass capillary techniques.64 A glass capillary with an outer diameter of 1 mm and an inner one of 0.78 mm is first tapered with the help of a gravitational puller (PC-10, Narishige). Then, the tip is cut by using a microforge (M900, Narishige) and finely ground. The final outer and inner diameters are 250 and 150 micrometers, respectively. Some of the experiments, as noticed in the manuscript, are performed with an inner diameter of 170 μm. The surface of the glass tip is made hydrophobic by silanization. The 5 mm long glass tip is glued to a piece made of epoxy by 3D printing (DSM XC11122, Proform) which allows the generation of a concentric flow of two or three liquid phases. Before exiting from the glass capillary, the outer liquid flows into a chamber equipped with a membrane (Encapsulator, Buchi) that can oscillate with the help of a piezoelectric actuator (P-820, PI). Both liquid flows are driven by syringe pumps (PhD Ultra, Harvard Apparatus). The encapsulation device is shown in Fig. S3.†4.3 Encapsulation characterization
The jet is illuminated with a LED panel (SLLUB backlight, Phlox) and observed with a high-speed camera (FastCam SA3, Photron) mounted on a macro zoom microscope (MVX10, Olympus) set horizontally. The jet fragmentation features are obtained with image processing programs developed with MATLAB. The encapsulation efficiency is evaluated from image analysis of hundreds of capsules taken under the microscope.4.4 Cell culture
CT26 WT cells (ATCC) are cultured in DMEM, high glucose medium, and GlutaMAX supplement (Life Technologies) enriched with 10% v/v FBS and 100 units streptomycin/penicillin (10![[thin space (1/6-em)]](https://www.rsc.org/images/entities/char_2009.gif) 000 units per mL, Life Technologies) on tissue culture flasks at 37 °C in an incubator humidified with 5% CO2. After reaching 80% confluence, the cells are trypsinized with 0.05% (w/v) trypsin–EDTA (Life Technologies), centrifuged at 180g for 9 min and counted for further experimental use. After the encapsulation step, the hydrogel capsules are washed with DMEM medium, subsequently transferred in tissue culture flasks and cultivated up to 2 weeks in DMEM, high glucose medium at 37 °C in an incubator humidified with 5% CO2, followed by a medium change every 2 days.
000 units per mL, Life Technologies) on tissue culture flasks at 37 °C in an incubator humidified with 5% CO2. After reaching 80% confluence, the cells are trypsinized with 0.05% (w/v) trypsin–EDTA (Life Technologies), centrifuged at 180g for 9 min and counted for further experimental use. After the encapsulation step, the hydrogel capsules are washed with DMEM medium, subsequently transferred in tissue culture flasks and cultivated up to 2 weeks in DMEM, high glucose medium at 37 °C in an incubator humidified with 5% CO2, followed by a medium change every 2 days.
4.5 Cell encapsulation
The cells are suspended in a solution containing 25 mM HEPES (Sigma Aldrich) and 265 mM sorbitol (Sigma Aldrich) and 0.5 wt% HEC, at a pH of 7.3. Solutions are initially filtered at 0.2 μm. For a single alginate shell, a solution of 2 wt% sodium alginate (LF200S, FCM) containing 0.5 mM SDS and 250 units streptomycin/penicillin is first filtered with a 5 μm sterile filter (VWR) followed by sterile filtration at 1 μm with a glass filter (Sigma Aldrich).The collagen–alginate mixture is composed of 0.8 wt% alginate, 1.6 mg mL−1 collagen, and 16 mM HEPES, and diluted in DMEM. The pH is adjusted to 6.5 with a 1 M NaOH solution.
The gelling bath is composed of 1 wt% calcium chloride buffered in 200 mM HEPES at pH = 7.2, 264 mosmol, and filtered at 0.2 μm. The hydrogel capsules containing cells are produced at a rate around 500 capsules per second and collected for a couple of minutes. The collecting time is small enough for limiting cell sedimentation and thus cell concentration variation during encapsulation. Stirring the cell suspension inside the syringe would then be required for long experiments. They are then filtered out from the gelling solution (Tamis cell strainer 70–100 μm pore size, Fisher Scientific), followed by a washing step with 200 mM HEPES, and finally stored in HEPES/sorbitol solution.
The viability of the encapsulated cells is determined by using a Live/Dead Viability/Cytotoxicity Kit with calcein-AM (CAM, Sigma Aldrich) for indicating living cells (green signal) and propidium iodide for indicating dead cells (red signal). The stained cells inside the capsules are imaged using a Nikon Ti confocal microscope with a 10× objective.
The cell encapsulation experiments have been performed two times for most of the reported conditions. Between 5 and 100 capsules were imaged for each experiment.
Acknowledgements
We thank Danijela Vignevic for providing us with CT26 cells, the SIMM and MMC groups from ESPCI for giving us access to their rheometers and Moshen Dahesh for valuable discussion on rheology. This work was supported by Grant ANR-10-BLAN-1514 from Agence Nationale de la Recherche, France.References
- E. R. Shamir and A. J. Ewald, Nat. Rev. Mol. Cell Biol., 2014, 15, 647–664 Search PubMed.
- B. M. Baker and C. S. Chen, J. Cell Sci., 2012, 125, 3015–3024 Search PubMed.
- L. G. Griffith and M. A. Swartz, Nat. Rev. Mol. Cell Biol., 2006, 7, 211–224 Search PubMed.
- S. Breslin and L. O'Driscoll, Drug Discovery Today, 2013, 18, 240–249 Search PubMed.
- E. Fennema, N. Rivron, J. Rouwkema, C. van Blitterswijk and J. de Boer, Trends Biotechnol., 2013, 31, 108–115 Search PubMed.
- F. Hirschhaeuser, H. Menne, C. Dittfeld, J. West, W. Mueller-Klieser and L. A. Kunz-Schughart, J. Biotechnol., 2010, 148, 3–15 Search PubMed.
- L.-B. Weiswald, D. Bellet and V. Dangles-Marie, Neoplasia, 2015, 17, 1–15 CrossRef PubMed.
- M. Rimann and U. Graf-Hausner, Curr. Opin. Biotechnol., 2012, 23, 803–809 Search PubMed.
- H. Uludag, P. De Vos and P. A. Tresco, Adv. Drug Delivery Rev., 2000, 42, 29–64 Search PubMed.
- G. Orive, E. Santos, D. Poncelet, R. M. Hernández, J. Pedraz, L. U. Wahlberg, P. De Vos and D. Emerich, Trends Pharmacol. Sci., 2015, 36, 537–546 Search PubMed.
- G. Orive, R. M. Hernandez, A. R. Gascon, R. Calafiore, T. M. S. Chang, P. de Vos, G. Hortelano, D. Hunkeler, I. Lacik and J. L. Pedraz, Trends Biotechnol., 2004, 22, 87–92 Search PubMed.
- D. Poncelet, R. Lencki, C. Beaulieu, J. P. Halle, R. J. Neufeld and A. Fournier, Appl. Microbiol. Biotechnol., 1992, 38, 39–45 Search PubMed.
- U. Prusse, L. Bilancetti, M. Bucko, B. Bugarski, J. Bukowski, P. Gemeiner, D. Lewinska, V. Manojlovic, B. Massart, C. Nastruzzi, V. Nedovic, D. Poncelet, S. Siebenhaar, L. Tobler, A. Tosi, A. Vikartovska and K. D. Vorlop, Chem. Pap., 2008, 62, 364–374 Search PubMed.
- F. Lim and A. Sun, Science, 1980, 210, 908–910 CAS.
- V. Breguet, R. Gugerli, M. Pernetti, U. von Stockar and I. W. Marison, Langmuir, 2005, 21, 9764–9772 Search PubMed.
- S. Sakai, S. Ito and K. Kawakami, Acta Biomater., 2010, 6, 3132–3137 Search PubMed.
- T. Wang, I. Lacik, M. Brissova, A. V. Anilkumar, A. Prokop, D. Hunkeler, R. Green, K. Shahrokhi and A. C. Powers, Nat. Biotechnol., 1997, 15, 358–362 Search PubMed.
- M. V. Sefton, R. M. Dawson, R. L. Broughton, J. Blysniuk and M. E. Sugamori, Biotechnol. Bioeng., 1987, 29, 1135–1143 Search PubMed.
- C. Berkland, E. Pollauf, N. Varde, D. Pack and K. K. Kim, Pharm. Res., 2007, 24, 1007–1013 Search PubMed.
- I. G. Loscertales, A. Barrero, I. Guerrero, R. Cortijo, M. Marquez and A. M. Ganan-Calvo, Science, 2002, 295, 1695–1698 CrossRef CAS PubMed.
- S. Zhao, P. Agarwal, W. Rao, H. Huang, R. Zhang, Z. Liu, J. Yu, N. Weisleder, W. Zhang and X. He, Integr. Biol., 2014, 6, 874–884 Search PubMed.
- D. Serp, E. Cantana, C. Heinzen, U. von Stockar and I. W. Marison, Biotechnol. Bioeng., 2000, 70, 41–53 Search PubMed.
- M. Whelehan and I. W. Marison, J. Microencapsulation, 2011, 28, 669–688 CrossRef CAS PubMed.
- C. Berkland, K. K. Kim and D. W. Pack, J. Controlled Release, 2001, 73, 59–74 Search PubMed.
- H. Zhang, E. Tumarkin, R. Peerani, Z. Nie, R. M. A. Sullan, G. C. Walker and E. Kumacheva, J. Am. Chem. Soc., 2006, 128, 12205–12210 Search PubMed.
- W. Wang, X. D. Liu, Y. B. Xie, H. Zhang, W. T. Yu, Y. Xiong, W. Y. Xie and X. J. Ma, J. Mater. Chem., 2006, 16, 3252–3267 Search PubMed.
- W. H. Tan and S. Takeuchi, Adv. Mater., 2007, 19, 2696–2701 Search PubMed.
- L. F. Yu, M. C. W. Chen and K. C. Cheung, Lab Chip, 2010, 10, 2424–2432 Search PubMed.
- S. Utech, R. Prodanovic, A. S. Mao, R. Ostafe, D. J. Mooney and D. A. Weitz, Adv. Healthcare Mater., 2015, 4, 1628–1633 Search PubMed.
- D. Velasco, E. Tumarkin and E. Kumacheva, Small, 2012, 8, 1633–1642 Search PubMed.
- Y. Morimoto, W. H. Tan, Y. Tsuda and S. Takeuchi, Lab Chip, 2009, 9, 2217–2223 Search PubMed.
- C. Kim, S. Chung, Y. E. Kim, K. S. Lee, S. H. Lee, K. W. Oh and J. Y. Kang, Lab Chip, 2011, 11, 246–252 Search PubMed.
- Q. S. Chen, S. Utech, D. Chen, R. Prodanovic, J. M. Lin and D. A. Weitz, Lab Chip, 2016, 16, 1346–1349 RSC.
- N. Bremond, E. Santanach-Carreras, L. Y. Chu and J. Bibette, Soft Matter, 2010, 6, 2484–2488 Search PubMed.
- K. Alessandri, B. R. Sarangi, V. V. Gurchenkov, B. Sinha, T. R. Kiessling, L. Fetler, F. Rico, S. Scheuring, C. Lamaze, A. Simon, S. Geraldo, D. Vignjevic, H. Domejean, L. Rolland, A. Funfak, J. Bibette, N. Bremond and P. Nassoy, Proc. Natl. Acad. Sci. U. S. A., 2013, 110, 14843–14848 Search PubMed.
- C. Clanet and J. C. Lasheras, J. Fluid Mech., 1999, 383, 307–326 Search PubMed.
- X. Zhang and O. A. Basaran, Phys. Fluids, 1995, 7, 1184–1203 Search PubMed.
- A. V. Anilkumar, I. Lacik and T. G. Wang, Biotechnol. Bioeng., 2001, 75, 581–589 Search PubMed.
- J. Eggers and E. Villermaux, Rep. Prog. Phys., 2008, 71, 036601 CrossRef.
- E. F. Goedde and M. C. Yuen, J. Fluid Mech., 1970, 40, 495–511 Search PubMed.
- H. Brandenberger, D. Nüssli, V. Piëch and F. Widmer, J. Electrost., 1999, 45, 227–238 Search PubMed.
- J. M. Schneider, N. R. Lindblad, J. C. D. Hendricks and J. M. Crowley, J. Appl. Phys., 1967, 38, 2599–2605 Search PubMed.
- E. J. Hinch, O. J. Harris and J. M. Rallison, J. Non-Newtonian Fluid Mech., 1992, 43, 311–324 Search PubMed.
- R. Govindarajan and K. C. Sahu, Annu. Rev. Fluid Mech., 2014, 46, 331–353 Search PubMed.
- N. B. Wyatt and M. W. Liberatore, Soft Matter, 2010, 6, 3346–3352 Search PubMed.
- M. Rubinstein and R. H. Colby, Polymer physics, Oxford Univ Press, 2008 Search PubMed.
- R. I. Tanner, J. Polym. Sci., Part B: Polym. Phys., 1970, 8, 2067–2078 Search PubMed.
- C. Allain, M. Cloitre and P. Perrot, J. Non-Newtonian Fluid Mech., 1997, 73, 51–66 Search PubMed.
- S. L. Goren and S. Wronski, J. Fluid Mech., 1966, 25, 185–198 Search PubMed.
- H. Doméjean, J. Bibette and N. Bremond, Phys. Rev. Fluids, 2016, 1, 063903 Search PubMed.
- L. Rolland, E. Santanach-Carreras, T. Delmas, J. Bibette and N. Bremond, Soft Matter, 2014, 10, 9668–9674 Search PubMed.
- S. Chandrasekhar, Rev. Mod. Phys., 1943, 15, 0001–0089 Search PubMed.
- J. M. Kelm, N. E. Timmins, C. J. Brown, M. Fussenegger and L. K. Nielsen, Biotechnol. Bioeng., 2003, 83, 173–180 Search PubMed.
- M. D. Ungrin, C. Joshi, A. Nica, C. Bauwens and P. W. Zandstra, PLoS One, 2008, 3, e1565 Search PubMed.
- R. Glicklis, J. C. Merchuk and S. Cohen, Biotechnol. Bioeng., 2004, 86, 672–680 Search PubMed.
- E. Curcio, S. Salerno, G. Barbieri, L. De Bartolo, E. Drioli and A. Bader, Biomaterials, 2007, 28, 5487–5497 Search PubMed.
- J. A. Rowley, G. Madlambayan and D. J. Mooney, Biomaterials, 1999, 20, 45–53 Search PubMed.
- K. Y. Lee and D. J. Mooney, Prog. Polym. Sci., 2012, 37, 106–126 Search PubMed.
- J. Venkatesan, I. Bhatnagar, P. Manivasagan, K.-H. Kang and S.-K. Kim, Int. J. Biol. Macromol., 2015, 72, 269–281 Search PubMed.
- K. Alessandri, M. Feyeux, B. Gurchenkov, C. Delgado, A. Trushko, K. H. Krause, D. Vignjevic, P. Nassoy and A. Roux, Lab Chip, 2016, 16, 1593–1604 Search PubMed.
- A. Funfak, N. Atrux-Tallau, N. Bremond and J. Bibette, To be submitted.
- L. Baraban, F. Bertholle, M. L. M. Salverda, N. Bremond, P. Panizza, J. Baudry, J. A. G. M. de Visser and J. Bibette, Lab Chip, 2011, 11, 4057–4062 Search PubMed.
- L. Boitard, D. Cottinet, N. Bremond, J. Baudry and J. Bibette, Eng. Life Sci., 2015, 15, 318–326 Search PubMed.
- H. Doméjean, PhD thesis, UPMC, 2014 Search PubMed.
Footnote |
| † Electronic supplementary information (ESI) available. See DOI: 10.1039/c6lc00848h |
| This journal is © The Royal Society of Chemistry 2017 |

