Molecular mobility in carbon dioxide hydrates†
Zeina M.
Jendi
 ,
Phillip
Servio
and
Alejandro D.
Rey
*
Department of Chemical Engineering, McGill University, Montreal, QC H3A 2B2, Canada. E-mail: alejandro.rey@mcgill.ca; Tel: +1 514 398 4196
First published on 19th September 2017
Abstract
Gas hydrates are at the center of current materials research due to their critical importance to the environment and energy supply, and further progress requires knowledge of their mechanical properties. In this work we use molecular dynamics to study the molecular mobility in carbon dioxide hydrates. Specifically, the influences of induced vacancy defects and changes in composition on diffusion coefficients were studied. Introducing few water vacancy defects and a 3% change in cage occupancy changed the diffusion coefficient by almost two orders of magnitude and a factor of four, respectively. The diffusion coefficient of the water molecules was also influenced but to a much lesser extent.
Design, System, ApplicationThe design of artificial gas hydrates and the exploitation of natural ones require a fundamental understanding and quantitative characterization of the mobility of the hydrate constituents. Gas hydrates consist of hydrogen bonded water molecules that entrap gases under high pressure and low temperature. These materials are non-stoichiometric and crystalline; thus, the cage occupancy and structural defects can be optimized for mechanical performance. In this work, water vacancies and cage occupancy were found to significantly affect carbon dioxide mobility. The mobility of the water molecules was also affected but to a much lesser extent. These findings are essential when modelling gas hydrate formation and plastic deformation. This comes into play when designing gas hydrate pellets for gas transport and during risk assessment studies for gas hydrate production. |
Introduction
Gas hydrates are polycrystalline inclusion compounds that consist of hydrogen-bonded water molecules that form cages entrapping gas molecules under high pressure and/or low temperature. They have recently received widespread attention due to their importance in countless science and technology fields. For example, natural methane hydrates are considered an alternative energy resource since some conservative assessments suggest that they incorporate an energy content that is twice the energy stored in all other fossil fuel deposits.1,2 Japan is one of the leading countries in this field, and it is expected to be ready for commercial mass production by 2018.2,3 Additionally, these natural methane hydrate deposits are being considered for carbon dioxide sequestration purposes due to the thermodynamic favourability of the process and the potential for high methane recovery.4,5 Additionally, gas hydrates can constitute potential media for gas storage and transportation, and they are problematic aspects in flow assurance and climate change.6During gas hydrate formation and mechanical deformation, one of the most critical parameters is the diffusivity of water and gas molecules. Once hydrates start forming, they form a film that inhibits further hydrate growth due to mass transfer limitations. As for mechanical deformation, this is largely governed by the flow rate of defects which is strongly influenced by the diffusion constants of the individual constituents. Both phenomena require accurate modelling for all the above-mentioned applications. Therefore, this molecular simulation work studies and quantifies the diffusion behaviour in gas hydrate systems.
There have been previous studies that addressed certain aspects of this subject, and we here highlight a few. Deuteron NMR and X-ray diffraction experiments have studied the configurational dynamics and diffusivities in tetrahydrofuran and carbon dioxide hydrates.7,8 Guests capable of hydrogen bonding have been studied both experimentally and computationally in terms of their formation kinetics, defect stabilization mechanism, water mobility, and influence of other small guests.9–13 The crucial role of water vacancies in guest molecule diffusion through hydrates has been highlighted in several studies.14–17Ab initio simulations have studied the stability and diffusivity of different gases in hydrates,18 and a recent study has concluded that direct diffusion of methane and carbon dioxide through the hydrate structure is possible without irreversibly distorting the cage structures and without the need for lattice defects.19 X-ray diffraction and molecular dynamics studies have highlighted the importance of interstitial water defects during hydrate growth.8,20 Another experimental group have suggested the importance of hydrogen bond breakage during hydrate growth from ice in the diffusion-limited stage.21 Hydrogen hydrates have also been studied in terms of diffusion barrier, rattling frequency in cages, tunnelling effect, among other factors.22–27
With a wide range of gas hydrates, the focus of this work is the mobility of water and gas molecules in carbon dioxide hydrates. Although few experimental and theoretical studies have already been done for this system, reported diffusion constants show discrepancies of up to four orders of magnitude.8,11,14,17,28 We believe that differences in cage occupancies and defect concentration greatly contribute to the observed inconsistency. These two factors need to be considered when analysing gas hydrate deposits and can be manipulated when designing gas hydrate pellets by adjusting the thermodynamic conditions, grain size, and purity, among other factors. Therefore, this work studies the effect of cage occupancy and vacancy concentration on the hopping rate of gas molecules, free energy barrier, and diffusion coefficient in carbon dioxide hydrate over a wide temperature range. This work extends our current efforts in MD and DFT simulations of these materials.29–32
Methodology
The cubic sI structure was considered for carbon dioxide hydrate. The primitive lattice unit consists of two 512 cages, of 12 pentagonal faces, and six larger 51262 cages, of 12 pentagonal and 2 hexagonal faces, with a total of 46 water molecules. The atomic coordinates have been obtained from ref. 33, and a supercell of 4 × 4 × 4 lattice units was considered. The cage occupancy in the small cages was always 50%, and the occupancy in the large cages was 93, 96, and 99%, depending on the considered case. These values have been measured experimentally during hydrate formation.34 The specific occupancy was generated by randomly removing carbon dioxide molecules from a supercell with 100% occupancy. Water vacancies have been introduced by removing randomly 1, 3, and 5 water molecules from the supercell, which corresponds to a vacancy concentration, defined as the number of vacancies with respect to the total number of water molecules, of 0.03, 0.1, and 0.17%, respectively.All simulations were performed using the LAMMPS package.35 It must be mentioned that our starting point to validate our methodology was the work of ref. 28; therefore, most simulation parameters have been adapted from their work. The TIP4P/2005 and EPM2 potentials were considered for the water and carbon dioxide molecules, respectively, and the Lorentz–Berthelot mixing rules were used for cross-interactions. Long range interactions were considered using the pppm solver, and the SHAKE algorithm was invoked to keep the water molecules rigid and fix the bond length in carbon dioxide molecules. The real space cutoff distance was 9.0 Å, and the integration timestep was 2 fs. Molecular dynamics (MD) runs were performed at constant temperature and pressure using Nose–Hoover thermostat and barostat with relaxation times of 1 ps and 5 ps, respectively. Each simulation involved three stages: an initial equilibration at 250 K for 10 ns, intermediate equilibration at the desired temperature for 10 ns, and a production run for 100 ns. In ref. 28, ten independent runs of 10 ns each with different initial conditions were implemented, but in this work we opted to run a single simulation of 100 ns. We believe the present approach is more suitable to meet our objectives, to capture the hopping incidents, and to ensure that the system is not melted. Indeed, many runs at higher temperatures that were discarded were found to be stable in the first 10–40 ns but melted afterwards. The pressure was maintained at 100 MPa, and the considered temperature range was 280–310 K. Data was collected every 500 fs, and the mean square displacement (MSD) was averaged every 10 data points. It should be noted that all considered cases are well equilibrated, and the maximum drift in the density from the average value was only 0.18% during the production run. Melting was observed for some cases at high temperatures, and these were eliminated from the analysis. The equilibrium lattice constants are reported in the ESI.† As expected, the melting temperature appears to decrease with increasing number of water vacancies and decreasing fraction of gas occupancy.
First, the free energy barrier for carbon dioxide diffusion was calculated using the transition state theory (TST).36 The temperature dependency of the hopping rate, k(T), was modelled as follows:
 | (1) |
Next, the diffusion coefficient of carbon dioxide in the hydrate was calculated using a two-term mathematical model. This model has been used for hydrogen and hydrogen-tetrahydrofuran hydrates,24 but it was originally developed for the diffusion of gases in ultrathin, dense nanoporous silica films.37 The model involves anomalous and Fickian terms as follows:
 | (2) |
 is the fractal dimension of the random walk of the molecule and is taken as 3.768 based on previous work.24 During short to intermediate times, the first term describes the MSD as the gas molecules are confined within the cages. At intermediate times, the MSD levels off to a plateau of 6l2. At longer times, as the gas hopping energy barrier is overcome, gas molecules start to diffuse following Fick's law, and the second term dominates the diffusion mechanism.
Lastly, the diffusion coefficient of water molecules within the hydrate was calculated from the MSD. During almost the last 50 ns of the production runs, the water diffusion was Fickian as reflected by the slope of the log–log plot of MSD with respect to time. Thus, only the second term in eqn (2) was used for the fitting.
Results and discussion
Free energy barrier for carbon dioxide diffusion
To provide an estimate of the reliability of the 100 ns production run to sample the phase space, we have performed for case 1 in Table 1 three independent runs, of different initial velocity ensembles and carbon dioxide positions. The results presented for case 1 are average values, and the standard deviations for the enthalpy, entropy, and free energy of activation were found to be 8 kJ mol−1, 28 J mol−1 K−1, and 1 kJ mol−1, respectively. The free energy barrier was calculated at 270 K for comparison with literature data.| X (%) | N | ΔH (kJ mol−1) | ΔS (J mol−1 K−1) | ΔG270K (kJ mol−1) | |
|---|---|---|---|---|---|
| Case 1 | 96 | 0 | 150 | 401 | 42 |
| Case 2 | 96 | 1 | 73 | 154 | 31 |
| Case 3 | 96 | 3 | 6 | −59 | 22 |
| Case 4 | 96 | 5 | 19 | −6 | 21 |
| Case 5 | 99 | 0 | 200 | 550 | 52 |
| Case 6 | 93 | 0 | 91 | 205 | 36 |
| Ref. 28 | 96 | 0 | 138 ± 3 | 348 ± 10 | 44 ± 6 |
| Ref. 8 (263 K, 0.98 MPa, 80% occupancy), exp. | — | — | — | — | 39 |
| Ref. 14, (273 K, 70% small cage occupancy), theo. | 90 | — | — | — | 33 |
The free energy barrier for carbon dioxide diffusion exhibited strong dependency on cage occupancy and the presence of induced vacancies as Table 1 shows. With the introduction of a single vacancy only, the free energy of activation, ΔG, dropped by 26%. With five vacancies, ΔG dropped almost by half. This reflects the significant role of vacancies in assisting the diffusion of the gas molecules, as suggested by previous studies.9,14,15,17,28 While vacancies occur naturally to assist in gas diffusion, their introduction into the lattices further assists diffusion without affecting stability. As for cage occupancy, this is expected to affect the availability of free cages for gas hopping and the ease of distortion of the cages during diffusion. A small increase in large cage occupancy from 96 to 99% (or total cage occupancy change from 85 to 87%) caused a 24% increase in ΔG. On the other hand, a decrease from 96 to 93% (or total cage occupancy change from 85 to 82%) caused a 14% decrease. In fact, cage occupancies smaller than 100% can be thought of as defects to the perfect lattice with all cages occupied. Thus, the effect of cage occupancy can be understood in a similar way to that of vacancy defects. This strong dependency on the presence of defects and cage occupancy can partly explain the discrepancies between different studies given that our calculated values fall within those of other studies reported in Table 1. It also highlights the importance of accurately measuring cage occupancy and considering the effects of defects in experimental work.
Moreover, the enthalpy, ΔH, and entropy, ΔS, of activation exhibit interesting trends. Both decrease, in general, with the introduction of vacancies and the decrease in cage occupancy. As these factors ease the diffusion process, ΔH is expected to decrease as well. Although gas diffusion is expected to induce disordering in the lattice and an associated positive ΔS, ΔS becomes smaller with defects, such as vacancies and non-100% cage occupancies. These defects induce disorder into the system such that the diffusion process does not require to induce significant disorder. ΔS even becomes negative with the introduction of 3 and 5 vacancies, and this reflects a loss of degrees of freedom in the activated state during diffusion.38
It is worth noting that structural rearrangements were observed during the gas diffusion process. The following analysis was done for case 1. We observed gas hopping in a range of scenarios among the large 51262 cages and the smaller 512 cages: large to large, large to small, and small to large cage hopping. For the large to large cage hopping case, we observed the combining of a hexagonal side with a pentagonal side of the cage with no evident vacancies as found in a previous study.28 However, for the large to large hopping case, we observed a single jump through the combination of two pentagonal faces in a vacancy-assisted mechanism similar to one found earlier.14,17 For the large to small and small to large hopping cases, these were found to display the greatest structural rearrangements with multiple vacancies. Several studies have highlighted the importance of vacancies in gas diffusion.14–17,28 Depictions of the different scenarios is provided in the ESI.†
Carbon dioxide diffusion coefficient
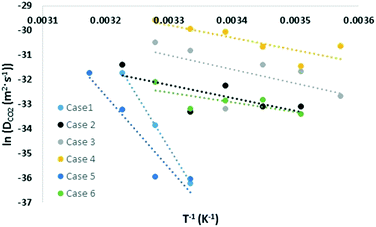
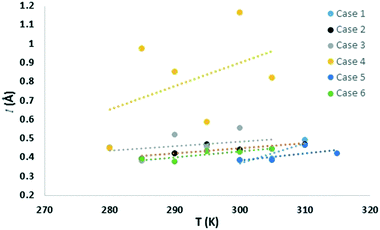
Similar to the free energy barrier, the diffusion coefficient for carbon dioxide also exhibited strong dependency on cage occupancy and the introduction of vacancies. The fitted diffusion coefficient, DCO2, and the characteristic maximum displacement range within the cages, l, are shown in Fig. 2 and 3. For completeness, the A parameter results and raw data for the diffusion coefficient are summarized in the ESI.† The fitting was done over different data ranges at each temperature, and the reported values are averages. For ease of comparison, the data was fitted to linear models to show the average trend only. The temperature dependency is reported in Table 2.| X (%) | N | Models | T (K) | |
|---|---|---|---|---|
| Case 1 | 96 | 0 | ln(DCO2) = −41![[thin space (1/6-em)]](https://www.rsc.org/images/entities/char_2009.gif) 734/T + 102.9 734/T + 102.9 |
300–310 |
| l = 1.08 × 10⁻²T − 2.87 | ||||
| Case 2 | 96 | 1 | ln(DCO2) = −5284/T − 14.8 | 285–310 |
| l = 2.76 × 10⁻³T − 0.38 | ||||
| Case 3 | 96 | 3 | ln(DCO2) = −5667/T − 12.3 | 280–305 |
| l = 2.43 × 10⁻³T − 0.25 | ||||
| Case 4 | 96 | 5 | ln(DCO2) = −5109/T − 12.9 | 280–305 |
| l = 1.24 × 10⁻²T − 2.83 | ||||
| Case 5 | 99 | 0 | ln(DCO2) = −29![[thin space (1/6-em)]](https://www.rsc.org/images/entities/char_2009.gif) 543/T + 61.9 543/T + 61.9 |
300–315 |
| l = 3.73 × 10⁻³T − 0.74 | ||||
| Case 6 | 93 | 0 | ln(DCO2) = −3897/T − 19.7 | 285–305 |
| l = 3.11 × 10⁻³T − 0.50 | ||||
| Ref. 28, theo. | 96 | 0 | D CO2 = 1 × 10⁻¹⁶ − 2 × 10⁻¹⁴ | 270 |
| Ref. 8 (0.98 MPa, 80% occupancy), exp. | — | — | D CO2 = 7.4 × 10⁻¹⁶ − 1 × 10⁻¹⁴ | 272.5 |
| Ref. 11 (82% occupancy), exp. | — | — | D CO2 < 1.1 × 10⁻¹⁵ | 173–263 |
| Ref. 14 (70% small cage occupancy), theo. | 90 | — | D CO2 = 1 × 10⁻¹² | 273 |
| Ref. 17 (1 atm, 87.5% small cage occupancy, 0.01% water vacancy concentration), theo. | 97.9 | — | D CO2 = 3.6 × 10⁻¹⁶ | 273 |
| D CO2 = 1.1 × 10⁻¹⁵ | 288 |
As Table 2 shows, literature values for the diffusion coefficient can differ by up to 4 orders of magnitude at the same temperature, and this can be understood considering our results. Using the fitted models at 305 K, the diffusion coefficient increased by 6, 21, and 72 times upon the introduction of 1, 3, and 5 vacancies, respectively. This again reflects the significant role of vacancies in assisting diffusion. As for cage occupancy, an increase in the large cage occupancy from 96 to 99% dropped the diffusion coefficient by one third, and a decrease from 96 to 93% increased it by 4 times. Within the considered cases at 305 K, there is a maximum variation in diffusion coefficients of two orders of magnitude. This is expected as explained for the free energy barrier for diffusion. In fact, extrapolating the fitted models to 270 K gives diffusion coefficients within the experimental range and with variations of up to 8 orders of magnitude among the different considered cases. The results are also within the range of the reported theoretical values. Moreover, the effect of increasing cage occupancy can be used to give insight on the effect of increasing pressure beyond the equilibrium pressure. A higher pressure induces higher cage occupancy. However, we believe there would be a plateau eventually in the diffusion coefficient dependency on composition and vacancy concentration.
As for the parameter l, this increases as diffusion becomes easier, as expected. Specifically, at 305 K, it increased by 9, 16, and 125% upon the introduction of 1, 3, and 5 vacancies, respectively. Also, an increase in the large cage occupancy from 96 to 99% decreased it by 6%, and a decrease from 96 to 93% increased it by 6%. Thus, easier diffusion is associated with larger cages and greater vibrational distances within the cages. This shows how lower cage occupancies and vacancies result in larger cages. To put the values into perspective, a rough estimate can be obtained from the physical meaning of this parameter. Before gas molecules exhibit Fickian diffusion, the MSD levels off at 6l2, which corresponds to the square of the maximum displacement within the cages. Thus, l can be approximated as:24
 | (3) |
 corresponds to the shortest approach distance between the water and carbon dioxide molecules, and Rcage corresponds to the cage radius. The former is approximated from the force field as 2.95 Å, while the latter is obtained from a weighted average of the small and large cages' radii as 4.24 Å. This yields a value of 0.52 Å for l, which is within the reported range (Fig. 3).
It is worth noting that the different cases exhibited differing dominance of the two diffusion terms as expected. For example, case 5 with the slowest diffusion was dominated by the non-percolating term throughout the entire simulation time. On the other hand, case 4 with the fastest diffusion involved greater contribution from the Fickian term, though the non-percolating term was also significant.
Water diffusion coefficient
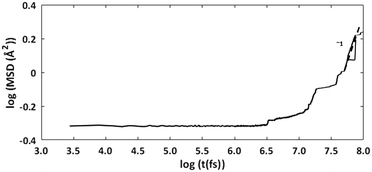
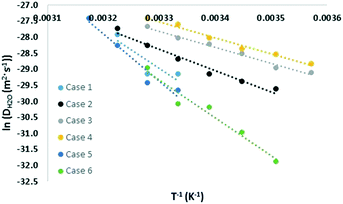
The cage occupancy and presence of vacancies are expected to influence the diffusivity of the water molecules and may influence the structural elasticity of a gas hydrate crystal. This has been explored by computing the water diffusion coefficient and the volumetric thermal expansion coefficient.The diffusion coefficient was computed using the MSD of the water molecules. During approximately the second half of the simulation time, the log–log plot of the MSD exhibited a slope of approximately 1 (Fig. 4). This region was used to fit a linear trend line through the MSD data versus time whose slope is 6D. The fitted diffusion coefficient, DH2O, is shown in Fig. 5. For ease of comparison, the data was fitted to linear models to show the average trend only. The results are summarized in Table 3, and the raw data can be found in the ESI.†
| X (%) | N | Models | T (K) | |
|---|---|---|---|---|
| Case 1 | 96 | 0 | ln(DH2O) = −11![[thin space (1/6-em)]](https://www.rsc.org/images/entities/char_2009.gif) 470/T + 8.9 470/T + 8.9 |
300–310 |
| α V = 2.38 × 10⁻⁴ | ||||
| Case 2 | 96 | 1 | ln(DH2O) = −6625/T − 6.5 | 285–310 |
| α V = 2.58 × 10⁻⁴ | ||||
| Case 3 | 96 | 3 | ln(DH2O) = −4974/T − 11.4 | 280–305 |
| α V = 2.60 × 10⁻⁴ | ||||
| Case 4 | 96 | 5 | ln(DH2O) = −5020/T − 11.0 | 280–305 |
| α V = 2.61 × 10⁻⁴ | ||||
| Case 5 | 99 | 0 | ln(DH2O) = −14![[thin space (1/6-em)]](https://www.rsc.org/images/entities/char_2009.gif) 784/T + 19.4 784/T + 19.4 |
300–315 |
| α V = 2.50 × 10⁻⁴ | ||||
| Case 6 | 93 | 0 | ln(DH2O) = −11671/T + 9.2 | 285–305 |
| α V = 2.49 × 10⁻⁴ | ||||
| Ref. 14 (70% small cage occupancy), theo. | 90 | — | D H2O = 1 × 10⁻²³ | 200 |
| Ref. 17 (1 atm, 0.01% water vacancy concentration), theo. | — | — | D H2O = 1 × 10⁻¹⁴ | 273 |
Although the water diffusion coefficient exhibited vacancy and occupancy dependency, the dependency was smaller compared to the case of carbon dioxide diffusion coefficient. Using the fitted models at 305 K, the diffusion coefficient increased by 1.6, 2.7, and 3.5 times upon the introduction of 1, 3, and 5 vacancies, respectively. Thus, induced water vacancies assist in water diffusion by relieving structural stresses though these stresses appear to be less inhibitive for water diffusion compared to gas diffusion. As for cage occupancy, this has even a smaller effect. For cases 5 and 6, the diffusion coefficients are within 30% of that of case 1. This small difference is not relatively significant and shows that the gas molecules do not inhibit the water diffusion as much as they inhibit their self-diffusion. Extrapolation of the water diffusion coefficient to 200 K yields a value of 2 × 10⁻²⁴–9 × 10⁻²² m2 s−1 for cases 1, 5, and 6 with no induced vacancies. The literature value14 reported in Table 3 lies within this range. Also, the reported results in the ESI† agree with those of ref. 17.
Finally, it is worth noting that although the gas diffusion coefficient varies with cage occupancy and the presence of vacancies, the volumetric thermal expansion coefficient exhibited almost no dependency as shown in Table 3. The thermal expansion coefficient, αV, was calculated as:
 | (4) |
Conclusions
In this work we have quantified the mobility of carbon dioxide and water molecules in gas hydrates using classical molecular dynamics simulations. The effects of very slight changes in composition and structure were significant on the mobility of carbon dioxide molecules. Introducing few water vacancy defects and a 3% change in cage occupancy changed the diffusion coefficient by almost two orders of magnitude and a factor of four, respectively. The diffusion coefficient of the water molecules was also influenced but to a much lesser extent. These findings are essential when understating the discrepancies in reported results in the literature. Future applications of gas hydrates and crystallization studies need to consider the significant effect of structural and compositional variations in gas hydrate properties.Conflicts of interest
There are no conflicts of interest to declare.Acknowledgements
A. D. R and P. S. are grateful for a New Directions grant from the ACS-Petroleum Research Fund. A. D. R. is grateful for financial support from McGill University through the James McGill Professorship appointment. The authors are also thankful to Calcul Québec for use of their HPC resources.Notes and references
- C. Giavarini and K. Hester, Gas Hydrates: Immense Energy Potential and Environmental Challenges, Springer, London, 2011 Search PubMed.
- K. A. Kvenvolden, Rev. Geophys., 1993, 31, 173–187 CrossRef.
- S.-M. Lu, Renewable Sustainable Energy Rev., 2015, 41, 884–900 CrossRef.
- J. C. Stevens, J. J. Howard, B. A. Baldwin, G. Ersland, J. Husebo and A. Graue, Experimental Hydrate Formation and Gas Production Scenarios Based on CO2 Sequestration, Proceedings of the 6th International Conference on Gas Hydrates, Vancouver, B. C., Canada, 2008 Search PubMed.
- Y. Park, D.-Y. Kim, J.-W. Lee, D.-G. Huh, K.-P. Park, J. Lee and H. Lee, Proc. Natl. Acad. Sci. U. S. A., 2006, 103, 12690–12694 CrossRef CAS PubMed.
- E. D. Sloan, Nature, 2003, 426, 353–359 CrossRef CAS PubMed.
- T. M. Kirschgen, M. D. Zeidler, B. Geil and F. Fujara, Phys. Chem. Chem. Phys., 2003, 5, 5247–5252 RSC.
- S. Takeya, T. Hondoh and T. Uchida, Ann. N. Y. Acad. Sci., 2000, 912, 973–982 CrossRef CAS.
- V. Buch, J. P. Devlin, I. A. Monreal, B. Jagoda-CWiklik, N. Uras-Aytemiz and L. Cwiklik, Phys. Chem. Chem. Phys., 2009, 11, 10245–10265 RSC.
- S. Alavi and J. A. Ripmeester, J. Chem. Phys., 2012, 137, 054712 CrossRef PubMed.
- I. L. Moudrakovski, K. A. Udachin, S. Alavi, C. I. Ratcliffe and J. A. Ripmeester, J. Chem. Phys., 2015, 142, 074705 CrossRef PubMed.
- S. Alavi, K. Udachin and J. A. Ripmeester, Chem. – Eur. J., 2010, 16, 1017–1025 CrossRef CAS PubMed.
- R. Susilo, S. Alavi, I. L. Moudrakovski, P. Englezos and J. A. Ripmeester, ChemPhysChem, 2009, 10, 824–829 CrossRef CAS PubMed.
- A. Demurov, R. Radhakrishnan and B. L. Trout, J. Chem. Phys., 2002, 116, 702–709 CrossRef CAS.
- B. Peters, N. E. Zimmermann, G. T. Beckham, J. W. Tester and B. L. Trout, J. Am. Chem. Soc., 2008, 130, 17342–17350 CrossRef CAS PubMed.
- A. Falenty, G. Genov, T. C. Hansen, W. F. Kuhs and A. N. Salamatin, J. Phys. Chem. C, 2011, 115, 4022–4032 CAS.
- H. Lo, M.-T. Lee and S.-T. Lin, J. Phys. Chem. C, 2017, 121, 8280–8289 CAS.
- G. Roman-Perez, M. Moaied, J. M. Soler and F. Yndurain, Phys. Rev. Lett., 2010, 105, 145901 CrossRef PubMed.
- A. Vidal-Vidal, M. Perez-Rodriguez and M. M. Pineiro, RSC Adv., 2016, 6, 1966–1972 RSC.
- S. Liang and P. G. Kusalik, J. Am. Chem. Soc., 2011, 133, 1870–1876 CrossRef CAS PubMed.
- W. F. Kuhs, D. K. Staykova and A. N. Salamatin, J. Phys. Chem. B, 2006, 110, 13283–13295 CrossRef CAS PubMed.
- S. Alavi and J. A. Ripmeester, Angew. Chem., 2007, 119, 6214–6217 CrossRef.
- T. T. Trinh, M. H. Waage, T. S. van Erp and S. Kjelstrup, Phys. Chem. Chem. Phys., 2015, 17, 13808–13812 RSC.
- H. Cao, N. J. English and J. M. D. MacElroy, J. Chem. Phys., 2013, 138, 094507 CrossRef PubMed.
- T. J. Frankcombe and G. J. Kroes, J. Phys. Chem. C, 2007, 111, 13044–13052 CAS.
- P. D. Gorman, N. J. English and J. M. D. MacElroy, J. Chem. Phys., 2012, 136, 044506 CrossRef PubMed.
- D. Saha and S. Deng, Langmuir, 2010, 26, 8414–8418 CrossRef CAS PubMed.
- S. Liang, D. Liang, N. Wu, L. Yi and G. Hu, J. Phys. Chem. C, 2016, 120, 16298–16304 CAS.
- Z. M. Jendi, A. D. Rey and P. Servio, Mol. Simul., 2015, 41, 572–579 CrossRef CAS.
- Z. M. Jendi, P. Servio and A. D. Rey, Cryst. Growth Des., 2015, 15, 5301–5309 CAS.
- Z. M. Jendi, P. Servio and A. D. Rey, Phys. Chem. Chem. Phys., 2016, 18, 10320–10328 RSC.
- T. M. Vlasic, P. Servio and A. D. Rey, AIP Adv., 2016, 6, 085317 CrossRef.
- F. Takeuchi, M. Hiratsuka, R. Ohmura, S. Alavi, A. K. Sum and K. Yasuoka, J. Chem. Phys., 2013, 138, 124504 CrossRef PubMed.
- A. N. Salamatin, A. Falenty, T. C. Hansen and W. F. Kuhs, Energy Fuels, 2015, 29, 5681–5691 CrossRef CAS.
- S. Plimpton, J. Comput. Phys., 1995, 117, 1–19 CrossRef CAS , http://lammps.sandia.gov.
- D. G. Truhlar, B. C. Garrett and S. J. Klippenstein, J. Phys. Chem., 1996, 100, 12771–12800 CrossRef CAS.
- T. C. McDermott, T. Akter, J. D. MacElroy, D. A. Mooney, M. T. McCann and D. P. Dowling, Langmuir, 2011, 28, 506–516 CrossRef PubMed.
- W. S. Fyfe, F. J. Turner and J. Verhoogen, Mem. - Geol. Soc. Am., 1958, 73, 1–251 CAS.
Footnote |
| † Electronic supplementary information (ESI) available. See DOI: 10.1039/c7me00041c |
| This journal is © The Royal Society of Chemistry 2017 |

