Molecular engineering of functionalized crown ether resins for the isotopic enrichment of gadolinium: from computer to column chromatography†
A.
Boda
,
A. K.
Singha Deb
,
Sk. M.
Ali
 *,
K. T.
Shenoy
and
S.
Mohan
Chemical Engineering Division, Chemical Engineering Group, Bhabha Atomic Research Centre, Mumbai, India. E-mail: musharaf@barc.gov.in
First published on 18th October 2017
Abstract
Density functional theoretical modelling was performed to design and screen suitable macrocyclic crown ether functionalized resins for the isotopic enrichment of gadolinium. Theoretical calculations predict the complexation stability order of Gd3+ ion as follows: di-cylohexano-18-crown-6 (DCH18C6) > dibenzo-18-crown-6 (DB18C6) > benzo-15-crown-5 (B15C5), which was experimentally verified. The calculated isotopic separation factor value was shown to be the highest for DB18C6. From the theoretical analysis of both the stability and isotopic separation factor, DB18C6 is predicted to be the most promising candidate for isotopic separation of gadolinium. Hence, DB18C6 was functionalized with chloromethylated polystyrene (CMPS) resin. Subsequently, CMPS-grafted DB18C6 resin was synthesized and characterized. Furthermore, isotopic enrichment of gadolinium was carried out by performing column chromatographic experiments using CMPS-DB18C6 resin. The absorption capacity of the novel CMPS-DB18C6 resin for gadolinium was found to be 1 mg g−1. The separation coefficient, ε × 103, was found to be 6.3, 8.9, 3.4, and 9.7 for Gd-155/158, Gd-156/158, Gd-157/158, and Gd-155/160 isotopic pairs, respectively, and thus hold promise for future isotopic enrichment technology.
Design, System, ApplicationQuantum electronic structure theory based computational methods are becoming increasingly central to understanding the fractionation of stable isotopes in various chemical exchange systems. Development of suitable adsorbents for the separation of isotopes by means of experiment alone is a very difficult task which can be made a little easier by predicting the enrichment factor for the elements of interest employing computational theory. The separation factor α for the isotopic exchange reaction is evaluated by the reduced partition function ratio which needs the harmonic vibrational frequency of the system of interest. Therefore, in the present study a strategy has been conceived for the isotope separation of gadolinium which is of three folds. First, a computational modelling strategy has been envisaged to design a crown ether based functionalized polymeric resin for isotope separation of gadolinium followed by the synthesis of the designed resin and characterization and finally, testing of the synthesized resins for gadolinium isotope separation by performing column chromatography experiments. The work presented in this report holds promise for the future isotopic enrichment technology for gadolinium using column chromatography. The enriched gadolium isotope is of immense useful as the neutron poison in the nuclear reactor. |
Introduction
There is a renewed global interest in nuclear power generation around the world, which offers some important advantages compared to other sources of electricity. During operation of a nuclear reactor, the amount of fuel present in the core continually decreases. For long periods of operation time, fuel in excess of that needed for exact criticality must be added during the construction of the reactor. The positive reactivity that builds up out of excess fuel must be balanced with negative reactivity by using efficient neutron-absorbing compounds. Compounds of boron or gadolinium are generally used as burnable poisons either in separate lattice pins or plates, or introduced as additives to the fuel. Because of their uniform distribution as compared to control rods, boron- or gadolinium-based poisons are less disruptive to the core power distribution.Naturally occurring gadolinium consists of 7 stable isotopes: 152Gd, 154Gd, 155Gd, 156Gd, 157Gd, 158Gd, and 160Gd; their abundance ratios are 0.20, 2.18, 14.80, 20.47, 15.65, 24.84, and 21.86 at%, respectively.1 Gadolinium exhibits the highest cross section for the capture of thermal neutrons of any element, which is mainly due to the highest ever cross section of Gd-157 (254![[thin space (1/6-em)]](https://www.rsc.org/images/entities/char_2009.gif) 000 barn) and Gd-155 (60
000 barn) and Gd-155 (60![[thin space (1/6-em)]](https://www.rsc.org/images/entities/char_2009.gif) 900 barn). All the remaining isotopes have lower values: Gd-152 (735 barn), Gd-154 (85 barn), Gd-156 (18 barn), Gd-158 (2.2 barn), and Gd-160 (1.4 barn). At present, natural gadolinium is used as a burnable poison in nuclear fuel, but the use of Gd-155/157 would create even more effective burnable poison2 due to their high neutron cross section and will thus reduce the core inventory. Apart from the use of Gd-155 and Gd-157 as a neutron poison, Gd-152, which is a precursor for the production of radioactive Gd-153, is widely used for osteoporosis research and bone density measurements.
900 barn). All the remaining isotopes have lower values: Gd-152 (735 barn), Gd-154 (85 barn), Gd-156 (18 barn), Gd-158 (2.2 barn), and Gd-160 (1.4 barn). At present, natural gadolinium is used as a burnable poison in nuclear fuel, but the use of Gd-155/157 would create even more effective burnable poison2 due to their high neutron cross section and will thus reduce the core inventory. Apart from the use of Gd-155 and Gd-157 as a neutron poison, Gd-152, which is a precursor for the production of radioactive Gd-153, is widely used for osteoporosis research and bone density measurements.
There are numerous methods for the preparation and production of isotopes of interest at desired isotopic concentrations. Among various available methods, three methods being commonly practiced for the production of stable isotopes are: distillation,3,4 centrifuge-based enrichment,5,6 and electromagnetic enrichment7–11 (using a calutron). Distillation-based enrichment methods only work effectively when there is a large relative mass difference between the different isotopes of an element. Therefore, this method is used for the isotopes of lighter elements, such as He, Li, B, and C, which are typically separated through distillation or diffusion enrichment techniques. The isotopes of elements that are too heavy to be separated through distillation are enriched using centrifuge-based methods. Furthermore, an appropriate gaseous compound of the element is essential but it may not always be available, and thus, there are limitations to this method. Although electromagnetic-based enrichment will sufficiently separate the isotopes of nearly all elements, it is very expensive for large quantity production, as it has an extremely low throughput, but it can allow very high purities to be achieved. This method is often used for the processing of small amounts of pure isotopes for research or specific use, but is impractical for industrial use. The electromagnetic-based calutron is used for the production of isotopes of Pd, Sr, Ca, and the lanthanides. Other methods such as laser enrichment, photochemical enrichment, and plasma separation are also being studied and tested for feasibility. Although significant separation has been observed using the laser isotope method, it is not widely used because enrichment by laser would be highly expensive for commercial production of isotopes.
Another important isotope separation process is the chemical exchange method. Because chemical exchange isotope separation methods typically display small separation coefficients, a very long time is required to produce isotopes of a desired concentration. Nevertheless, separation of isotopes by ion exchange chromatography is considered to be one of the most effective chemical exchange methods, which is based on the chemical equilibrium between isotopic species distributed between the stationary resin phase and the mobile solution phase. Chemical exchange techniques have been practiced quite successfully for the separation of isotopes of various elements using metal ion ligand exchange systems, namely: Li,12 Ce,13 Zn,14,15 Eu,16,17 Cu,18,19 Gd,20–22 V,23 and Nd.24,25 Ion exchange is considered to be one of the processes based on chemical exchange in the equilibrium state and a highly promising technique for the separation of various isotopes.
Macrocyclic polyethers (crown ethers) and aminopolyethers (cryptands) have found widespread application in different fields of separation science and technology since their introduction through the work of Pederson26 and Lehn.27 One of their most remarkable properties is the capability to complex metal cations based on their cavity size. During complexation, the vibrational energy levels of the cation are affected. In the resultant cage, the cation is fixed but able to vibrate. The nature of these bonds and their combined effect in a macrocyclic ether produce a large number of vibrational degrees of freedom that should therefore be suitable for the detection of isotopic effects. This cavity-fitting selectivity can also be exploited for isotope separation by means of chemical reactions with cyclic polyether and bi-cyclic amino polyethers.26–29 In order to accomplish an efficient isotopic fractionation for the enrichment of isotopes, different isotopic distribution must take place between two phases, which then can be easily separated. Most of the macrocyclic crown ethers are soluble in various solvents.29 These compounds can also be functionalized as anchor groups on organic or inorganic matrices.30 Therefore, a heterogeneous exchange reaction for metal ions in liquid–liquid as well as liquid–solid molecular systems can be performed for a required level of enrichment for the isotopes of interest.
The separation of metal ion isotopes using macrocyclic crown ethers was first demonstrated by Jepson and Dewitt in 1976 using dibenzo-18-crown-6 and dicyclohexyl-18-crown-6 compounds.31 After a gap of ten years since the original Pederson discovery of the unusual binding ability of the crown ethers towards metal cations,26 it was shown that crown ethers were also quite effective for the separation of calcium isotopes. An imperative conclusion was the comprehension that all the crown ether and cryptand ligands demonstrate some degree of isotopic recognition, albeit small in most cases. Later, Heumann32 comprehensively reviewed most of the literature on the isotopic separation of various metal ions using crown ethers and cryptand compounds.
Since very high isotopic separation was realized in ion exchange equilibrium with crown ethers and cryptands, interest has recently been shown for these isotopic enrichment systems. Hence, crown ethers are being tested as a highly promising isotopic enrichment agent from a mixture of different isotopes having a very small difference in size.
The application of computational chemistry-based molecular engineering is rapidly growing with the continuing development of computer power, new and robust algorithms, and the availability of fast software. Today, molecular modelling can sometimes provide useful determination of the properties and behaviour of materials even before they have been synthesized, as well as useful estimations of the parameters and behaviour needed for traditional chemical engineering process development and design.33 From an experimental point of view, choosing a suitable solvent/extractant from a myriad of solvents and extractants is a very time-consuming and tedious affair. It will be of tremendous help if the screening of the experiment is done beforehand by means of other easy and less time-consuming techniques for the prediction of this parameter. Development of suitable adsorbents for the separation of isotopes by means of experiment alone is a very difficult task that can be made easier by employing computational theory to predict the enrichment factor for the elements of interest. In order to achieve that goal, molecular modelling studies have previously been performed for solvent extraction and isotope separations.34–38 Therefore, in the present study, a strategy has been conceived for the isotopic separation of gadolinium consisting of three parts. First, a computational modelling strategy has been envisaged to design a crown ether based on functionalized polymeric resin for the isotopic separation of gadolinium followed by the synthesis of the designed resin and characterization, and finally, testing of the synthesized resins for gadolinium isotope separation by performing column chromatography experiments.
Computational modelling
The isotope effect is a quantum mechanical phenomenon, and hence, to examine the isotope effect of gadolinium, it is necessary to use the methods of molecular modelling based on quantum mechanics.Computational protocol
All the geometries of the free crown ethers as well as their complexes with Gd3+ ion were optimized using the Turbomole39 software package at the BP86/SVP level of theory.40 Single point energy calculations were carried out on the optimized complexes at the B3LYP/TZVP41,42 level of theory. The octet spin state was used for the Gd3+ ion. MOLDEN43 molecular graphics software was used for the initial coordinates generation, which was used as an input for the calculation. The same software was used for the data analysis of the final output and final geometry and for the IR spectrum.The complexation energies are calculated for the complexation of gadolinium metal ions (Gd3+) with ligands (L) as given below:
| Gd3+ − (H2O)9 + L → Gd3+ − L + 9H2O | (1) |
The complexation energy, ΔE, is defined by the following general relation:
| ΔE = (EGd3+−L + 9EH2O) − (EGd3+−(H2O)9 + EL) | (2) |
All the Hessian calculations were done at a temperature of 298.15 K and pressure of 1 atm. The value of R is taken as 8.314 J mol−1 K−1. The free energy of complexation was then evaluated using the earlier standard reported methodology.44 The solvent phase effect in the energy was accounted by employing a conductor-like screening model (COSMO).45 The dielectric constants of 80 and 34.81 were used for water and nitrobenzene, respectively. The default COSMO radii were used for all the elements.
Theory
Isotopic effects in chemical exchange reactions are mainly quantum mechanical effects and hence cannot be explained by classical statistical mechanics. Theory-based quantum electronic structure computational methods are becoming increasingly central to understanding the fractionation of stable isotopes in various chemical exchange systems. The possibility of calculating equilibrium constants for isotopic exchange reactions from spectroscopic data alone was first pointed out by Urey and Rittenberg.46The isotopic exchange reaction for gadolinium metal ions (Gd3+) between aqueous and complex phase is expressed as:
| zGd3+aq. + z+ΔmGd3+compl ↔ z+ΔmGd3+aq. + zGd3+compl | (3) |
Here, z = atomic mass, solv denotes solvation by solvent, and compl denotes complexation by the organic ligand. The separation factor α for the isotopic exchange reaction (eqn (3)) can be written in terms of the reduced partition function ratio (fr) as47
| α = frGd3+aq./frGd3+compl | (4) |
| fr = Zvibz+ΔmGd3+Πi(hνiz+ΔmGd3+/kBT)/ZvibzGd3+Πi(hνizGd3+/kBT) | (5) |
Here, Z = vibrational partition function, ν = vibrational frequency, and h = Planck constant. kB is the Boltzmann constant, and T is the temperature. The main input required for the evaluation of the reduced partition function ratio and hence for the estimation of the separation factor is the harmonic vibrational frequency of the hydrated Gd3+ ion and Gd3+–crown ether complex.
COSMOtherm48 software was used for the calculation of solubility and partition coefficients of various neutral ligands in the water–organic bi-phasic system.
Experimental
Reagents and instruments
Dibenzo-18-crown-6 (DB18C6, >98%), benzo-15-crown-5 (B15C5, >98%), dicyclohexyl-18-crown-6 (DCH18C6, >98%), chloromethylated polystyrene resin (CMPS), and palladium on activated carbon (Pd/C, 10%) were supplied by Sigma-Aldrich. Hydrazine hydrate, nitric acid, acetic acid, chloroform, sodium carbonate, magnesium sulphate, methanol, ethanol, N,N′-dimethylformamide (DMF), and all other chemicals were reagent grade and purchased from S D Fine Chem Limited. All the chemicals were used as purchased without further purification.The grafting of the resin was monitored by Fourier transform infra-red spectroscopy (FTIR, ABB-MB-3000, spectral range between 500 cm−1 and 4000 cm−1 with 4 cm−1 resolution), nuclear magnetic resonance (13C-NMR, Bruker Avance 500, frequency 500 MHz, chemical shifts (δC) are quoted in parts per million (ppm) downfield from trimethylsilane (TMS), and coupling constants (J) are quoted in Hertz (Hz)), spectroscopy, and thermogravimetric analysis (TGA, Netzsch-STA 449-Jupiter F3). The structure and morphology of the grafted resin were analysed by scanning electron microscopy (SEM, Camscan MV2300CT/100) and X-ray diffraction (XRD, Philips 1729).
Synthesis of designed CMPS-DB18C6 resin
The reaction scheme for the preparation of functionalized CMPS-DB81C6 resin is presented in Fig. 1.First, a nitro derivative of DB18C6 was prepared by refluxing DB18C6 using nitric acid/acetic acid in chloroform medium followed by amination using Pd/C (10%) in hydrazine hydrate, following a reported procedure.49 The aminated crown ether was functionalized in CMPS resin using a condensation reaction of methyl chloride resin and amine (crown).50
Separation of gadolinium isotopes using solvent extraction
0.05 M GdCl3 solution was prepared and then diluted to 0.03 M GdCl3 using 0.01 M HCl, which was then used as feed. The organic phase was 0.1 M solution of B15C5, DB18C6, and DCH18C6 in nitrobenzene. 5 mL of each were mixed and then stirred for 1 hour in a magnetic stirrer and then were allowed to stand for 1 day. The supernatant solution was used for the concentration measurement. The concentration of the ions was measured using an inductively coupled plasma mass spectrometer (ICP-MS) developed by technical physics division (TPD), Bhabha Atomic Research Centre (BARC). The isotopic analysis was carried out using a thermal ionization mass spectrometer (TIMS) developed by TPD, BARC.The distribution coefficient (Kd) of metal ion, between organic and aqueous solution, is determined using the following equation:
 | (6) |
Results and discussion
Molecular engineering
Structural and vibrational IR spectrum. Most of the isotopic fractionation of the elements takes place from the aqueous feed solution to the exchanger site. Therefore, it is of primary importance to understand the solvation/hydration sphere structure of the metal ion of interest. In this context, the structure of the system under study has to be considered first. The nona-hydrated structure of the Gd3+ ion has been reported earlier using EXAFS.51 Hence, we have optimized the nona-hydrated structure of gadolinium metal ion (Gd3+(H2O)9), which is displayed in Fig. 2(a).
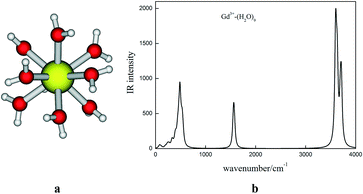 | ||
| Fig. 2 (a) Optimized geometry of nona-hydrated Gd3+(H2O)9 and (b) the calculated IR spectra of Gd3+(H2O)9. | ||
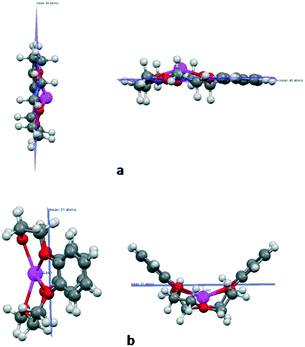
The calculated Gd–O distance (2.49 Å) is well matched with the EXAFS data (2.39 Å).51 The corresponding IR frequency with atomic mass of Gd of 157 amu is also presented in Fig. 1. Five crown ethers, namely B15C5, DB15C5, B18C6, DB18C6, and DCH18C6, were used in the complexation studies of the Gd3+ ion. In the case of B15C5, DB18C6, and DCH18C6, we have taken the most stable conformers from the results of our earlier study, where the conformational search was performed.36,52 In the case of DB15C5, we have added one more phenyl group to the most stable B15C5, and hence, no conformational search was done. For B18C6, we have also taken the geometry from our earlier study and reoptimized it.38 The optimized structures of B15C5 and DB15C5 and their complexes with Gd3+ ion are given in Fig. 3.
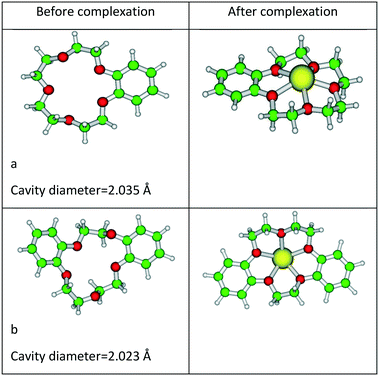 | ||
| Fig. 3 Optimized structures of (a) B15C5, (b) DB15C5, and their complexes with Gd3+ ion optimized at the BP/SVP level of theory. | ||
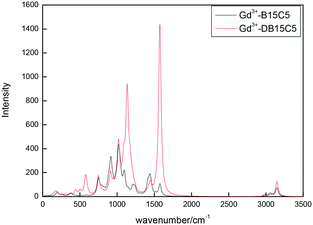
As discussed earlier, the vibrational IR frequency is the central quantity for the determination of the separation factor, and hence, the IR frequency of the B15C5 and DB15C5 Gd3+ ion complexes is plotted in Fig. 4.
Next, the optimized structures of B18C6, DB18C6, and DCH18C6 and their complexes with Gd3+ ion are displayed in Fig. 5.
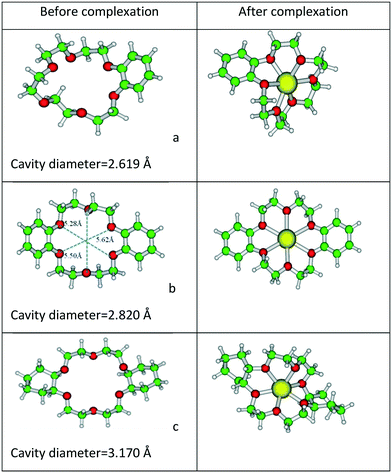 | ||
| Fig. 5 Optimized structures of (a) B18C6, (b) DB18C6, (c) DCH18C6, and their complexes with Gd3+ ion at the BP/SVP level of theory. | ||
The reported ionic radii of Gd3+ ion is 2.16 Å. From the structural parameters, it was found that the metal ion oxygen bond distance is smaller in the case of B15C5 (2.368 Å) as compared to B18C6 (2.465 Å), DB15C5 (2.387 Å), DCH18C6 (2.402 Å), and DB18C6 (2.625 Å). Furthermore, the position of the Gd3+ ion with respect to the mean plane is also displayed in Fig. 6.
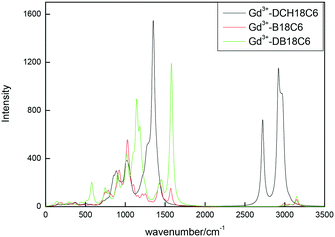
The calculated IR frequency of Gd3+ ion complexes of B18C6, DB18C6, and DCH18C6 is plotted in Fig. 7.
Complexation energy and Gibbs free energy in solution. The calculated values of complexation energy (ΔE) and Gibbs free energy (ΔG) of the Gd3+ ion with different crown ethers can be used as preliminary screening criteria for choosing a suitable candidate to be used for either solvent extraction or chromatographic experiments as an isotopic exchange agent. The calculated values of binding energy (ΔE) and free energy (ΔG) of Gd3+ in the solvent phase are given in Table 1. The calculated binding energy and free energy show the same order of DCH18C6 > B18C6 > DB18C6 > B15C5 > DB15C5. The calculated solution-phase Gibbs free energy fails to capture the trend of the experimental distribution constant obtained by performing solvent extraction experiments (see the Experimental section), where the experimental results show the order DCH18C6 > B15C5 > DB18C6. Furthermore, from both the calculations as well as the experimental results, DCH18C6 was found to have more free energy of extraction and a greater distribution constant among the studied crown ethers. The difference in the value of ΔE between B15C5 and DB15C5, or B18C6 and DB18C6 is due to the addition of an extra phenyl moiety either in B15C5 or B18C6. The same observation was reported earlier for Cs+ and Sr2+ metal ions towards B18C6 and DB18C6.53 Due to the electron withdrawing effect of the phenyl group, the effective charge of the donor atoms on the cavity of the crown ether is reduced, which in turn, results in reduced interaction with dibenzo crown ether compared to mono benzo crown ether.
Bonding analysis. In order to obtain further molecular insights into the nature of bonding of Gd3+ ion with crown ethers, natural population analysis (NPA)54 was carried out for the various chemical species. The residual charge (partial atomic charge) calculated by performing NPA on the crown ether complexes of Gd ion was found to be lowest with DCH18C6 and highest with DB15C5 (Table 2), indicating higher complexation stability with DCH18C6 and lowest with DB15C5; the same is also reflected in the calculated values of the Gibbs free energy. The smaller residual charge on Gd3+ ion in the complex indicates that additional charge has been transferred to the ligand, which thus leads to stronger interaction, and in turn, higher stability. The ionic nature of the complexation was also established from the residual charge on the metal ions. The augmentation of the electronic population in the s, d, and f orbitals of the metal ions after complexation indicates the covalent nature of bonding.
| Description | Charge | s | p | d | f |
|---|---|---|---|---|---|
| Gd3+–(H2O)9 | 1.889 | 4.38 | 11.99 | 10.71 | 7.016 |
| B15C5 | 2.305 | 4.33 | 11.98 | 10.35 | 7.018 |
| DB15C5 | 2.314 | 4.33 | 11.98 | 10.34 | 7.018 |
| B18C6 | 2.204 | 4.36 | 11.99 | 10.41 | 7.018 |
| DB18C6 | 2.227 | 4.35 | 11.99 | 10.40 | 7.019 |
| DCH18C6 | 2.121 | 4.35 | 11.99 | 10.51 | 7.022 |
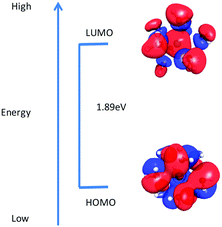
Molecular descriptors. Next, in order to obtain better insights into molecular level interaction, the LUMO–HOMO energy gap of crown ethers and hydrated metal ion was calculated, and values are given in Table 3. The distribution of HOMO and LUMO orbitals of hydrated Gd3+–(H2O)9 in an aqueous environment and crown ethers in nitrobenzene is displayed in Fig. 8 and 9. From the figure, it is seen that the distribution of HOMO and LUMO orbitals of hydrated Gd3+–(H2O)9 in an aqueous environment and crown ethers in nitrobenzene are quite different, which in turn leads to different values for the LUMO–HOMO gap as well as dissimilar complexation energy.
| Complex of Gd3+ | E HUMO | E LUMO | E LUMO–HOMO | χ | η | ΔN |
|---|---|---|---|---|---|---|
| (H2O)9 | −9.80 | −7.90 | 1.89 | 8.85 | 0.94 | |
| B15C5 | −5.80 | −0.22 | 5.58 | 3.01 | 2.79 | 0.78 |
| DB15C5 | −5.86 | −0.40 | 5.45 | 3.13 | 2.72 | 0.89 |
| B18C6 | −5.76 | −0.18 | 5.57 | 2.97 | 2.78 | 0.78 |
| DB18C6 | −5.79 | −0.20 | 5.58 | 3.00 | 2.79 | 0.78 |
| DCH18C6 | −6.38 | 0.88 | 7.26 | 2.75 | 3.63 | 0.88 |
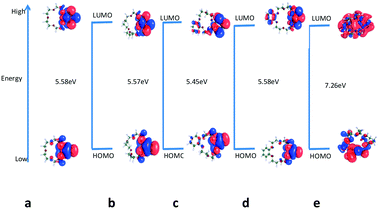 | ||
| Fig. 9 Calculated LUMO–HOMO gap of (a) B15C5, (b) B18C6, (c) DB15C5, (d) DB18C6, and (e) DCH18C6 in nitrobenzene. | ||
The amount of charge transfer is expressed in the following equation:  , where χ and η denote absolute electronegativity and hardness, respectively; M and L represent the expression of metal ion and ligand, respectively. The charge transfer was determined for the metal ion–ligand acceptor donor interaction, and the calculated values are given in Table 3. It is worth noting that the calculated large ion-ligand free energy (ΔG) can be qualitatively correlated with the higher amount of charge transfer, ΔN, of the crown ethers as follows: DCH18CH > B18C6 > DB18C6 > B15C5 except DB15C5. DB15C5 displays the highest ΔN but the lowest free energy (ΔG).
To gain further insights into the nature of bonding, the distribution of HOMO and LUMO orbitals in complexes of Gd with different crown ethers in nitrobenzene is displayed in Fig. 10. From the figure, it is seen that the distributions of HOMO and LUMO orbitals of Gd complexes in nitrobenzene are dissimilar, and hence, their LUMO–HOMO gaps are different. The participation of Gd f orbitals is manifested in the distribution of LUMO and HOMO orbitals. For all cases, the same iso-surface value of 0.011 (e bohr−3) has been used.
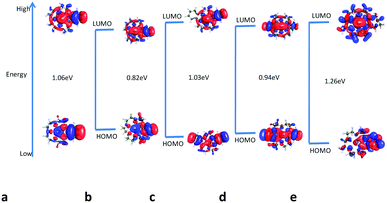 | ||
| Fig. 10 The calculated LUMO–HOMO gap of complexes of Gd3+ with (a) B15C5, (b) B18C6, (c) DB15C5, (d) DB18C6, and (e) DCH18C6 in nitrobenzene. | ||
Reduced partition function ratio (RPFR) and isotope separation factor. It is described in eqn (5) that in order to compute the isotope separation factor of any element in a bi-phasic system, we need to know the value of the RPFR for a pair of isotopes in the feed phase (aqueous solution) and the product phase (metal–ligand complex). The isotope effect can be clearly seen from the shift in vibrational frequencies between two isotopes (155/160 and 157/160) of Gd (ESI). The reduced partition function ratio for a particular pair of isotopes is determined using the vibrational IR frequency of the complexes of Gd3+ ion with crown ethers and employing eqn (5). The RPFR of the Gd (155/160) pair was found to be higher than that of Gd (157/160) in all the studied complexes, as shown in Table 4. The reduced partition function ratio (RPFR) and isotope separation factor (α) for the hydrated Gd3+ ion and complexes of Gd3+ with B15C5, DB15C5, B18C6, DB18C6, and DCH18C6 were determined. In the case of DOWEX resin, the calculated separation factors were found to be 1.00089 and 1.000485 for isotopic pairs of Gd (155/160) and Gd (157/160), respectively, which qualitatively follows the reported experimental values of 1.000064 and 1.000040, respectively.20 The separation factor for Gd (155/160) is higher compared to Gd (157/160) due to larger mass difference (Δm) in the case of Gd (155/160). Among benzo-substituted crown ethers, the highest RPFR was found for B15C5 and lowest RPFR was found for DB18C6 for the pair of 155/160 and 157/160 isotopes, leading to lowest separation factor for B15C5 and highest for DB18C6. This can be qualitatively explained as follows. Higher complexation energy indicates that the complex is strongly bound and hence imparts rigidity to the system, leading to a smaller RPFR as observed with DB18C6 (ΔG = 21.40 kcal mol−1), whereas smaller complexation energy indicates that the complex is loosely bound, and hence there is more flexibility to the system, which leads to a higher RPFR as observed with B15C5 (ΔG = −21.25 kcal mol−1). The calculated RPFR for B18C6 was expected to be smaller than DB18C6, as the complexation energy was found to be higher with B18C6 over DB18C6. This can be further correlated with the cavity size of the crown ether. With increasing cavity size of the crown ether, the RPFR was found to be decreased, leading to a high value for the isotope separation factor as observed with B15C5 (cavity size = 2.03 Å) and DB18C6 (cavity size = 2.82 Å). From the higher complexation energy for B18C6 over DB18C6, it is expected to have a smaller RPFR over DB18C6, whereas from the cavity size, DB18C6 is expected to have a higher RPFR over B18C6. It is observed that both complexation energy and cavity size play a role in the determination of the RPFR. Furthermore, in the case of DCH18C6, although the complexation energy is shown to be the highest and the cavity size is the largest, the RPFR is higher than that for DB18C6, leading to a smaller separation factor than that for DB18C6, which might be due to the presence of a cyclohexyl group in DCH18C6. The presence of a cyclohexyl group has resulted in a smaller difference ((Δ155–157% = (ϑ155i − ϑ157i)/ϑ155i) × 100) of vibrational frequencies for different isotopes of gadolinium in Gd–DCH18C6 compared to the Gd–DB18C6 complex, and hence, shows a smaller separation factor (see the ESI†).
| Complex | RPFR(f) | α 155/160 = faq/fcomp | α 157/160 = faq/fcomp | |
|---|---|---|---|---|
| Gd155/160 | Gd157/160 | |||
| Gd–9w | 1.0024 | 1.0014 | ||
| EDTA–Gd3+ | 1.00151 | 1.000914 | 1.00089 (1.000064) | 1.000485 (1.000040) |
| DCH18C6–Gd3+ | 1.001890 | 1.001083 | 1.000509 | 1.000317 |
| B18C6–Gd3+ | 1.00179 | 1.00104 | 1.000608 | 1.000359 |
| DB18C6–Gd3+ | 1.000647 | 1.000391 | 1.001752 | 1.001009 |
| B15C5–Gd3+ | 1.002016 | 1.001213 | 1.000383 | 1.000187 |
| DB15C5–Gd3+ | 1.00176 | 1.001051 | 1.000638 | 1.000348 |
| CMPS–DB18C6 | 1.001191 | 1.000712 | 1.0012 | 1.00068 |
The results show that the separation factor for DB18C6 is higher when compared to B15C5, DB15C5, B18C6, and DCH18C6. With its comparatively higher separation factor, DB18C6 is considered to be the most promising ligand for isotopic enrichment of gadolinium. However, in order to obtain a considerable amount of enriched isotopes, the crown ether ligand should be grafted on a solid matrix, and then the isotopic separation can be carried out in column chromatography mode. The predictability of the computational protocol was validated using the reported results for commercially available DOWEX resin with EDTA as the complexing/enrichment agent. Furthermore, the calculated separation factor for the 152/160 pair for Gd3+–DCH18C6 (α = 1.0012) was found to be in good agreement with the reported experimental results (α = 1.002)22 and thus confirms the acceptability of the present methods for computation of the RPFR and separation factor.
Solubility and partition coefficients of crown ethers. In order to confirm whether crown ethers can be used for isotopic separation using the solvent extraction technique, the partition coefficients of crown ethers in the aqueous-nitrobenzene bi-phasic system were determined using COSMO-RS formalism as reported in the literature.45,48,55 From the calculated values, it is noted that DB18C6 displays the highest isotope separation factor for gadolinium and shows the lowest partition. Furthermore, the solubility of crown ethers in water was determined using COSMO-RS formalism as implemented with the COSMOtherm package. The calculated values of solubility are presented in Table 5. The highest aqueous solubility was observed for DB18C6, which is the most optimal screened material for isotopic separation. The loss of DB18C6 in the water phase was due to solubility and can be minimized. Additionally, the disadvantage of a small partition coefficient can be overcome by functionalization of DB18C6 with a solid matrix such as a polymer, and then enrichment of gadolinium isotopes can be carried out using functionalized resin in a chromatography column in a repeated cycle.
| System | Solubility (gm cc−1) | log![[thin space (1/6-em)]](https://www.rsc.org/images/entities/char_2009.gif) P P |
|---|---|---|
| B15C5 | 5.8 × 10⁻⁵ | 2.27 |
| DB15C5 | 4.2 × 10⁻⁷ | 4.87 |
| B18C6 | 4.0 × 10⁻⁵ | 1.87 |
| DB18C6 | 1.4 × 10⁻³ | 0.21 |
| DCH18C6 | 4.2 × 10⁻⁷ | 2.60 |
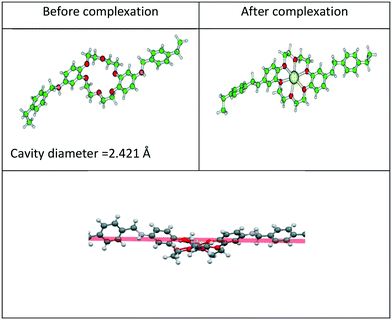 | ||
| Fig. 11 Optimized structures of DB18C6 grafted to CMPS with Gd3+ ion optimized at the BP/SVP level of theory and position of the ion with respect to the mean plane. | ||
In order to study the effect of CMPS resin functionalization on the structure of DB18C6, the cavity size of DB18C6 was evaluated. The cavity of the crown ether has been considerably reduced (2.421 Å) from the free DB18C6 (2.820 Å) after functionalization with CMPS resin, which perhaps resulted in a higher Gibbs free energy of complexation. Furthermore, from the figure, it is seen that the Gd3+ ion is located at the centre of the cavity of the CMPS-DB18C6 moiety in a highly symmetric fashion. The average Gd–O bond distance in the case of CMPS-DB18C6 was found to be 2.521 Å, which is shorter than that observed with DB18C6 (2.625 Å), and thus, it experiences a larger interaction. Another interesting point to be noted is that in the case of complex of Gd3+ with DB18C6, the two benzene rings were highly non-planar, whereas with functionalized CMPS-DB18C6, the non-planarity of benzene rings has been drastically reduced.
The effect of functionalization on energy was examined by determining the adsorption energy (ΔE) and free energy (ΔG) of Gd3+ ion with CMPS-DB18C6 resin in the aqueous phase. The calculated values of zero point energy-corrected adsorption energy (ΔE) and free energy (ΔG) of Gd3+ ion with CMPS-DB18C6 resin in the aqueous phase are presented in Table 6. The free energy of adsorption with functionalized CMPS-DB18C6 resin was found to be higher than that of DB18C6. This might be due to the reduced LUMO–HOMO energy gap (4.74 eV) for the CMPS-DB18C6 resin compared to DB18C6 (5.58 eV). The distribution of LUMO–HOMO orbitals for the CMPS-DB18C6 resin and its complex with Gd3+ is displayed in Fig. 12. Furthermore, the smaller residual charge on the Gd atom in the complex of CMPS-DB18C6 compared to that of DB18C6 also supports the higher free energy. The higher amount of charge transfer, ΔN, also confirms the higher Gibbs adsorption free energy for the CMPS-DB18C6 resin over DB18C6.
| Description | ΔE | ΔG | ΔS* | Charge | ΔN |
|---|---|---|---|---|---|
| CMPS-DB18C6 | 25.52 | −43.59 | 0.247 | 2.191 | 0.896 |
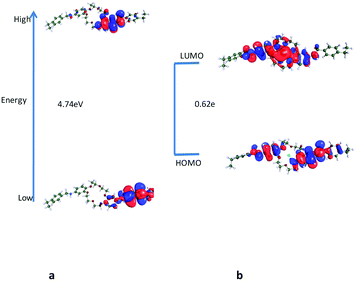 | ||
| Fig. 12 Calculated LUMO–HOMO gap of (a) CMPS-DB18C6 and (b) its complex of Gd3+ ion in an aqueous environment. | ||
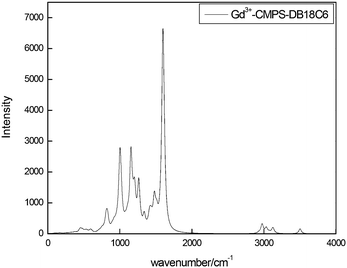
Next, the reduced partition function ratio (RPFR) and isotope separation factor (α) for hydrated Gd3+ ion and complexes of Gd3+ with CMPS-DB18C6 resin were determined using the vibrational IR spectrum. The calculated vibrational IR spectrum for the Gd3+–CMPS-DB18C6 resin is plotted in Fig. 13, whereas the calculated value of the RPFR and α are presented in Table 4. The value of the RPFR increased compared to that of the Gd3+–DB18C6 complex, which resulted in a slight decrease in the separation factor compared to DB18C6. However, the calculated separation factor for the CMPS-DB18C6 resin was higher than that of the other crown ethers.
Experimental results
Characterization
The FTIR spectrum of DADB18C6, CMPS resin, and CMPS-DB18C6 resin are shown in Fig. S1 (ESI†), and the characteristic vibrational frequencies in the grafted resin are tabulated in Table 7. The introduction of a crown ether group on the resin is understood from the disappearance of the methylchloride (–CH2Cl) peak at 758 cm−1 of the CMPS resin and the appearance of amine and crown ether peaks.| Group | IR peaks (cm−1) |
|---|---|
| –CH2Cl | Absent (758) |
| –NH | 3078, 3093 |
| –CH2– | 2861, 1473 |
| C–O–C | 1134 |
The 13C NMR spectrum of CMPS and CMPS-DB18C6 resin are shown in Fig. S2 (ESI†), and the interpretation of the individual chemical shift values are depicted in Table 8. The grafting of the DB18C6 on the CMPS resin can be seen from the C–N bond, C(aromatic)–O, and C(aliphatic)–O chemical shift values in the CMPS-DB18C6 resin.
| Compound | Chemical shift (ppm) | Assignments |
|---|---|---|
| CMPS | 48 | CH2Cl |
| 128 | Protonated aromatic carbon | |
| 149 | Quarternary aromatic carbon | |
| DB18C6 functionalized CMPS | 32 | CH2 |
| 38 | CH | |
| 42 | C–NH | |
| 48 | CH2Cl | |
| 66 | C(aliphatic)–O | |
| 128 | Protonated aromatic carbon | |
| 149 | Quarternary aromatic carbon | |
| 165 | C(aromatic)–O |
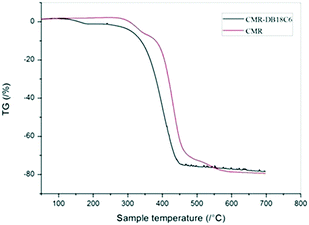
The TGA curves of CMPS and CMPS-DB18C6 resin are shown in Fig. 14. The lower decomposition temperature of CMPS-DB18C6 resin compared to CMPS resin indicates the surface anchoring of DB18C8.
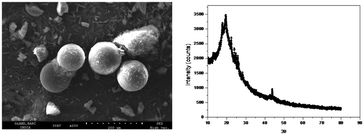
The SEM images of CMPS and CMPS-DB18C6 are shown in Fig. 15. The morphological change in the surface of the resin beads is clear from the images. The broad peak centered at the 2θ value of approximately 20°, observed in the XRD pattern of CMPS-DB18C6 resin (Fig. 15), is characteristic of the polystyrene–divinylbenzene cross-linked resin.56
The IR and NMR spectra are presented in the ESI.†
Separation of gadolinium isotopes using solvent extraction
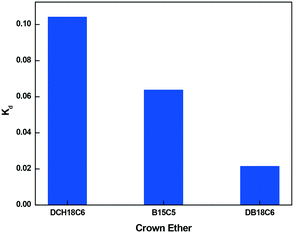
The distribution constants of Gd ion with different crown ethers in the aqueous nitrobenzene bi-phasic system were estimated by performing solvent extraction experiments, and the results are displayed in Fig. 16. From Fig. 16, it is found that the Kd value of Gd3+ follows the order DCH18C6 > B15C5 > DB18C6. From the density functional theoretical calculations, DCH18C6 showed the highest complexation free energy, which further validates the computational results. Therefore, the present study thus validates the importance of computational study that can be used to elucidate the underlying mechanism for the metal ion complexation (based only on the theoretical route) and thus contribute to the design and screening of suitable ligands using computations. Although quantum mechanics calculations show that DB18C6 exhibits positive free energy, the experiments illustrate a reverse picture. The separation factor with DB18C6 was found to be higher compared to B15C5, DCH18C6, and also EDTA, which demonstrates that the use of DB18C6 will be promising for future studies. Therefore, based on these findings, DB18C6 grafted onto CMPS resin was synthesized in our laboratory and used for isotopic separation.Distribution coefficient using a grafted resin with the batch method
The distribution coefficient (Kd) was evaluated using the batch method. Each portion of 0.1 gram of dry (regenerated) resin (CMPS-grafted DB18C6) was accurately weighed and then transferred to a 50 ml polypropylene bottle. Then, 10 ml of Gd(NO3)3 solution of varying concentrations (100 ppm to 200 ppm) was added. The solutions were subjected to manual shaking at regular intervals for 30 min and stored overnight. The concentration of Gd ion in the supernatant solutions was determined using ICP-MS.The distribution coefficient (Kd) of metal ion, between the resin and solution phase, was determined using the following equation:
 | (7) |
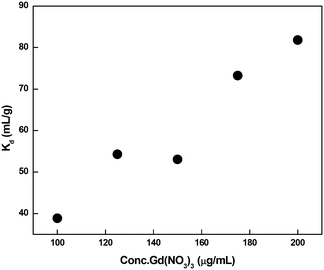
The Kd values are plotted in Fig. 17, which indicates that there is an increase in the Kd value with increasing concentration of metal ion in the solution.
Separation of gadolinium isotopes using column chromatography
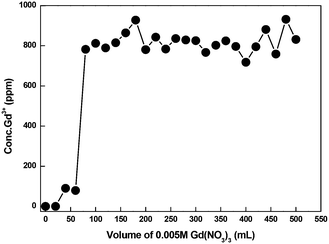
A breakthrough experiment was conducted in a 6 mm diameter and 1 m length column with CMPS-grafted DB18C6 resin for Gd3+ ion using 0.005 M Gd(NO3)3 solution. The pH of the solution was adjusted with NH4OH to 6.50. The loaded Gd3+ was further eluted using 0.5 M HCl solution. The breakthrough curve is displayed in Fig. 18. The breakthrough experiment showed that the absorption capacity for Gd3+ in CMPS-DAB18C6 is approximately 1 mg gm−1 of resin. Furthermore, the breakthrough curve indicates that the leakage of Gd3+ begins after reaching a volume of approximately 25.0 ml.Furthermore, an isotope separation study was conducted by connecting two columns that were 6 mm in diameter and 1 m in length with CMPS-grafted DB18C6 resin for Gd3+ ion using 0.005 M Gd(NO3)3 solution. The pH of the solution was adjusted with NH4OH to 6.50. Excess Gd3+ was continuously passed to test the feasibility of the isotope exchange. Samples were collected after each 20.0 ml using an automatic fraction collector (Buchi, Switzerland). The concentration of the samples was analyzed using ICP-MS, and isotopic analysis of last few samples was carried out using TIMS. The loaded Gd was further eluted using 0.5 M HCl. The breakthrough curve is displayed in Fig. 19. The estimated values of isotope composition are presented in Tables 9 and 10.
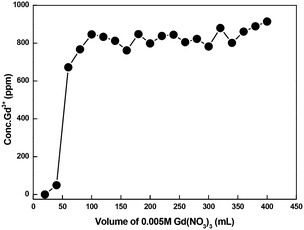 | ||
| Fig. 19 Breakthrough curve using CMPS-grafted DB18C6 resin in two 1 meter columns connected in a series for Gd3+ ion using 0.005 M Gd(NO3)3. | ||
| Sample | Gd-155/158 | Gd-156/158 | Gd-157/158 | Gd-158/160 |
|---|---|---|---|---|
| Natural | 0.59742 ± 0.04% | 0.82546 ± 0.04% | 0.63212 ± 0.05% | 1.13564 ± 0.05% |
| B1 | 0.59940 ± 0.03% | 0.82740 ± 0.02% | 0.63410 ± 0.02% | 1.13090 ± 0.01% |
| B2 | 0.59670 ± 0.01% | 0.82480 ± 0.01% | 0.63220 ± 0.02% | 1.13030 ± 0.01% |
| B3 | 0.59831 ± 0.03% | 0.82585 ± 0.01% | 0.63236 ± 0.01% | 1.13143 ± 0.01% |
| B4 | 0.59766 ± 0.03% | 0.82594 ± 0.02% | 0.61782 ± 0.02% | 1.12946 ± 0.03% |
| Sample | Gd-155/158 | Gd-156/158 | Gd-157/158 | Gd-158/160 |
|---|---|---|---|---|
| E1 | 0.59721 ± 0.09% | 0.82499 ± 0.06% | 0.63169 ± 0.1% | 1.131028 ± 0.05% |
| E2 | 0.60181 ± 0.002% | 0.82941 ± 0.2% | 0.61518 ± 0.1% | 1.13949 ± 0.5% |
| E3 | 0.59510 ± 0.015% | 0.82283 ± 0.025% | 0.63114 ± 0.026% | 1.12962 ± 0.023% |
| E4 | 0.60102 ± 0.02% | 0.82710 ± 0.1% | 0.63639 ± 0.1% | 1.12939 ± 0.04% |
The single stage separation factor value, α = 1 + ε, for each Gd isotope can be estimated by the following expression:
 | (8) |
The separation coefficient, ε, was calculated using the isotopic enrichment curves of the front and rear boundaries according to the equation developed by Spedding et al.57 and Kakihana and Kanzaki:58
 | (9) |
The measured Gd isotopic ratios of samples collected in this breakthrough operation are presented in Table 9. The symbols B1, B2, B3, and B4 represent the different volume fraction during the breakthrough operation. From Table 9, it is observed that the heavier isotope, i.e., Gd-160, is enriched in volume fractions, which indicates that the frontal zone is enriched with heavier isotope compared to natural gadolinium. From the isotopic values in Table 9, the isotope separation coefficient was calculated. The separation coefficient, ε × 103, was found to be 6.3, 8.9, 3.4, and 9.7 for Gd-155/158, Gd-156/158, Gd-157/158, and Gd-155/160, respectively.
Next, the measured Gd isotopic ratios of samples collected by eluting with HCl are presented in Table 10, where E1, E2, E3, and E4 represent the selected eluted volumes. From Table 10, it is observed that lighter isotope, i.e., Gd-155, is enriched in the collected fractions, which indicates that the rare zone is enriched with lighter isotope. It should be noted that from E1 to E4, the concentration of Gd-155 increased compared to natural gadolinium.
From the isotopic ratio measurements, it was observed that slight isotopic separation may be taking place in the bed. Because the absorption capacity is low, more material is needed for the achievement of higher separation.
Conclusions
A molecular system was designed and screened using density functional theory followed by synthesis and characterization, and then experimental studies were performed for the development of isotopic enrichment technology for Gd using CMPS-grafted DB18C6 crown ether resin with column chromatography. From the density functional theoretical calculations, it was observed that the complexation of Gd3+ follows the order DCH18C6 > B15C5 > DB18C6, whereas in the solvent extraction experiment, the order is DCH18C6 > DB18C6 > B15C5. The calculated isotopic separation factor values show that DB18C6 is the most promising candidate for isotopic separation, which was then functionalized to CMPS resin. The absorption capacity of the resin for Gd3+ was found to be 1 mg g−1. The separation coefficient, ε × 103, was found to be 6.3, 8.9, 3.4, and 9.7 for Gd-155/158, Gd-156/158, Gd-157/158, and Gd-155/160 isotopic pairs, respectively, and thus holds promise for future isotopic enrichment technology for gadolinium using column chromatography. Work in this direction is in progress in our computational and experimental laboratories.Conflicts of interest
There are no conflicts to declare.Acknowledgements
The computer division of BARC is acknowledge for providing use of the Anupam supercomputer facility.References
- M. Berglund and M. E. Wieser, Pure Appl. Chem., 2009, 83, 397–410 Search PubMed.
- V. F. Sears, Thermal-neutron scattering lengths and cross sections for condensed-matter research, Chalk River Nuclear Laboratories Chalk River, Ontario, 1984 Search PubMed.
- B. B. McInteer, Sep. Sci. Technol., 1980, 15, 491–508 CrossRef CAS.
- M. Abdollahi and S. J. Ahmadi, Chem. Eng. Process.: Process Intesif., 2014, 76, 26–32 CrossRef CAS.
- A. A. Artyukhov, A. P. Babichev, I. Y. Knyasev, Y. M. Kravets, A. V. Kurochkin, G. E. Popov, A. I. Rudnev and A. V. Tikhomirov, Nucl. Instrum. Methods Phys. Res., Sect. A, 1997, 401, 281–288 CrossRef CAS.
- L. J. Sosnin, I. A. Suvorov, A. N. Tcheltsov and A. I. Rudnev, Nucl. Instrum. Methods Phys. Res., Sect. A, 1993, 334, 41–42 CrossRef CAS.
- B. J. Egle, K. J. Hart and W. S. Aaron, J. Radioanal. Nucl. Chem., 2014, 299, 995–999 CrossRef CAS.
- J. G. Tracy, Nucl. Instrum. Methods Phys. Res., Sect. A, 1989, 282, 261–266 CrossRef.
- J. G. Tracy and W. S. Aaron, Nucl. Instrum. Methods Phys. Res., Sect. A, 1993, 334, 45–50 CrossRef CAS.
- J. G. Tracy, W. A. Bell, A. M. Veach, H. H. Caudill and H. T. Milton, Nucl. Instrum. Methods Phys. Res., Sect. B, 1987, 26, 7–11 CrossRef.
- C. P. Keim, Annu. Rev. Nucl. Sci., 1952, 1, 263–292 CrossRef CAS.
- Z. Hagiwara, J. Nucl. Sci. Technol., 1969, 6, 508–513 CrossRef CAS.
- Y. H. Zhang, S. Gunji, M. Nomura, Y. Fujii and T. Oi, J. Chromatogr. A, 2005, 1069, 133–139 CrossRef CAS PubMed.
- X. Ding, M. Nomura and Y. Fujii, Prog. Nucl. Energy, 2010, 52, 164–167 CrossRef.
- X. Ding, T. Suzuki, M. Nomura, H. J. Kim, Y. Sgiyama and Y. Fujii, J. Radioanal. Nucl. Chem., 2007, 273, 79–84 CrossRef CAS.
- I. Ismail, M. Nomura and Y. Fujii, Proceedings of the 1997 fall meeting of the atomic energy society of Japan, 1997 Search PubMed.
- I. M. Ismail, M. Nomura and Y. Fujii, J. Chromatogr. A, 1998, 808, 185–191 CrossRef CAS.
- I. Ismail, M. Matin, M. Nomura, S. Begum and Y. Fujii, J. Ion Exch., 2002, 13, 40–45 CrossRef CAS.
- M. D. Abdul Matin, I. M. Ismail, M. Nomura and Y. Fujii, Sep. Sci. Technol., 2002, 37, 2129–2142 CrossRef.
- I. M. Ismail, A. Fukami, M. Nomura and Y. Fujii, Anal. Chem., 2000, 72, 2841–2845 CrossRef CAS PubMed.
- J. Chen, M. Nomura, Y. Fujii, F. Kawakami and M. Okamoto, J. Nucl. Sci. Technol., 1992, 29, 1086–1092 CrossRef CAS.
- T. Fujii, T. Yamamoto, J. Inagawa, K. Gunji, K. Watanabe and K. Nishizawa, Solvent Extr. Ion Exch., 1999, 17, 1219–1229 CrossRef CAS.
- Y. H. Zhang, M. Nomura, M. Aida and Y. Fujii, J. Chromatogr. A, 2003, 989, 175–182 CrossRef CAS PubMed.
- I. Ismail, Arab J. Nucl. Sci. Appl., 2012, 45, 281–292 Search PubMed.
- I. Ismail, Arab J. Nucl. Sci. Appl., 2010, 43, 333–345 Search PubMed.
- C. J. Pedersen, J. Am. Chem. Soc., 1967, 89, 7017–7036 CrossRef CAS.
- J. M. Lehn and J. P. Sauvage, J. Am. Chem. Soc., 1975, 97, 6700–6707 CrossRef CAS.
- J. J. Christensen, D. J. Eatough and R. M. Izatt, Chem. Rev., 1974, 74, 351–384 CrossRef PubMed.
- F. Vagtle and E. Weber, Angew. Chem., 1974, 86, 727 CrossRef.
- T. G. Waddell and D. E. Leyden, J. Org. Chem., 1981, 46, 2406–2407 CrossRef CAS.
- B. E. Jepson and R. DeWitt, J. Inorg. Nucl. Chem., 1976, 38, 1175–1177 CrossRef CAS.
- K. G. Heumann, in Organic Chemistry, Springer, 1985, pp. 77–132 Search PubMed.
- Sk. M. Ali, A. Boda, A. K. S. Deb, P. Sahu and K. T. Shenoy, Frontiers in Computational Chemistry, 2017, vol. 3, p. 75 Search PubMed.
- A. Boda, S. K. Arora, A. K. Singha Deb, M. Jha, Sk. M. Ali and K. T. Shenoy, Sep. Sci. Technol., 2017, 52, 2300–2307 CrossRef CAS.
- A. Boda and S. M. Ali, J. Phys. Chem. A, 2012, 116, 8615–8623 CrossRef CAS PubMed.
- Sk. M. Ali, Comput. Theor. Chem., 2014, 1034, 38–52 CrossRef CAS.
- A. Boda, A. K. Singha Deb, S. M. Ali, K. T. Shenoy and S. K. Ghosh, AIP Conf. Proc., 2014, 1591, 1065 CrossRef CAS.
- A. K. Singha Deb, S. M. Ali, K. T. Shenoy and S. K. Ghosh, J. Chem. Eng. Data, 2014, 59, 2472–2484 CrossRef CAS.
- TurbomoleV6.3, A development of University of Karlsruhe and Forschungszentrum Karlsruhe GmbH (1989–2007) TURBOMOLE GmbH, since (2007), 2009 Search PubMed.
- A. D. Becke, Phys. Rev. A, 1988, 38, 3098 CrossRef CAS.
- A. D. Becke, J. Chem. Phys., 1993, 98, 1372–1377 CrossRef CAS.
- C. Lee, W. Yang and R. G. Parr, Phys. Rev. B, 1988, 37, 785 CrossRef CAS.
- G. Schaftenaar and J. H. Noordik, J. Comput.-Aided Mol. Des., 2000, 14, 123–134 CrossRef CAS PubMed.
- S. M. Ali, Eur. J. Inorg. Chem., 2014, 1533 CrossRef CAS; S. Pahan, A. Boda and S. M. Ali, Theor. Chem. Acc., 2015, 134, 41 CrossRef; S. M. Ali, S. Pahan, A. Bhattacharyya and P. K. Mohapatra, Phys. Chem. Chem. Phys., 2016, 18, 9816–9828 RSC.
- A. Klamt, J. Phys. Chem., 1995, 99, 2224–2235 CrossRef CAS; A. Klamt and G. Schuurmann, J. Chem. Soc., Perkin Trans. 1, 1993, 2, 799–805 RSC.
- H. C. Urey and D. Rittenberg, J. Chem. Phys., 1933, 1, 137–143 CrossRef CAS.
- J. Bigeleisen, J. Am. Chem. Soc., 1996, 118, 3676–3680 CrossRef CAS.
- F. Eckert and A. Klamt, COSMOtherm, version C2.1, Release01.08, COSMOlogic GmbH & Co, KG, Leverkusen, Germany, 2008 Search PubMed.
- K. H. Pannell, Wayne Yee, G. S. Lewandos and D. C. Hambrick, J. Am. Chem. Soc., 1977, 99(5), 1457–1461 CrossRef CAS.
- A. R. Reddy and K. H. Reddy, Indian J. Chem. Technol., 2002, 9, 97–102 CAS.
- I. Persson, P. D'Angelo, S. De Panfilis, M. Sandstram and L. Eriksson, Chem. – Eur. J., 2008, 14, 3056–3066 CrossRef CAS PubMed.
- S. De, A. Boda and S. M. Ali, J. Mol. Struct.: THEOCHEM, 2010, 941, 90–101 CrossRef CAS.
- A. Boda, Sk. M. Ali, M. R. K. Shenoi, H. Rao and S. K. Ghosh, J. Mol. Model., 2011, 17, 1091–1108 CrossRef CAS PubMed.
- A. E. Reed and F. Weinhold, J. Chem. Phys., 1983, 78, 4066–4073 CrossRef CAS; A. E. Reed, R. B. Weinstock and F. Weinhold, J. Chem. Phys., 1985, 83, 735–746 CrossRef.
- A. Boda, Sk. M. Ali and M. R. K. Shenoi, Fluid Phase Equilib., 2010, 288, 111 CrossRef CAS; A. Boda, Sk. M. Ali, M. R. K. Shenoi, H. Rao and S. K. Ghosh, J. Mol. Model., 2012, 38, 245–253 Search PubMed.
- J. W. Kim, K. J. Kim, S. Park, K. U. Jeong and M.-H. Lee, Bull. Korean Chem. Soc., 2012, 33, 2966–2970 CrossRef CAS.
- F. H. Spedding, T. E. Powell and H. J. Svec, J. Am. Chem. Soc., 1955, 77, 6125–6132 CrossRef CAS.
- H. Kakihana and T. Kanzaki, Bull. Tokyo Inst. Technol., 1969, 90, 77–89 Search PubMed.
Footnote |
| † Electronic supplementary information (ESI) available: Table S1: calculated values of energies, enthalpy, entropy, and Gibbs free energy of the chemical species; Table S2: optimized coordinates of the complexes; Fig. S1. IR spectrum of (a) DADB18C6, (b) CMPS resin, and (c) DB18C6 functionalized CMPS resin; Fig. S2. 13C NMR of (a) CMPS and (b) DB18C6 modified CMPS resin. See DOI: 10.1039/c7me00076f |
| This journal is © The Royal Society of Chemistry 2017 |


