Comparisons among Mg, Zn, Sr, and Si doped nano-hydroxyapatite/chitosan composites for load-bearing bone tissue engineering applications
Jiabing
Ran
,
Pei
Jiang
,
Guanglin
Sun
,
Zhe
Ma
,
Jingxiao
Hu
,
Xinyu
Shen
* and
Hua
Tong
*
Key Laboratory of Analytical Chemistry for Biology and Medicine, Ministry of Education, College of Chemistry and Molecular Sciences, Wuhan University, Wuhan, 430072, China. E-mail: shenxy@whu.edu.cn; sem@whu.edu.cn; Fax: +86 027 68752136; Tel: +86 027 68752136
First published on 7th December 2016
Abstract
In load-bearing bone tissue engineering (BTE), ionic doping is a promising strategy to make up for the inherent defects of hydroxyapatite (HAp). However, the influence of doped elements on the structures and properties of in vitro mineralized HAp has not been investigated in detail so far. In addition, no systematic investigations have been found comparing the properties of different kinds of element doped HAp-based organic/inorganic composites. In this work, the hydroxyapatite/chitosan composite (CS/HAp) and Mg, Zn, Sr, and Si doped hydroxyapatite/chitosan composites (Mg-CS/HAp, Zn-CS/HAp, Sr-CS/HAp, and Si-CS/HAp) were synthesized by using a facile in situ precipitation method. The impacts of different kinds of doped elements on the crystallinity, crystal morphology, and crystal structure of the mineralized HAp were carefully studied. In addition, we also investigated and compared the surface morphology, surface roughness, thermal stability, mechanical strength, and in vitro cytocompatibility of the five samples in detail. We anticipate that our work could shed new light on the influence of ionic doping on the mineralization of HAp and inspire researchers to prepare an HAp-based organic/inorganic composite load-bearing bone substitute in the future.
1. Introduction
Recently, composites comprised of organic matrices and bioactive/resorbable inorganic nano-fillers have been regarded as promising candidates for load-bearing BTE applications.1 As the basic composition of bone minerals, hydroxyapatite (HAp), has been extensively utilized as an inorganic nano-filler due to its excellent bioaffinity.2,3 However, stoichiometric HAp is considered to be osteoconductive but not osteoinductive.4 Besides, its use is limited because of its high in vivo solubility and poor mechanical strength.5 Fortunately, these defects could be made up for by ionic doping.6In fact, the actual Ca/P ratio of bone minerals varies between 1.37 and 1.87, indicating that living bone contains other elements (Sr, Mg, Zn, Si, Co, etc.).7 Even though the contents of these elements are low in living bone minerals, they are of great significance in mediating the crystalline structure and physico-chemical properties of HAp (e.g., crystallinity, particle morphology, lattice parameters, dissolution/resorption rates, densification, mechanical strength, and thermal stability).8–16 Significantly, the crystalline structures and physico-chemical properties of HAp also have some effects on its biological performance.17–19 For instance, a relatively rough surface morphology facilitates better interaction between cell-materials.20,21 And the mechanical strength of a material could influence cell behaviors (e.g., proliferation and migration) and mediate cell phenotypes.22,23
In daily metabolic activities including bone regeneration, these trace elements also show excellent biological performances. For instance, through activating alkaline phosphatase, Mg2+ can indirectly influence mineral metabolism.24,25 Commonly, Mg2+ deficiency restricts the growth of osteoblasts leading to a decrease in bone mass density.26 Besides, Mg also plays a key role in mediating cell–extracellular matrix interaction.27 By increasing the growth rate of osteoblasts, Zn2+ becomes capable of promoting new bone formation.28 In addition, Zn could also stimulate collagen production and inhibit osteoclast differentiation.29,30 It has been reported that Sr2+ could act as an inhibitor of resorption as well as a stimulus of osteoblast proliferation and bone formation.31–33 Also, researchers found that Sr2+ inhibits pre-osteoclast maturation and induces apoptosis in mature osteoclasts, and affects the signaling between osteocytes and both osteoblasts and osteoclasts.34,35 In particular, Sr-doped HAp has been extensively utilized as a bone substitute, as a delivery system for antibiotics and as an anticancer drug.36,37 In the process of bone and connective tissue formation, Si has been reported to be indispensable for the reason that it promotes the transformation of a material surface into a biologically equivalent apatite.38,39
To date, great efforts have been made to prepare trace element doped nano-apatite based bone substitutes. For instance, Bose et al. synthesized a novel Sr–Mg doped tricalcium phosphate (TCP) BTE scaffold by using a direct three-dimensional printing (3Dp) technology. Compared with a pure TCP scaffold, the Sr–Mg doped TCP scaffold accelerated mineralization in vivo and promoted the expression of osteocalcin and type I collagen.40 Ghorbani et al. synthesized a novel poly(ε-caprolactone)/chitosan/Zn-doped nano-hydroxyapatite composite scaffold by using an electrospinning method. This scaffold not only showed enhanced mechanical strength but also promoted the attachment and proliferation of human adipose derived stem cells.41 Vázquez et al. synthesized a porous 3D Si-doped hydroxyapatite/gelatin scaffold by using a rapid prototyping method. This hybrid scaffold is capable of promoting the differentiation of pre-osteoblastic MC3T3-E1 cells (matrix mineralization and gene expression).42
Though aforementioned scaffolds exhibit an excellent performance for BTE applications, the functions of each trace element are poorly understood. In particular, the influence of doped elements on the structures and properties of in vitro mineralized HAp has not been investigated in detail. In addition, no systematic investigations have been found comparing the structures and properties of different kinds of trace element doped HAp-based organic/inorganic composites. Thus, the first objective of this work was to figure out how each trace element affected the morphology and structure of nano-HAp crystals in an in vitro mineralization process. The second one was to compare the corresponding physico-chemical properties and biological performances of different kinds of element doped nano-HAp based organic/inorganic composites.
On the basis of our previous work,43–45 four types of trace element (Mg, Zn, Sr, and Si) doped nano-HAp/chitosan composites (Mg-CS/HAp, Zn-CS/HAp, Sr-CS/HAp, and Si-CS/HAp, correspondingly) were prepared by using a facile in situ precipitation method in this work.46 For comparison, a CS/HAp composite without any additives was also synthesized. In addition, we carefully investigated the crystallinity, crystalline structures, surface morphology, surface roughness, and thermal stability of these composites. In particular, the in vitro cytocompatibility of these composites was also carefully evaluated.
2. Experimental section
2.1. Materials
Chitosan (MW 1![[thin space (1/6-em)]](https://www.rsc.org/images/entities/char_2009.gif) 000
000![[thin space (1/6-em)]](https://www.rsc.org/images/entities/char_2009.gif) 000) was obtained from Golden-Shell Biochemical Co. (Zhejiang, China) with a 95% degree of deacetylation. Genipin was bought from Chengdu ConBon Bio-tech Co., Ltd (Chengdu, China). Calcium nitrate tetrahydrate (Ca(NO3)2·4H2O), diammonium hydrogen phosphate ((NH4)2HPO4), acetic acid, ammonia, ethyl silicate (Si(OC2H5)4), strontium nitrate (Sr(NO3)2), magnesium nitrate hexahydrate (Mg(NO3)2·6H2O), and zinc nitrate hexahydrate (Zn(NO3)2·6H2O) were purchased from Sinopharm Chemical Reagent Co., Ltd (Shanghai, China) and were of analytical grade. Deionized ultrapure water was used throughout the experiment. For the in vitro cell culture assay, MC3T3-E1 cells were generously supplied by the School of Stomatology, Wuhan University (Wuhan, China).
000) was obtained from Golden-Shell Biochemical Co. (Zhejiang, China) with a 95% degree of deacetylation. Genipin was bought from Chengdu ConBon Bio-tech Co., Ltd (Chengdu, China). Calcium nitrate tetrahydrate (Ca(NO3)2·4H2O), diammonium hydrogen phosphate ((NH4)2HPO4), acetic acid, ammonia, ethyl silicate (Si(OC2H5)4), strontium nitrate (Sr(NO3)2), magnesium nitrate hexahydrate (Mg(NO3)2·6H2O), and zinc nitrate hexahydrate (Zn(NO3)2·6H2O) were purchased from Sinopharm Chemical Reagent Co., Ltd (Shanghai, China) and were of analytical grade. Deionized ultrapure water was used throughout the experiment. For the in vitro cell culture assay, MC3T3-E1 cells were generously supplied by the School of Stomatology, Wuhan University (Wuhan, China).
2.2. Preparation of CS/HAp, Mg-CS/HAp, Zn-CS/HAp, Sr-CS/HAp, and Si-CS/HAp
Briefly, 0.48 g of chitosan was dissolved into 40 mL of acetic acid aqueous solution (2 vol%) at 45 °C for 30 min. Afterwards, 0.252 g (NH4)2HPO4 and 0.752 g of Ca(NO3)2·4H2O were successively added into the chitosan solution. Four replicates of this kind were made in all. After the salts were completely dissolved; 2.5 at% Mg, Zn, Sr, and Si (i.e., 0.0015 g (Mg(NO3)2·6H2O) for Mg-CS/HAp, 0.0017 g (Zn(NO3)2·6H2O) for Zn-CS/HAp, 0.0012 g (Sr(NO3)2) for Sr-CS/HAp, and 0.0012 g TEOS for Si-CS/HAp) were incorporated into the solutions, respectively. The solution without any additives is referred to as CS/HAp. Next, 0.048 g of genipin was dissolved into the resultant solutions. 20 minutes later, the solutions were taken out and placed in a constant-temperature oven (37 °C) for 12 h. Under these conditions, the solutions would turn into solidified hydrogels. Then, ammonia was poured onto the surface of the hydrogels and permeated from the top to the bottom. Simultaneously, in situ precipitation took place and elements doped in nano-HAp particles were homogeneously dispersed into the chitosan matrices.47 The ultimate hydrogels were rinsed with deionized water and air-dried for subsequent characterizations.2.3. Characterization
The crystal phase was investigated by performing wide angle X-ray diffraction analysis (XRD; X'pert PRO, Panalytical, Holland). The crystalline structures were investigated by using a field emission transmission electron microscope (FE-TEM) (JEM-2100, JEOL, Japan). The surface morphology was observed by using a field emission scanning electron microscope (FE-SEM) (Sigma, Zeiss, Germany). Energy dispersive X-ray spectroscopy (EDS) mapping (EDAX GENSIS, AMETEK, USA) was utilized to investigate the elemental distribution. The surface roughness was observed using an atomic force microscope (AFM; Multimode 8, Bruker, Germany).Thermal analysis was carried out by using thermogravimetric analysis (TGA) and differential thermal analysis (DTA) (Diamond TG/DTA, Perkin Elmer, America). Experiments were performed using simultaneous TGA-DTA by heating specimens at 10 °C min−1 in a temperature range between 20 °C and 600 °C in a nitrogen atmosphere.
Compression tests were performed using a universal testing machine (SHIMADZU, AGS-J, Japan). All samples were shaped into cylinders (5–7 mm in length, 5–7 mm in diameter). Specimens were compressed in a direction perpendicular to the cross section of the cylinders at a cross-head speed of 0.5 mm min−1. The elastic modulus was calculated as the slope of the initial linear portion of the stress–strain curve and expressed as the mean values of three replicates.
2.4. In vitro cell culture assay
Prior to cell seeding, all the specimens were cut into cylinders (14 mm in diameter and 5 mm in height) and fumigated in 75% ethanol steam for 3 days and then immersed in Phosphate Buffer Solution (PBS) for 24 hours at ambient temperature. Next, these membranes were sterilized under ultraviolet light for 30 min.
3. Results and discussion
3.1. X-ray diffraction (XRD)
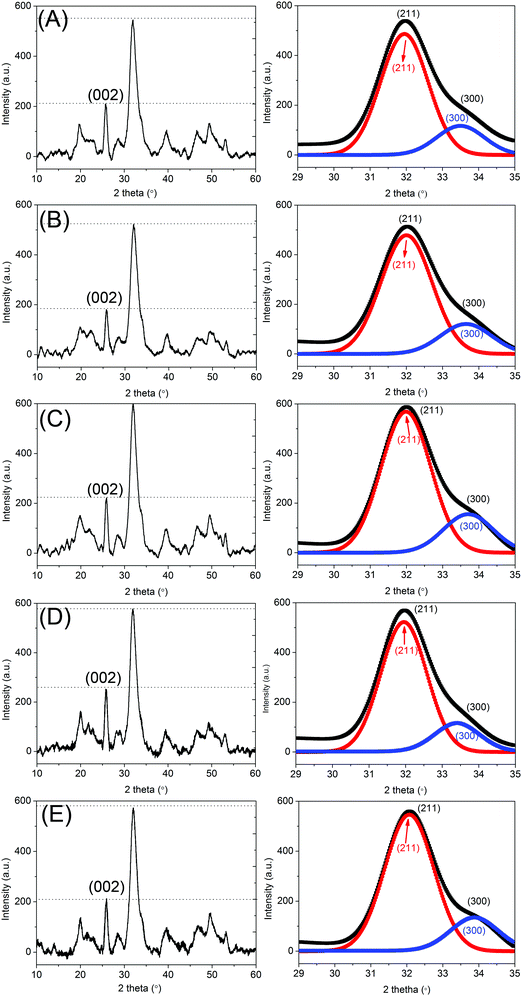
Fig. 1 exhibits the XRD spectra of CS/HAp, Mg-CS/HAp, Zn-CS/HAp, Sr-CS/HAp, and Si-CS/HAp. All the five specimens showed two intense diffraction peaks at 2θ 26° and 32°, which confirmed that the main crystal phase was HAp.1 In addition, the Scherrer equation was utilized to calculate the crystal sizes of HAp along the (002) and (300) crystal planes.2Dhkl = kλ/(βhkl![[thin space (1/6-em)]](https://www.rsc.org/images/entities/char_2009.gif) cos cos![[thin space (1/6-em)]](https://www.rsc.org/images/entities/char_2009.gif) θ) θ) |
The crystallographic parameters of HAp crystallites were also calculated by using the Bragg equation, and the formula for interplanar crystal spacing of the hexagonal crystal system is48
2d![[thin space (1/6-em)]](https://www.rsc.org/images/entities/char_2009.gif) sin sin![[thin space (1/6-em)]](https://www.rsc.org/images/entities/char_2009.gif) θ = nλ, 1/d2 = 4(h2 + hk + k2)/3a2 + l2/c2 θ = nλ, 1/d2 = 4(h2 + hk + k2)/3a2 + l2/c2 |
Because the (300) diffraction peak was shielded by the intense (211) diffraction peak, the peak fit method was applied to separate the overlapping (211) and (300) diffraction peaks. The images next to Fig. 1A–E exhibit the separated (211) and (300) diffraction peaks of CS/HAp, Mg-CS/HAp, Zn-CS/HAp, Sr-CS/HAp, and Si-CS/HAp, respectively. Table 1 lists the calculated crystal sizes and crystallographic parameters of HAp crystallites dispersed in the five specimens. Though the obtained data were not absolutely accurate, they could qualitatively describe the differences among different samples. The Scherrer sizes of HAp crystallites dispersed in the five specimens increased in the following order: Zn-CS/HAp < Mg-CS/HAp < Si-CS/HAp < Sr-CS/HAp < CS/HAp (along the (002) crystal plane); Mg-CS/HAp < Sr-CS/HAp < CS/HAp = Zn-CS/HAp < Si-CS/HAp (along the (300) crystal plane). Briefly, Mg and Sr restrained the growth of HAp crystallites along both the a-axis and the c-axis. Si facilitated the preferred oriented growth of the HAp crystallite along the a-axis while restraining its growth along the c-axis. Zn had no influence on the growth of HAp crystallites along the a-axis but restrained their growth along the c-axis. Through calculation, we also found that the aspect ratios of HAp crystallites dispersed in the five samples increased in the following order: Zn-CS/HAp < Si-CS/HAp < CS/HAp < Mg-CS/HAp < Sr-CS/HAp.
| Samples | β 002 (°) | 2θ002 (°) | D 002 (nm) | β 300 (°) | 2θ300 (°) | D 300 (nm) | a (nm) | c (nm) | D 002/D300 |
|---|---|---|---|---|---|---|---|---|---|
| CS/HAp | 0.4392 | 25.9367 | 18.36 | 0.6557 | 32.9336 | 12.50 | 0.9419 | 0.6868 | 2.01 |
| Mg-CS/HAp | 0.5009 | 25.9095 | 16.10 | 0.7553 | 32.9624 | 10.85 | 0.9408 | 0.6874 | 2.03 |
| Zn-CS/HAp | 0.6238 | 25.9210 | 12.93 | 0.6559 | 32.9343 | 12.50 | 0.9419 | 0.6872 | 1.42 |
| Sr-CS/HAp | 0.4479 | 25.8764 | 18.00 | 0.7253 | 32.8544 | 11.30 | 0.9440 | 0.6884 | 2.18 |
| Si-CS/HAp | 0.4953 | 25.8929 | 16.28 | 0.5828 | 32.9233 | 14.06 | 0.9422 | 0.6880 | 1.59 |
3.2. Transmission electron microscopy (TEM)
Fig. 2 demonstrates the TEM images of CS/HAp, Mg-CS/HAp, Zn-CS/HAp, Sr-CS/HAp, and Si-CS/HAp. The two insets in each image exhibit the selected area electron diffraction (SAED) image and the high-resolution TEM (HRTEM) image of the corresponding sample. From the SAED images and HRTEM images it can be concluded that the particles which are dispersed in the five specimens are all HAp. In addition, it was discovered that the HAp particles dispersed in Zn-CS/HAp and Si-CS/HAp presented obvious rod-like structures while those dispersed in CS/HAp, Sr-CS/HAp, and Mg-CS/HAp showed anomalous structures. Presumably, HAp crystallites mainly grew along the a-axis and the c-axis in the presence of Zn and Si. In addition, HAp particles dispersed in Zn-CS/HAp and Si-CS/HAp showed higher uniformity than those dispersed in CS/HAp, Mg-CS/HAp, and Sr-CS/HAp. Besides, the particle sizes of the mineralized HAp crystals were also mediated by these elements. The differences in the particle sizes of the HAp crystals dispersed in different specimens could be summarized as follows: Sr-CS/HAp > Zn-CS/HAp > Si-CS/HAp > Mg-CS/HAp.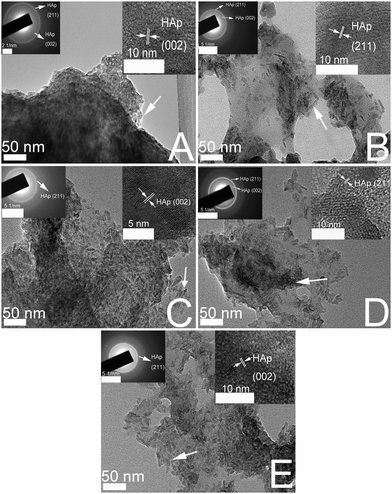 | ||
| Fig. 2 TEM images of (A) CS/HAp, (B) Mg-CS/HAp, (C) Zn-CS/HAp, (D) Sr-CS/HAp, and (E) Si-CS/HAp; the two insets in each image exhibit the SAED image and the HRTEM image of the corresponding sample. | ||
3.3. Scanning electron microscopy (SEM) and energy-dispersive spectroscopy (EDS)
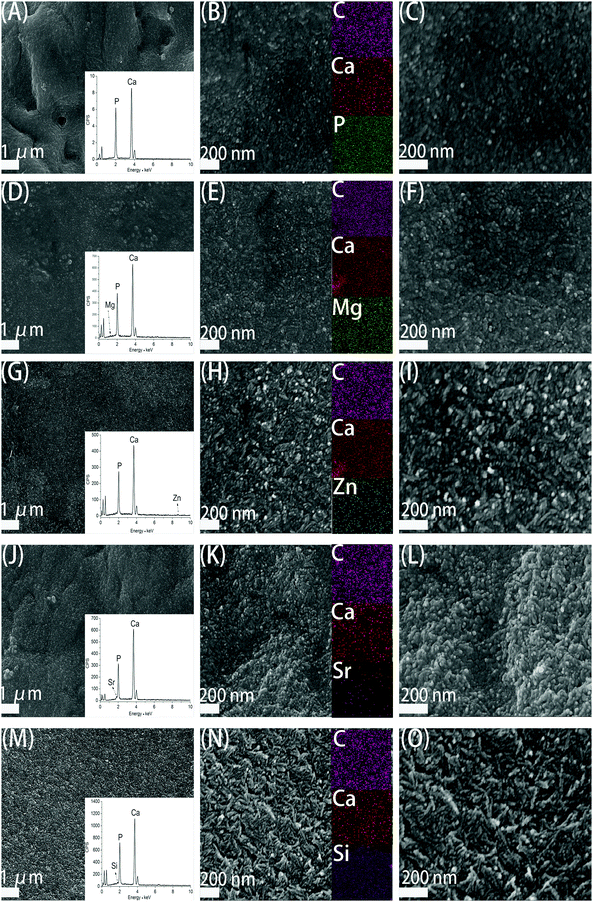
Fig. 3 demonstrates the SEM images of CS/HAp, Mg-CS/HAp, Zn-CS/HAp, Sr-CS/HAp, and Si-CS/HAp. The insets in (A), (D), (G), (J), and (M) exhibit the EDS area analysis curves of CS/HAp, Mg-CS/HAp, Zn-CS/HAp, Sr-CS/HAp, and Si-CS/HAp, respectively. Even though the contents of Mg, Zn, Sr, and Si were low in these composites, they were successfully detected which confirmed that these elements had been successfully incorporated into the composites. The insets in (B), (E), (H), (K), and (N) showed the EDS mapping images of CS/HAp, Mg-CS/HAp, Zn-CS/HAp, Sr-CS/HAp, and Si-CS/HAp, respectively. It could be concluded that Mg, Zn, Sr, and Si were homogeneously dispersed in Mg-CS/HAp, Zn-CS/HAp, Sr-CS/HAp, and Si-CS/HAp, respectively.Under low-magnification (the left part), it could be found that the inorganic phases of the five specimens were all homogeneously dispersed in the organic matrices. And no obvious boundaries were observed between the organic phases and the inorganic phases. However, under high-magnification (the middle part and right part), the surface morphology differed among different specimens. Obviously, compared with CS/HAp, Mg-CS/HAp, and Sr-CS/HAp, Zn-CS/HAp and Si-CS/HAp showed a more rough surface morphology. And short rod-like particles, which were composed of finer particles, were found on the surfaces of Zn-CS/HAp and Si-CS/HAp while spherical particles were observed on the surfaces of CS/HAp, Mg-CS/HAp, and Sr-CS/HAp. In addition, the inorganic particles dispersed in Zn-CS/HAp demonstrated poorer regularity than those dispersed in the other four samples.
3.4. Atomic force microscopy (AFM)
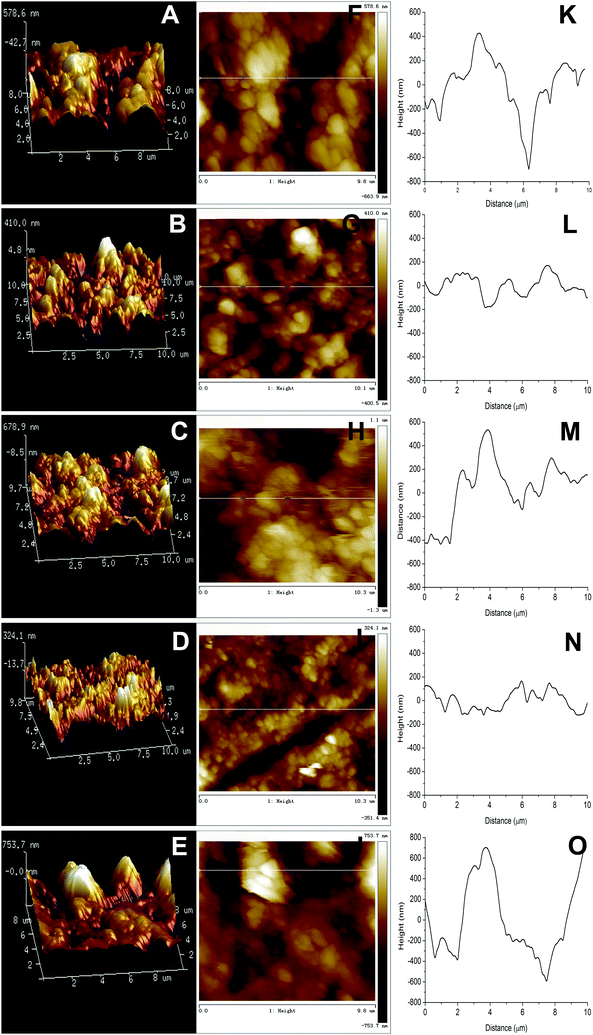
Fig. 4A–E exhibits the AFM 3 dimensional (3D) images of CS/HAp, Mg-CS/HAp, Zn-CS/HAp, Sr-CS/HAp, and Si-CS/HAp, respectively. As for CS/HAp, a number of surface protuberances with a threshold amplitude of 578.6 nm were observed. Interestingly, when Mg or Sr was incorporated into the composite, the maximum altitudes of the surface protuberances were reduced to 410 nm and 324.1 nm, respectively. Zn and Si seemed to increase the surface roughness of the composites, and the threshold amplitudes of the surface protuberances of Zn-CS/HAp and Si-CS/HAp were increased to 678.9 nm and 753.7 nm, respectively. Fig. 4F–J exhibits the AFM topographic images of CS/HAp, Mg-CS/HAp, Zn-CS/HAp, Sr-CS/HAp, and Si-CS/HAp, respectively. Fig. 3K–O demonstrates the line profiles along the lines in Fig. 4F, G, H, I and J, respectively. Briefly, the differences in surface roughness among the five specimens could be summarized as follows: Si-CS/HAp > Zn-CS/HAp > CS/HAp > Mg-CS/HAp > Sr-CS/HAp. This conclusion was consistent with the observations of the SEM images (Fig. 3).3.5. Thermogravimetric analysis (TGA) and differential thermal analysis (DTA)
In this part, TGA and DTA were applied to investigate the thermal stability and thermal behaviors of CS/HAp, Mg-CS/HAp, Zn-CS/HAp, Sr-CS/HAp, and Si-CS/HAp. Fig. 5 shows the DTA profiles of the five specimens. In the first range (50–70 °C), all five samples demonstrated endothermic slope curves, which were associated with the evaporation of adsorbed and bound water. The second thermal event also registered in all specimens was slope exothermic curves (280–300 °C), which indicated the degradation of the main chain and deacetylation of the chitosan molecules.49,50 Briefly, subtle differences were found among the five specimens. However, all the samples exhibited other exothermic peaks in the range of 330–500 °C (i.e., 345.33 °C for CS/HAp, 364.01 °C for Mg-CS/HAp, 339.44 °C for Zn-CS/HAp, 408.00 °C for Sr-CS/HAp, and 492.00 °C for Si-CS/HAp). From the viewpoint of Qin, these exothermic peaks were due to further decomposition of the degraded fragments and slow oxidation of the char.51 Obviously, the interactions between the organic phases and the inorganic phases of the five specimens were also mediated by these doped elements. The thermal stability of the five samples could be summarized as follows: Si-CS/HAp > CS/HAp > Zn-CS/HAp > Mg-CS/HAp > Sr-CS/HAp.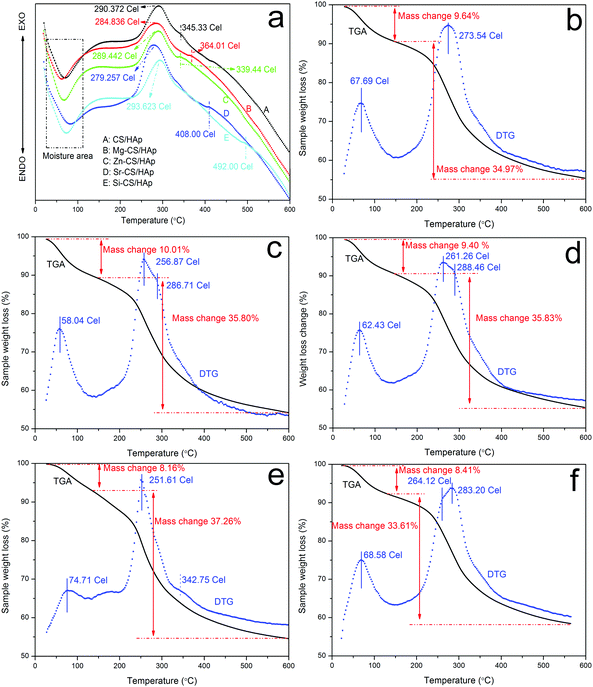 | ||
| Fig. 5 DTA curves of (a) CS/HAp, (b) Mg-CS/HAp, (c) Zn-CS/HAp, (d) Sr-CS/HAp, and (e) Si-CS/HAp; TGA and DTG curves of (b) CS/HAp, (c) Mg-CS/HAp, (d) Zn-CS/HAp, (e) Sr-CS/HAp, and (f) Si-CS/HAp. | ||
Fig. 5b–f demonstrates the TGA and DTG curves of CS/HAp, Mg-CS/HAp, Zn-CS/HAp, Sr-CS/HAp, and Si-CS/HAp, respectively. From the DTG profiles, it could be found that CS/HAp showed two peaks (67.69 °C and 273.54 °C) while the other four specimens exhibited three peaks (i.e., Mg-CS/HAp (58.04 °C, 256.87 °C, and 286.71 °C), Zn-CS/HAp (62.43 °C, 261.26 °C, and 288.46 °C), Sr-CS/HAp (74.71 °C, 251.61 °C, and 342.75 °C), and Si-CS/HAp (68.58 °C, 264.12 °C, and 283.20 °C)). For all the samples, the first peak was ascribed to moisture. The decomposition temperatures of CS/HAp, Mg-CS/HAp, Zn-CS/HAp, Sr-CS/HAp, and Si-CS/HAp were mainly located at 273.54 °C, 256.87 °C, 261.26 °C, 251.61 °C, and 283.20 °C, respectively. The thermal stability of the five specimens could be summarized as follows: Si-CS/HAp > CS/HAp > Zn-CS/HAp > Mg-CS/HAp > Sr-CS/HAp. The newly appeared DTG peaks in (c), (d), (e), and (f) could not be designated because the existing forms of Mg, Zn, Sr, and Si in the composites could not be elucidated in detail.
3.6. Mechanical strength
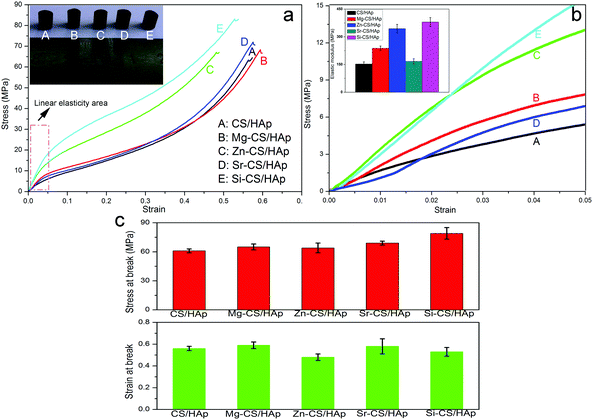
Fig. 6a exhibits the stress–strain profiles of CS/HAp, Mg-CS/HAp, Zn-CS/HAp, Sr-CS/HAp, and Si-CS/HAp. The inset in the upper left corner of Fig. 6a shows the digital photographs of the samples used for compression tests. Briefly, all the samples presented similar mechanical behaviors. Fig. 6b shows the stress–strain curves of the five specimens with strains ranging from 0 to 0.05 (namely the area marked by the red wireframe in Fig. 6a). The elastic modulus values of the five samples were calculated as the slope of the initial linear portion of the stress–strain curves. The inset in the upper left corner of Fig. 6b shows the histogram of the elastic modulus of the five specimens. Briefly, Mg-CS/HAp, Zn-CS/HAp, Sr-CS/HAp, and Si-CS/HAp demonstrated higher stiffness than CS/HAp. But Mg, Zn, Sr, and Si had different reinforcement effects on the mechanical strength of the final composites. The elastic modulus of the five specimens decreased in this order: Si-CS/HAp > Zn-CS/HAp > Mg-CS/HAp > Sr-CS/HAp > CS/HAp. In addition, Si-CS/HAp and Zn-CS/HAp showed an obviously higher elastic modulus than the other samples. Besides, the fracture strength and fracture toughness also differed among the five samples (Fig. 6c). Briefly, the fracture stress of the five specimens decreased as follows: Si-CS/HAp > Sr-CS/HAp > Mg-CS/HAp > Zn-CS/HAp > CS/HAp. The toughness of the five samples decreased in the following order: Mg-CS/HAp > Sr-CS/HAp > CS/HAp > Si-CS/HAp > Zn-CS/HAp.In summary, Si-CS/HAp presented optimal mechanical properties because it showed the highest elastic modulus and fracture stress, simultaneously. In order to elucidate this phenomenon, two possible factors were included. First, the HAp particles dispersed in Si-CS/HAp had higher uniformity than those dispersed in CS/HAp, Mg-CS/HAp, Zn-CS/HAp, and Sr-CS/HAp. Second, Si-CS/HAp had stronger organic–inorganic interactions than the other four samples.
3.7. In vitro cytocompatibility
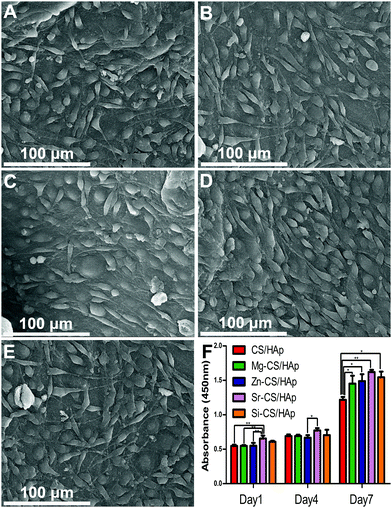
Fig. 7A–E presents the morphology of MC3T3-E1 cells cultured on CS/HAp, Mg-CS/HAp, Zn-CS/HAp, Sr-CS/HAp, and Si-CS/HAp. After 2 days of culture, ME3T3-E1 cells with a specific fusiform morphology could spread out and tightly attach to the five specimens. It could be concluded that the five specimens were all biocompatible to MC3T3-E1 cells. Fig. 7F shows the proliferation of the cells cultured on the five samples. On day 1 and day 4, no big differences were found among the different groups. However, on day 7, the differences in the proliferative capacity of the cells cultured on different samples could be summarized as follows: Sr-CS/HAp > Si-CS/HAp > Zn-CS/HAp > Mg-CS/HAp > CS/HAp.In order to explain this phenomenon, three possible factors could be taken into consideration, facilitating the effects of doped elements, matrix stiffness, and matrix roughness. As was mentioned before, Mg, Zn, Sr, and Si were all capable of facilitating cell proliferation and differentiation. Thus, the cells cultured on Mg-CS/HAp, Zn-CS/HAp, Sr-CS/HAp, and Si-CS/HAp demonstrated a higher proliferative potential than the cells cultured on CS/HAp. Materials with a higher surface roughness could facilitate better material–cell interaction and could promote cell proliferation. In addition, cell proliferation and differentiation increase with increasing matrix stiffness.52 Therefore, the cells cultured on Si-CS/HAp and Zn-CS/HAp demonstrated a higher proliferation capacity than the cells cultured on Mg-CS/HAp and CS/HAp. Interestingly, we also realized that the cells cultured on Sr-CS/HAp exhibited the highest proliferation potential among the cells cultured on the other four samples in spite of the low elastic modulus and surface roughness of Sr-CS/HAp. Thus, it could be concluded that Sr had advantages over Mg, Zn, and Si in promoting cell proliferation in vitro.
4. Conclusions
In this work, the CS/HAp composite and other four kinds of element doped hydroxyapatite/chitosan composites (Mg-CS/HAp, Zn-CS/HAp, Sr-CS/HAp, and Si-CS/HAp) were synthesized by using a novel in situ precipitation method. The impacts of these doped elements on the crystallinity, crystal morphology, and crystal structure of the final composites were carefully studied. From the XRD data it was found that the main inorganic phases of the five composites were all confirmed to be HAp. In addition, Mg and Sr restrained the growth of HAp crystallites along both the a-axis and the c-axis. Si facilitated the preferred oriented growth of the HAp crystallite along the a-axis while restraining its growth along the c-axis. Zn had no influence on the growth of the HAp crystallite along the a-axis but restrained its growth along the c-axis. Through calculation, we also found that the aspect ratios of HAp crystallites dispersed in the five samples increased in this order: Zn-CS/HAp < Si-CS/HAp < Mg-CS/HAp < CS/HAp < Sr-CS/HAp. The TEM images indicate that HAp particles dispersed in Zn-CS/HAp and Si-CS/HAp present obvious rod-like structures while those dispersed in CS/HAp, Sr-CS/HAp, and Mg-CS/HAp have anomalous structures. Besides, the differences in the particle size of the HAp crystals dispersed in the five specimens could be summarized as follows: Mg-CS/HAp < Zn-CS/HAp < Si-CS/HAp < Sr-CS/HAp.The surface roughness of the five specimens decreased in the following order: Si-CS/HAp > Zn-CS/HAp > CS/HAp > Mg-CS/HAp > Sr-CS/HAp. The thermal stability of the five samples could be summarized as follows: Si-CS/HAp > CS/HAp > Zn-CS/HAp > Mg-CS/HAp > Sr-CS/HAp. The in vitro cell culture assay indicated that the cells cultured on Mg-CS/HAp, Zn-CS/HAp, Sr-CS/HAp, and Si-CS/HAp had a higher proliferation potential than the cells cultured on CS/HAp. The differences in the proliferative capacity of the cells cultured on different samples can be summarized as follows: Sr-CS/HAp > Si-CS/HAp > Zn-CS/HAp > Mg-CS/HAp > CS/HAp.
In Table 2, the microstructures and macroscopic properties of the five samples are summarized and compared. It can be found that Si-CS/HAp presented the highest surface roughness, thermal stability, elastic modulus, and facture stress among the five samples. Besides, the cells cultured on Si-CS/HAp demonstrated the second highest viability. Conclusively, Si-CS/HAp was the optimized hybrid system. Finally, we anticipate that our work could shed new light on the influence of ionic doping on the mineralization of HAp and inspire researchers to prepare an HAp-based organic/inorganic composite load-bearing bone substitute in the future.
| Microstructure of HAp | Sample | Ranking of macroscopic properties of composites | ||||||
|---|---|---|---|---|---|---|---|---|
| Ranking of particle size | Ranking of aspect ratio | Morphology | Surface roughness | Thermal stability | Elastic modulus | Fracture stress | Viability of adherent cells | |
| 3 | Anomalous | CS/HAp | 3 | 2 | 5 | 5 | 5 | |
| 4 | 2 | Anomalous | Mg-CS/HAp | 4 | 4 | 3 | 3 | 4 |
| 2 | 5 | Rod | Zn-CS/HAp | 2 | 3 | 2 | 4 | 3 |
| 1 | 1 | Anomalous | Sr-CS/HAp | 5 | 5 | 4 | 2 | 1 |
| 3 | 4 | Rod | Si-CS/HAp | 1 | 1 | 1 | 1 | 2 |
Acknowledgements
This research was supported by the National Natural Science Foundation of China (No. 31071265 and 30900297).References
- S. Pina, J. M. Oliveira and R. L. Reis, Adv. Mater., 2015, 27, 1143–1169 CrossRef CAS PubMed.
- J. Ran, J. Hu, G. Sun, S. Chen, L. Chen, X. Shen and H. Tong, RSC Adv., 2015, 5, 76526–76537 RSC.
- R. Arun Kumar, A. Sivashanmugam, S. Deepthi, S. Iseki, K. P. Chennazhi, S. V. Nair and R. Jayakumar, ACS Appl. Mater. Interfaces, 2015, 7, 9399–9409 CAS.
- K. Ogata, S. Imazato, A. Ehara, S. Ebisu, Y. Kinomoto, T. Nakano and Y. Umakoshi, J. Biomed. Mater. Res., Part A, 2005, 72, 127–135 CrossRef PubMed.
- T. J. Webster, E. A. Massa-Schlueter, J. L. Smith and E. B. Slamovich, Biomaterials, 2004, 25, 2111–2121 CrossRef CAS PubMed.
- J. Huang, S. Best, R. Brooks, N. Rushton and W. Bonfield, J. Biomed. Mater. Res., Part A, 2008, 87, 598–607 CrossRef CAS PubMed.
- S. Wu, X. Liu, K. W. K. Yeung, C. Liu and X. Yang, Mater. Sci. Eng., R, 2014, 80, 1–36 CrossRef.
- Z. Huang, F. Cui, Q. Feng and X. Guo, Ceram. Int., 2015, 41, 8773–8778 CrossRef CAS.
- M. Bornapour, N. Muja, D. Shum-Tim, M. Cerruti and M. Pekguleryuz, Acta Biomater., 2013, 9, 5319–5330 CrossRef CAS PubMed.
- O. Karaman, A. Kumar, S. Moeinzadeh, X. He, T. Cui and E. Jabbari, J. Tissue Eng. Regener. Med., 2016, 10, E132–E146 CrossRef CAS PubMed.
- E. Boanini, P. Torricelli, M. Fini and A. Bigi, J. Mater. Sci.: Mater. Med., 2011, 22, 2079–2088 CrossRef CAS PubMed.
- A. Bandyopadhyay, S. Bernard, W. Xue and S. Bose, J. Am. Ceram. Soc., 2006, 89, 2675–2688 CrossRef CAS.
- A. Hattiangadi and A. Bandyopadhyay, J. Am. Ceram. Soc., 2000, 83, 2730–2736 CrossRef CAS.
- Z. Yang, Y. Jiang, L. Xin Yu, B. Wen, F. Li, S. Sun and T. Hou, J. Mater. Chem., 2005, 15, 1807–1811 RSC.
- S. Samavedi, A. R. Whittington and A. S. Goldstein, Acta Biomater., 2013, 9, 8037–8045 CrossRef CAS PubMed.
- B. Pemmer, A. Roschger, A. Wastl, J. Hofstaetter, P. Wobrauschek, R. Simon, H. Thaler, P. Roschger, K. Klaushofer and C. Streli, Bone, 2013, 57, 184–193 CrossRef CAS PubMed.
- Q. Hu, Z. Tan, Y. Liu, J. Tao, Y. Cai, M. Zhang, H. Pan, X. Xu and R. Tang, J. Mater. Chem., 2007, 17, 4690–4698 RSC.
- P. J. Ter Brugge, J. G. Wolke and J. A. Jansen, Clin. Oral Implan. Res., 2003, 14, 472–480 CrossRef.
- H. Yuan, H. Fernandes, P. Habibovic, J. de Boer, A. M. Barradas, A. de Ruiter, W. R. Walsh, C. A. van Blitterswijk and J. D. de Bruijn, Proc. Natl. Acad. Sci. U. S. A., 2010, 107, 13614–13619 CrossRef CAS PubMed.
- K. Das, S. Bose and A. Bandyopadhyay, Acta Biomater., 2007, 3, 573–585 CrossRef CAS PubMed.
- B. Li, X. Liao, L. Zheng, X. Zhu, Z. Wang, H. Fan and X. Zhang, Acta Biomater., 2012, 8, 3794–3804 CrossRef CAS PubMed.
- K. Saha, J. F. Pollock, D. V. Schaffer and K. E. Healy, Curr. Opin. Chem. Biol., 2007, 11, 381–387 CrossRef CAS PubMed.
- K. M. Mabry, R. L. Lawrence and K. S. Anseth, Biomaterials, 2015, 49, 47–56 CrossRef CAS PubMed.
- C. Serre, M. Papillard, P. Chavassieux, J. Voegel and G. Boivin, J. Biomed. Mater. Res., 1998, 42, 626–633 CrossRef CAS PubMed.
- D. Dallari, L. Savarino, U. Albisinni, P. Fornasari, A. Ferruzzi, N. Baldini and S. Giannini, Biomaterials, 2012, 33, 72–79 CrossRef CAS PubMed.
- R. Rude, H. Gruber, L. Wei, A. Frausto and B. Mills, Calcif. Tissue Int., 2003, 72, 32–41 CrossRef CAS PubMed.
- D. J. Hickey, B. Ercan, L. Sun and T. J. Webster, Acta Biomater., 2015, 14, 175–184 CrossRef CAS PubMed.
- N. Kanzaki, K. Onuma, G. Treboux, S. Tsutsumi and A. Ito, J. Phys. Chem. B, 2000, 104, 4189–4194 CrossRef CAS.
- H.-W. Kim, H.-E. Kim and V. Salih, Biomaterials, 2005, 26, 5221–5230 CrossRef CAS PubMed.
- G. Wei and P. X. Ma, Biomaterials, 2004, 25, 4749–4757 CrossRef CAS PubMed.
- J.-Y. Reginster, E. Seeman, M. de Vernejoul, S. Adami, J. Compston, C. Phenekos, J.-P. Devogelaer, M. D. Curiel, A. Sawicki and S. Goemaere, J. Clin. Endocrinol. Metab., 2005, 90, 2816–2822 CrossRef CAS PubMed.
- P. Marie, Osteoporosis Int., 2003, 14, 9–12 CrossRef PubMed.
- E. Bonnelye, A. Chabadel, F. Saltel and P. Jurdic, Bone, 2008, 42, 129–138 CrossRef CAS PubMed.
- A. D. Bakker, B. Zandieh-Doulabi and J. Klein-Nulend, Bone, 2013, 53, 112–119 CrossRef CAS PubMed.
- N. Chattopadhyay, S. J. Quinn, O. Kifor, C. Ye and E. M. Brown, Biochem. Pharmacol., 2007, 74, 438–447 CrossRef CAS PubMed.
- Z. Li, W. Lam, C. Yang, B. Xu, G. Ni, S. Abbah, K. Cheung, K. Luk and W. Lu, Biomaterials, 2007, 28, 1452–1460 CrossRef CAS PubMed.
- M. Filippousi, P. I. Siafaka, E. P. Amanatiadou, S. G. Nanaki, M. Nerantzaki, D. N. Bikiaris, I. S. Vizirianakis and G. Van Tendeloo, J. Mater. Chem. B, 2015, 3, 5991–6000 RSC.
- A. M. Pietak, J. W. Reid, M. J. Stott and M. Sayer, Biomaterials, 2007, 28, 4023–4032 CrossRef CAS PubMed.
- G. A. Fielding, A. Bandyopadhyay and S. Bose, Dent. Mater., 2012, 28, 113–122 CrossRef CAS PubMed.
- S. Tarafder, N. M. Davies, A. Bandyopadhyay and S. Bose, Biomater. Sci., 2013, 1, 1250–1259 RSC.
- F. M. Ghorbani, B. Kaffashi, P. Shokrollahi, E. Seyedjafari and A. Ardeshirylajimi, Carbohydr. Polym., 2015, 118, 133–142 CrossRef CAS PubMed.
- F. Martínez-Vázquez, M. Cabañas, J. Paris, D. Lozano and M. Vallet-Regí, Acta Biomater., 2015, 15, 200–209 CrossRef PubMed.
- L. Chen, J. Hu, J. Ran, X. Shen and H. Tong, RSC Adv., 2015, 5, 56410–56422 RSC.
- X. Cai, H. Tong, X. Shen, W. Chen, J. Yan and J. Hu, Acta Biomater., 2009, 5, 2693–2703 CrossRef CAS PubMed.
- X. Shen, H. Tong, T. Jiang, Z. Zhu, P. Wan and J. Hu, Compos. Sci. Technol., 2007, 67, 2238–2245 CrossRef CAS.
- X. Cai, L. Chen, T. Jiang, X. Y. Shen, J. M. Hu and H. Tong, J. Mater. Chem., 2011, 21, 12015–12025 RSC.
- J. Ran, J. Hu, L. Chen, X. Shen and H. Tong, Polym. Compos. DOI:10.1002/pc.23725.
- O. Kaygili and S. Keser, Ceram. Int., 2016, 42, 9270–9273 CrossRef CAS.
- X. Qu, A. Wirsén and A. C. Albertsson, Polymer, 2000, 41, 4841–4847 CrossRef CAS.
- I. Yamaguchi, S. Itoh, M. Suzuki, M. Sakane, A. Osaka and J. Tanaka, Biomaterials, 2003, 24, 2031–2036 CrossRef CAS PubMed.
- C. Qin, B. Zhou, L. Zeng, Z. Zhang, Y. Liu, Y. Du and L. Xiao, Food Chem., 2004, 84, 107–115 CrossRef CAS.
- J. Ran, J. Hu, G. Sun, S. Chen, P. Jiang, X. Shen and H. Tong, Int. J. Biol. Macromol., 2016, 93, 87–97 CrossRef CAS PubMed.
| This journal is © the Partner Organisations 2017 |

