DOI:
10.1039/C6QM00217J
(Research Article)
Mater. Chem. Front., 2017,
1, 1107-1117
Assessment of the imperative features of an L-arginine 4-nitrophenolate 4-nitrophenol dihydrate single crystal for non linear optical applications
Received
15th September 2016
, Accepted 14th November 2016
First published on 3rd January 2017
Abstract
An L-arginine 4-nitrophenolate 4-nitrophenol dihydrate (LAPP) single crystal has been grown by adopting a slow evaporation solution growth technique (SEST). The crystal structure and its lattice dimensions along with the space group were confirmed through single crystal X-ray diffraction and it was found that the crystal belongs to a monoclinic crystal system with the space group P21. Using Hall–Williamson's equation, the strain present in the single crystal was ascertained. The functional groups of the title compound were identified using heteronuclear correlation methods (HETCOR) and Raman spectroscopy. The optical parameters of the grown single crystal were evaluated using UV-vis-NIR analysis. Thermal parameters like the specific heat, thermal effusivity, thermal diffusivity and conductivity of the LAPP single crystal were computed from the photopyroelectric effect. Furthermore, mechanical stability parameters like the hardness, stiffness and Young's modulus were examined using a nanoindentation technique. The ferroelectric behavior and laser damage threshold were also assessed.
Introduction
Recently numerous researchers have centered their concentration on the synthesis and characterization of novel organic NLO materials, due to their high non-linear coefficient, high optical susceptibility and ultra-fast response time in the electro-optic effect.1 It has been observed that organic compounds with a conjugated electron system, possessing donor and acceptor substituents, lead to increase the efficiency of NLO materials. Within this category, amino acids act as promising candidates for nonlinear optical applications since they contain proton donor carboxyl groups and a proton acceptor amino group.2 They exhibit some special features such as molecular chirality, weak van der Waals forces and wide transparency ranges in the UV-vis spectral region, which leads to enhanced crystalline properties.3L-Arginine based compounds have been profoundly investigated because of their high NLO properties, which were initially reported by Monaco et al.4 Up to now, several L-arginine based complexes such as L-arginine phosphate monohydrate,5L-arginine trifluoroacetate,6L-arginine phosphite7 and L-arginine bis(trifluoroacetate)8 have been studied. L-Arginine phosphate (LAP) has a non-linear coefficient that is three times higher than that of potassium diphosphate (KDP) and its laser damage threshold is also nearly three times that of KDP.9,10 These outstanding properties of the LAP single crystal urge researchers to develop novel compounds of L-arginine. In 2008, a new compound L-argininium 4-nitrophenolate monohydrate (LARP) was reported, which exhibits efficient second harmonic generation.11 The increase in the efficiency of second harmonic generation (SHG) within the complex of L-arginine with 4-nitrophenol was observed due to high molecular polarizability as a result of interactions of the delocalized electron clouds within the molecules and proton transfer among the molecular chains.12,13
In the present paper, we report the growth and characterization of an L-arginine 4-nitrophenolate 4-nitrophenol dihydrate (LAPP) single crystal. It belongs to a monoclinic crystallographic system with the space group P21, reported by Wang et al.14 The title compound shows a second harmonic generation that is 2.66 times higher than the standard KDP and it exhibits thermal stability up to 110 °C.15 To the best of our knowledge, this is the first study reporting the mechanical, ferroelectric, thermal and optical parameters of a grown LAPP single crystal.
Experimental
LAPP was synthesized by taking the raw materials L-arginine and 4-nitrophenol in a 1![[thin space (1/6-em)]](https://www.rsc.org/images/entities/char_2009.gif) :
:![[thin space (1/6-em)]](https://www.rsc.org/images/entities/char_2009.gif) 2 molar ratio13 and dissolving them in double distilled water, which acts as a solvent. After that, the prepared solution was kept on a magnetic stirrer for homogenization for a period of 4 hours and then filtered to remove the impurities using Whatmann filter paper. The synthesis process was carried out at a temperature of 45 °C. The synthesized salt was used for growing the single crystal of the title compound. The synthesized salt was again dissolved in distilled water at a temperature of 40 °C to make a saturated solution of LAPP. The resulting solution was then kept in a constant temperature bath with an accuracy of ±0.01 °C at 40 °C. After 20 days, a good quality transparent single crystal was taken out from the solution, which had dimensions of 6 × 7 × 3 mm3 as shown in Fig. 1.
2 molar ratio13 and dissolving them in double distilled water, which acts as a solvent. After that, the prepared solution was kept on a magnetic stirrer for homogenization for a period of 4 hours and then filtered to remove the impurities using Whatmann filter paper. The synthesis process was carried out at a temperature of 45 °C. The synthesized salt was used for growing the single crystal of the title compound. The synthesized salt was again dissolved in distilled water at a temperature of 40 °C to make a saturated solution of LAPP. The resulting solution was then kept in a constant temperature bath with an accuracy of ±0.01 °C at 40 °C. After 20 days, a good quality transparent single crystal was taken out from the solution, which had dimensions of 6 × 7 × 3 mm3 as shown in Fig. 1.
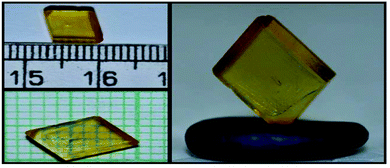 |
| | Fig. 1 Harvested L-arginine 4-nitrophenolate 4-nitrophenol dihydrate (LAPP) single crystal from the mother solution. | |
Characterization techniques
1. Single crystal X-ray diffraction analysis
A yellowish single crystal of dimensions 0.3 × 0.4 × 0.24 mm3 was chosen for the single crystal X-ray diffraction analysis. The diffraction intensities were obtained using a CCD area-detector X'Calibur single crystal diffractometer with MoKα radiation (λ = 0.71069 Å) at 293 K. The title compound crystallizes in a P21 monoclinic crystal system with the unit cell parameters: a = 7.849 Å, b = 10.3610 Å, c = 13.7881 Å, β = 98.205°. The cell dimensions and space group symmetry were found to be in good agreement with a previous report, which confirms that L-arginine 4-nitrophenolate 4-nitrophenol had been formed.14 The space group reveals that the LAPP single crystal is non centrosymmetric, which is a primary condition for second harmonic generation behaviour.16
The structure of the title compound could be well-demonstrated with the help of mercury software. The molecular configuration of the crystal structure shows that there are two 4-nitrophenol groups and water molecules along with a zwitterionic L-arginine amino acid. The C–O bond lengths of both the 4-nitrophenol groups are not same, suggesting that the groups show different behavior. The one with a longer C–O bond length of 1.351 Å behaves as a neutral molecule while the other with a shorter C–O bond length of 1.292 Å shows electronegative behavior due to a deprotonated OH group (bond length values match exactly with the reported literature).14 The C–O bond lengths and crystal structure packing along the a axis are shown in Fig. 2(a) and (b) respectively. As a result, the electronegative 4-nitophenol shows more H-bonding interactions than the neutral one. Furthermore, the deprotonated oxygen of this group shows three centered N–H–O hydrogen bonding with the guanidyl group of the L-arginine molecule. Such an interaction is absent in the neutral 4-nitophenol group. Many other hydrogen bonds can be observed in the structure, involving the guanidyl group, carboxyl group, nitro group and water molecules. These many bonding interactions are accountable for the good mechanical strength of the title compound, which was confirmed using a nanoindentation technique which will be discussed in the forthcoming section.
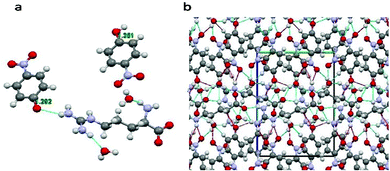 |
| | Fig. 2 (a) Molecular configuration of the LAPP single crystal; (b) packing along the ‘a’ axis. | |
The diffracting plane of the grown single crystal was investigated using a powder X-ray diffractometer. Initially, the good quality single crystal was crushed to make a powder and then subjected to investigation with a Bruker D8 Advance X-ray diffractometer with CuKα radiation (∼1.54 Å), using a scan speed of 0.1° min−1 and covering a range from 10° to 80°. The results for the diffracting plane of the LAPP single crystal are shown in Fig. 3(a). The lattice micro-strain present inside the single crystal can be assessed using the Hall–Williamson relationship. The strain can be measured by plotting a curve of β![[thin space (1/6-em)]](https://www.rsc.org/images/entities/i_char_2009.gif) cos
cos![[thin space (1/6-em)]](https://www.rsc.org/images/entities/char_2009.gif) θ vs. sin
θ vs. sin![[thin space (1/6-em)]](https://www.rsc.org/images/entities/char_2009.gif) θ, as shown in Fig. 3(b). A straight line can be fitted to the curve and the slope of the line represents the strain, which was found to be – 0.8 × 10⁻³.
θ, as shown in Fig. 3(b). A straight line can be fitted to the curve and the slope of the line represents the strain, which was found to be – 0.8 × 10⁻³.
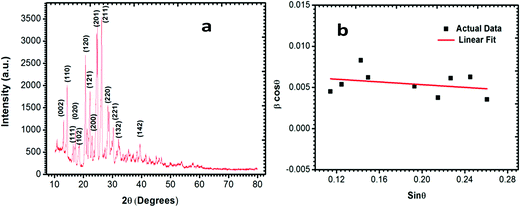 |
| | Fig. 3 (a) Powder X-ray diffraction pattern; (b) β![[thin space (1/6-em)]](https://www.rsc.org/images/entities/i_char_2009.gif) cos cos![[thin space (1/6-em)]](https://www.rsc.org/images/entities/char_2009.gif) θ versus sin θ versus sin![[thin space (1/6-em)]](https://www.rsc.org/images/entities/char_2009.gif) θ plot. θ plot. | |
2. HETCOR and Raman analysis.
Obtaining 1H and 13C NMR spectra is the first elementary approach that is considered by chemists performing the structure elucidation of compounds.171H and 13C NMR spectra of a fine crystalline powder of LAPP were recorded using a JEOL ECX 400 NMR spectrometer operating at 400 MHz and 100 MHz, respectively, using deuterium oxide (D2O) as the solvent and the recorded spectra are shown in Fig. 4(a) and (b) respectively. The hydrogen and carbon atoms present in various chemical environments provide signals at different chemical shift (δ) positions. Heteronuclear chemical shift correlation (HETCOR) experiments were performed to determine the correlation between the protons and carbons present in the LAPP crystal, as shown in Fig. 5. In the 1H NMR spectrum of the compound, the multiplet at 1.46–1.63 ppm corresponds to 2H of the C-3 carbon and is due to splitting caused by the neighboring protons (protons at C-2 and C-4 carbons). Similarly, the multiplet at 1.73–1.79 ppm corresponds to 2H of the C-4 carbon and the triplet at 3.07 ppm corresponds to 2H of the C-2 carbon. The triplet at 3.62 ppm with a coupling constant of 7.0 Hz represents one proton of the C-5 carbon and the aromatic protons appear as multiplets ranging from 6.56–6.60 ppm (4Hb) and 7.92–7.95 ppm (4Ha). In the 13C NMR spectrum of the compound, the peaks at 23.86, 27.60, 40.51 and 54.35 ppm correspond to the aliphatic carbons C-3, C-4, C-2 and C-5, respectively. Similarly, the peaks at 117.35 ppm and 127.21 ppm represent unsubstituted aromatic carbons. The peak at 137.14 ppm corresponds to an aromatic carbon with a nitro group substituent and the peak at 170.20 ppm corresponds to an aromatic carbon with a hydroxyl group substituent. The peak at 156.75 ppm corresponds to the C-1 carbon of the guanidine part of the molecule. The peak due to the carboxylic carbon is at 174.43 ppm.
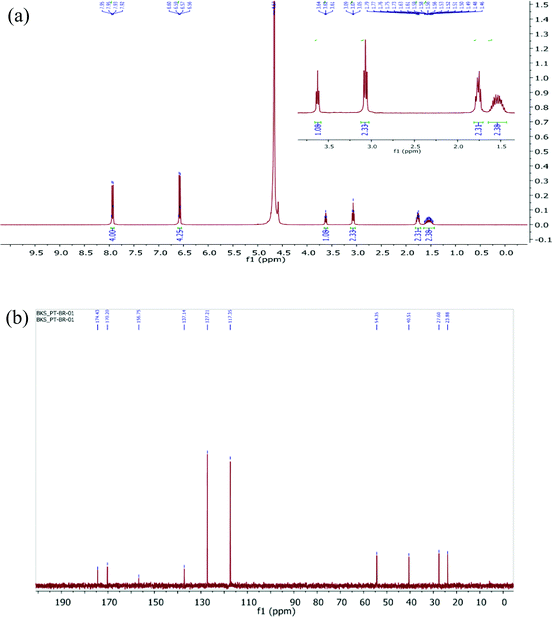 |
| | Fig. 4 (a) 1H NMR spectrum of the LAPP single crystal (D2O, 400 MHz), inset shows the expanded view of 1H-NMR; (b) 13C NMR spectrum of the LAPP single crystal (D2O, 100 MHz). | |
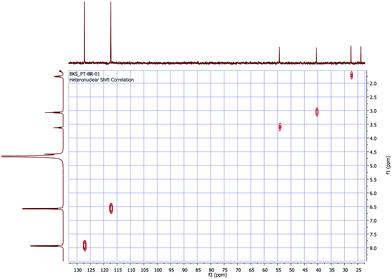 |
| | Fig. 5 Expanded HETCOR spectrum of the LAPP single crystal (D2O). | |
To confirm the presence of functional groups in the grown single crystal, a Raman spectrum was recorded for the wavelength range 200–3200 cm−1 using a Renishaw Invia Raman Microscope and a corresponding excitation wavelength of 532 nm. The observed spectrum is shown in Fig. 6 and the assigned peaks are tabulated in Table 1. The peak for O–C![[double bond, length as m-dash]](https://www.rsc.org/images/entities/char_e001.gif) O in-plane deformation was observed at 629 cm−1. The peaks at 855 cm−1 and 873 cm−1 show C–C stretching; however a peak for C–C–N asymmetric stretching was found at 1105 cm−1. Peaks for OH in plane bending and C–C aliphatic chain vibrations were observed at 1165 cm−1 and 1266 cm−1 respectively. A peak at 1290 cm−1 was attributed to NO2 symmetric stretching and a peak for C–O stretching was found at 1326 cm−1. A peak for COO– symmetric bending and two phenyl stretching peaks were observed at 1463 cm−1, 1563 cm−1 and 1593 cm−1, respectively. Peaks at 2944 cm−1, 2979 cm−1 and 3075 cm−1 represent NH3+ symmetric stretching, CH2 asymmetric stretching and O–H stretching, respectively.
O in-plane deformation was observed at 629 cm−1. The peaks at 855 cm−1 and 873 cm−1 show C–C stretching; however a peak for C–C–N asymmetric stretching was found at 1105 cm−1. Peaks for OH in plane bending and C–C aliphatic chain vibrations were observed at 1165 cm−1 and 1266 cm−1 respectively. A peak at 1290 cm−1 was attributed to NO2 symmetric stretching and a peak for C–O stretching was found at 1326 cm−1. A peak for COO– symmetric bending and two phenyl stretching peaks were observed at 1463 cm−1, 1563 cm−1 and 1593 cm−1, respectively. Peaks at 2944 cm−1, 2979 cm−1 and 3075 cm−1 represent NH3+ symmetric stretching, CH2 asymmetric stretching and O–H stretching, respectively.
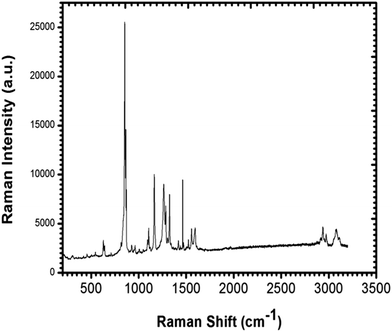 |
| | Fig. 6 Raman spectrum of the LAPP single crystal. | |
Table 1 Assigned peaks of the functional groups using Raman spectroscopy
| Wavenumber (cm−1) |
Assignments |
| 3075 |
O–H stretching |
| 2979 |
CH2 asymmetric stretching |
| 2944 |
NH3+ symmetric stretching |
| 1593 |
Phenyl stretching |
| 1563 |
Phenyl stretching |
| 1463 |
COO– symmetric bending |
| 1326 |
C–O stretching |
| 1290 |
NO2 symmetric stretching |
| 1266 |
C–C aliphatic chain vibration |
| 1165 |
O–H in plane bending |
| 1105 |
C–C–N asymmetric stretching |
| 873 |
C–C stretching |
| 855 |
C–C stretching |
| 629 |
O–C![[double bond, length as m-dash]](https://www.rsc.org/images/entities/char_e001.gif) O in plane of deformation O in plane of deformation |
3. Optical transmission analysis.
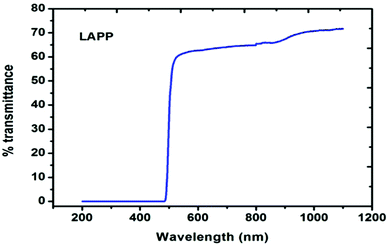 |
| | Fig. 7 UV-vis-NIR spectrum of LAPP. | |
| |  | (1) |
In the above relation, d is the thickness of the sample, which was 1.5 mm, and T is the transmittance of the sample. The optical band gap (Eg) was calculated from the optical absorption coefficient (α) near the absorption edge using the Tauc relation:| |  | (2) |
where, A is a constant, Eg is the optical band gap, h is Planck's constant and ν is the frequency of incident photons. A curve of (αhν)2vs. energy (hν) was plotted and a tangent was drawn, which intercepts the X-axis (hν) to provide the band gap of the material. For the present case, it was found to be ∼2.6 nm. Furthermore, the extinction coefficient and reflectance were calculated using the following relations:| |  | (3) |
| |  | (4) |
The obtained value for the reflectance can be further utilized to evaluate the refractive index of the sample, using the equation:| |  | (5) |
The calculated values for the extinction coefficient, reflectance and refractive index for the title compound are 0.000190778, 1.411 and 4.95 respectively. The susceptibility of the material was calculated using the equation:| |  | (6) |
The susceptibility was found to be 2.052, where the real part is 25.776 and imaginary part is 0.00170.
5. Photopyroelectric technique (PPE).
The photopyroelectric technique is used to determine the thermal parameters of a solid at room temperature. This technique has a discrete tendency for performing non-destructive probing. Also, it has better sensitivity and simplicity. For the present study, a 120 mWatt He–Cd laser with a wavelength of 442 nm was used as the source of radiation. A polyvinylidene difluoride (PVDF) film having thickness 28 micrometers, coated with Ni–Cr on both side act as pyroelectric detector. Light modulation was achieved using a mechanical chopper, which was used as an optical heating source. The PPE signal was measured using a dual phase lock-in amplifier with a 10 MΩ input impedance and 50 pF input capacitance.24 A good quality single crystal with a thickness of 0.5 mm was used for the measurements. In this technique, one side of the sample was irradiated with a modulated light source (mainly laser) that generated heat inside it and was also responsible for the temperature gradient within the crystal due to the anisotropic behavior of the single crystal. It is well known that the specific heat of a single crystal is inversely proportional to the temperature gradient, which means the higher the specific heat of the sample, the lower the temperature gradient and vice versa.25 From the other side of the crystal, the temperature oscillations were measured using a detector, which was supported by a thick thermally conductive backing. The temperature fluctuations observed by the detector would generate an electric current, which is proportional to the change in the average heat content.26 The variations in the PPE signal phase and amplitude against the frequency modulation are shown in Fig. 8. These measurements helped to determine the thermal effusivity and thermal diffusivity of the material. Hence, the thermal conductivity and heat capacity of the sample were extracted using the following equations:| |  | (13) |
| |  | (14) |
where ks is the thermal conductivity of the sample, Cps is the specific heat at a constant pressure, es is the thermal effusivity and αs is the thermal diffusivity. All the observed thermal parameters are tabulated in Table 3. The specific heat capacity of the LAPP single crystal was found to be comparable to an L-arginine fluoride single crystal.27 Thus, the title compound has good thermal stability and therefore can withstand laser induced damage. Such stability factors are highly favorable for photonic applications.
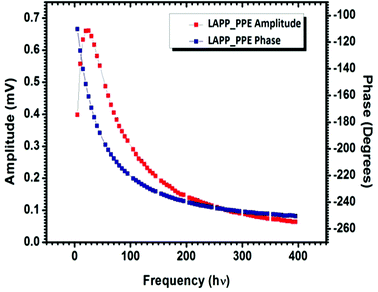 |
| | Fig. 8 PPE amplitude and phase vs. frequency curves for LAPP. | |
Table 3 Thermal parameters of the LAPP single crystal
| Sample |
Thermal diffusivity, α (×10−7 m2 s−1) |
Thermal effusivity, e (W m−2 K−1 s+1/2) |
Specific heat capacity, Cp (J kg−1 K−1) |
Thermal conductivity, k (W m−1 K−1) |
| LAPP |
15.97 ± 0.80 |
757 ± 11 |
424 ± 6 |
0.95 ± 0.02 |
6. Laser damage threshold (LDT) and phase matching angle.
LDT analyses were carried out using a Nd:YAG laser and 1064 nm radiation, with a pulse width of 10 ns (Gaussian in shape), a diameter of 3.5 mm and a repetition rate of 1 to 10 pulses per second. The laser was focused using a bi-convex lens of focal length 20 cm.28 For the present study, the crystal was placed just at the focal point of the lens. The damage threshold was measured by increasing the energy of the incident laser pulse through increasing the charging voltage of the laser power supply, which can be controlled to within 1 volt. The surface damage threshold was recorded both for a single shot and multiple shot for two different positions of the crystal. It has been observed that single crystals with a high specific heat can withstand laser exposure for longer. Heat is generated within the single crystals due to the laser irradiation, which causes damage to the surface of the crystal. Besides, the damage threshold of the specimen also depends on the level of crystalline perfection because as the defect concentration of a crystal increases, it obtains more groves and increased energy absorption occurs, which results in damage to the crystal surface.29 The energy of the incident radiation was taken into account when considering the Fresnel reflection loss from different uncoated surfaces of the lens. Laser damage threshold values for the LAPP single crystal are tabulated in Table 4. The phase matching angle was determined using a Nd:YAG laser as the source and it was found that the crystal generates a second harmonic at 23.9 ± 1 (deg.) with a 1064 nm wavelength.
Table 4 Laser damage values for the LAPP single crystal
| Crystal |
Damage threshold |
| For 1 pulse per second |
For 10 pulses per second |
| J cm−2 |
GW cm−2 |
J cm−2 |
GW cm−2 |
|
L-Arginine 4-nitrophenolate 4-nitrophenol dihydrate (LAPP) |
25.4 |
2.54 |
24.0 |
2.4 |
7. PE loop.
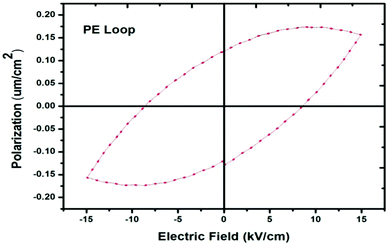
The ferroelectric properties were measured using a good quality single crystal that had an area of 20 mm2 and a thickness of 2.0 mm. To build an electrode across the surface of the crystal, silver paste was used and dried at 60 °C for 4 hours in order to make a fine coating over the crystal. The polarization versus electric field (P–E) hysteresis was obtained using a Radiant Ferroelectric Tester. The room temperature ferroelectric hysteresis loop at 2 Hz is shown in Fig. 9. From the curve, it was concluded that the response of the grown single crystal is difficult to sustain at a higher applied field. The P–E hysteresis of the crystal shows a low magnitude of polarization and its nature is to some extent more lossy capacitor, which may be due to a semiconducting nature of the crystal matrix.
 |
| | Fig. 9 A curve of the polarization vs. applied electric field. | |
8. Nanoindentation studies.
Stiffness, strength and toughness are the three main parameters of a material in terms of its mechanical parameters. These properties reveal the resistance offered by a solid towards elastic and plastic deformations, and cracking of the material. Besides the electrical, physical and optical properties of a material, there is a need to be familiar with the mechanical stability of a material, in terms of use in photonics devices and other applications. For the present paper, a nanoindentation technique was used to measure the hardness of the material and elastic moduli at the nanoscale.30 To measure the hardness, the load and the projected contact area have to be known. A three-side pyramidal Berkovich diamond indenter was used for performing the nanoindentation measurements, which had a nominal edge radius of 20 nm (faces 65.3° from the vertical axis) and was attached to a fully calibrated nanoindenter (TTX-NHT, CSM Instruments). The tests were carried out under progressive multicycle loading with an acquisition rate of 10 Hz. The approach speed was maintained at 2000 nm min−1 with a load range of 5 to 150 mN. The loading and unloading speeds during measurement were kept constant at 20 mN min−1, with a dwell time of 10 seconds and a pause time of 10 seconds between each cycle. Commonly, the material surface is indented using an indenter of known force to measure the hardness of the exposed surface. A standard Oliver and Pharr method was used for analysis of the obtained results.31 We can plot a loading and unloading curve using the relation:where F is the load applied to the single crystal, α and m are experimental parameters, hf is the final displacement after completion of the loading and unloading curve. From the slope of the unloading curve we can estimate the stiffness of the sample, using:| |  | (16) |
Furthermore, the stiffness calculated from the above equation can be used to evaluate the contact depth, which is then used to calculate the hardness.| |  | (17) |
where ε is equal to 0.75, which is an indenter constant, hmax is the maximum displacement of the indenter on application of the load to the crystal, and hc is the contact depth. The hardness of the material can be calculated using the equation:| |  | (18) |
where H is the hardness of the material, Fmax is the maximum indenter load applied to the material and A is the area of contact for the indentor. The load independent hardness is denoted as H0, which can be calculated using the empirical relation:where the constant K, with a value of 1/24.5, depends on the geometry of the indenter used in the experiment, while a2 is a constant that can be estimated from fitting of the curve of peak load vs. contact depth. The Young's modulus can be evaluated from the unloading curve using the formula:| |  | (20) |
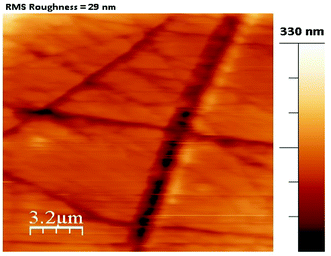
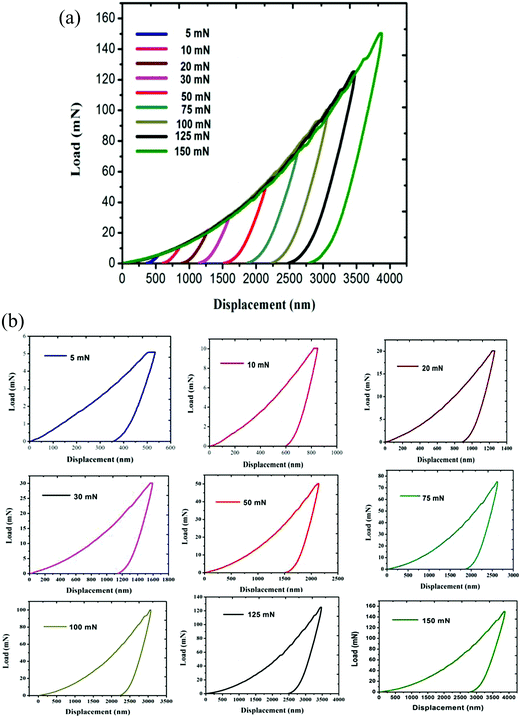
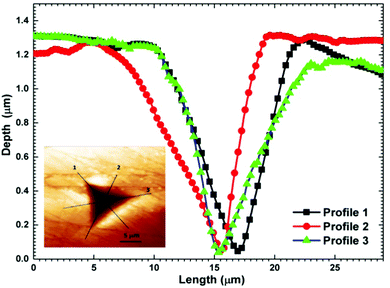
For the present study, a well-polished surface of LAPP was subjected to nanoindentation. The value calculated for the RMS roughness parameter of 29 nm was obtained using Atomic Force Microscopy (AFM) in contact mode. In order to attain a smooth surface, polishing was performed, which generated the scratch lines visible in Fig. 10. The tests were conducted at various indentation depths to study the effect of the indentation depth on the mechanical properties of the LAPP single crystal. Fig. 11(a) presents the load displacement curve obtained from the (001) plane of the LAPP single crystal with different loads using a Berkovich tip. In crystalline materials, mutual interactions and the motion of dislocations are responsible for strain hardening mechanisms, which support stable plastic flow.32 Whenever there is plastic deformation nucleation due to defects like dislocations, point defects etc. in the single crystal, there is a transformation from the elastic to the elastic/plastic region.33 This transformation can be related to slight pop-in events from 30 mN to 150 mN, which are clearly visible in the expanded views of the load displacement curve in Fig. 11(b). Table 5 shows different parameters calculated from the equations provided in the above sections. After indentation, a cavity was observed within the crystal (typical impression made by a 50 mN force) as shown in Fig. 12, which presents cross section profiles for the depth with a 50 mN load. It is clearly visible that the nanoindentation depth profile has a good correlation with the profile from the AFM. Optical images of the LAPP single crystal before and after applying the load are shown in Fig. 13, which indicates the formation of cracks within the single crystal. A contact depth vs. peak load curve is shown in Fig. 14, which has a continuously increasing trend. This is because of the dependency of the hardness, which demonstrates that the indentation size can affect the hardness of the material, which corresponds to the estimations of contact depth and peak load.34 The contact depth, peak load and hardness of the material are related through:| | | Fmax = a0 + a1hc + a2hc2 | (21) |
For measuring the load independent hardness, a polynomial curve was fitted to obtain the coefficients a0, a1 and a2. The obtained value for the a2 coefficient was 1.101 ×10⁻⁵ mN nm−2. Also, by using eqn (19), the calculated independent hardness was found to be 0.450 GPa or 450 MPa. These results reveal that the grown single crystal has a higher mechanical strength compared to some reported organic single crystals, such as L-prolinium tartrate (LPT)34 and L-threonine picrate (LTP).25 Thus, the title compound favors a high resistance towards deformation. Furthermore, Young’s modulus values, which were extracted from the loading/unloading curve of LAPP, were plotted against the peak load as shown in Fig. 15. There was a significant decrement as the load increased. This is due to the increased load offered by the Berkovich tip, which increases the strain in the LAPP single crystal. Fig. 16 shows the variation of initial unloading stiffness S, with the contact depth at various peak loads ranging from 5 to 150 mN for the LAPP single crystal. The relation between the stiffness and the contact depth hc is given as:where a is a constant that depends on the indentation tip rounding and b is the slope of the linear fit related to the reduced Young's modulus. A linear relationship was observed between the initial unloading stiffness S and the contact depth at the peak load. The reduced Young's modulus (b) was extracted from the slope of the linear fitted curve. The slope was found to be 6.614 × 10⁻⁵ mN nm−2. The reduced Young's modulus was estimated to be 66.14 GPa for the indentation made on the LAPP single crystal. The intercept (a) was found to be 0.024. The best linear fit curve should pass through the origin, but due to indenter tip rounding a much larger value for the intercept (0.024) was observed.
 |
| | Fig. 10 RMS roughness parameter for the plane (001) of LAPP. | |
 |
| | Fig. 11 (a) Load displacement curve obtained from the (001) plane of the LAPP single crystal; (b) expanded view of the load displacement curve. | |
Table 5 Different obtained parameters related to the mechanical properties of the LAPP single crystal along the (001) plane
| (001) plane |
|
F (mN) |
Hit (MPa) |
H
V (Vickers) |
Eit (GPa) |
h
m (nm) |
S (mN nm−1) |
h
c (nm) |
h
r (nm) |
h
p (nm) |
A
P (nm−2) |
m
|
| 5.086 |
1511.764 |
21.758 |
140.006 |
533.059 |
0.05 |
457.788 |
431.588 |
363.899 |
3![[thin space (1/6-em)]](https://www.rsc.org/images/entities/char_2009.gif) 364 364![[thin space (1/6-em)]](https://www.rsc.org/images/entities/char_2009.gif) 468 468 |
1.624 |
| 10.049 |
1324.892 |
19.977 |
122.699 |
848.615 |
0.069 |
740.837 |
703.427 |
608.959 |
7![[thin space (1/6-em)]](https://www.rsc.org/images/entities/char_2009.gif) 585 585![[thin space (1/6-em)]](https://www.rsc.org/images/entities/char_2009.gif) 141 141 |
1.613 |
| 20.062 |
1181.814 |
18.479 |
109.449 |
1260.96 |
0.096 |
1106.13 |
1051.801 |
906.323 |
16![[thin space (1/6-em)]](https://www.rsc.org/images/entities/char_2009.gif) 975 975![[thin space (1/6-em)]](https://www.rsc.org/images/entities/char_2009.gif) 906 906 |
1.655 |
| 30.045 |
1045.139 |
18.011 |
96.791 |
1594.115 |
0.122 |
1411.788 |
1347.271 |
1168.843 |
28![[thin space (1/6-em)]](https://www.rsc.org/images/entities/char_2009.gif) 747 747![[thin space (1/6-em)]](https://www.rsc.org/images/entities/char_2009.gif) 216 216 |
1.687 |
| 50.089 |
906.034 |
16.065 |
83.909 |
2140.974 |
0.151 |
1895.961 |
1808.878 |
1568.158 |
55![[thin space (1/6-em)]](https://www.rsc.org/images/entities/char_2009.gif) 283 283![[thin space (1/6-em)]](https://www.rsc.org/images/entities/char_2009.gif) 560 560 |
1.704 |
| 75.057 |
875.501 |
14.898 |
81.081 |
2625.28 |
0.174 |
2306.799 |
2194.83 |
1914.428 |
85![[thin space (1/6-em)]](https://www.rsc.org/images/entities/char_2009.gif) 730 730![[thin space (1/6-em)]](https://www.rsc.org/images/entities/char_2009.gif) 392 392 |
1.662 |
| 100.069 |
809.116 |
14.844 |
74.933 |
3072.567 |
0.209 |
2717.651 |
2593.058 |
2284.197 |
1.24 × 10+8 |
1.657 |
| 125.044 |
774.419 |
13.991 |
71.72 |
3474.496 |
0.225 |
3062.916 |
2918.565 |
2563.887 |
1.61 × 10+8 |
1.653 |
| 150.078 |
728.015 |
13.388 |
67.422 |
3876.458 |
0.243 |
3418.929 |
3259.705 |
2884.885 |
2.06 × 10+8 |
1.623 |
 |
| | Fig. 12 Depth profiles of the indentation imprint after applying a 50 mN load. Inset shows the imprint made after indentation. | |
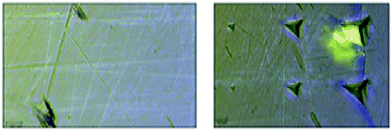 |
| | Fig. 13 Optical images of the LAPP single crystal before and after indentation. | |
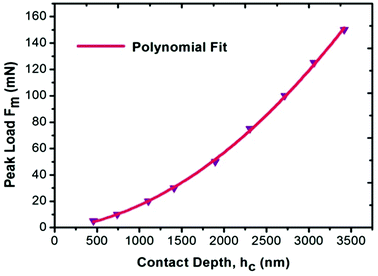 |
| | Fig. 14 Curve of the peak load vs. contact depth for the LAPP single crystal. | |
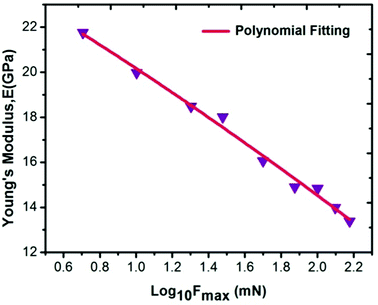 |
| | Fig. 15 Variation of Young's modulus as a function of the log of the peak load for the LAPP single crystal. | |
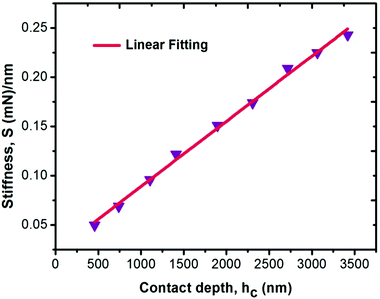 |
| | Fig. 16 Variation of stiffness as a function of contact depth for the LAPP single crystal. | |
Conclusion
A good quality LAPP single crystal was successfully grown using a conventional slow evaporation solution growth technique. To determine the stability of the compound for device fabrication, the grown single crystal was subjected to various characterization techniques. The lattice dimensions of the title compound were confirmed using single crystal X-ray diffraction analysis. A quantitative value for the strain present in the single crystal was calculated using Hall–Williamson's equation. Its functional groups were identified using HETCOR and Raman analysis. The UV-vis-NIR spectrum revealed that the crystal shows high transmittance in the visible and NIR regions. Its optical parameters were determined using a Tauc relation. Thermal analyses showed that LAPP has a relatively larger specific heat capacity compared to other single crystals reported in earlier studies. The laser damage threshold was determined in order to evaluate the crystal’s stability towards the laser beam. Nanoindentation results revealed that the title compound has a better mechanical strength than some recently reported organic materials. Thus it has a greater capability to withstand deformation caused by applying various loads.
Acknowledgements
The authors are highly thankful to Dr D. K. Aswal, Director, NPL for his continuous support and encouragement. One of the authors Sonia acknowledges CSIR, New Delhi, for a JRF Fellowship. One of the authors Budhendra Singh would like to express his personal thanks to FCT (Fundação para a Ciência e a Tecnologia, Portugal, funded by NSRF-POPH) for the SFRH/BPD/76184/2011 grant.
References
-
D. S. Chemla and J. Zyss, Nonlinear Optical Properties of Molecules and Crystals, Academic Press, New York, 1987 Search PubMed.
- B. A. Fuchs, C. Ksyn and S. P. Veisko, Appl. Opt., 1989, 28, 4465–4472 CrossRef CAS PubMed.
-
Nonlinear Optical Properties of Organic Molecules and Crystals, ed. J. F. Nicoud, R. J. Twieg, D. S. Chemla and J. E. Zyss, Academic Press, London, 1987 Search PubMed.
- S. B. Monaco, L. E. Davis, S. P. Velsko, F. T. Wang, D. Eimerl and A. Zalkin, J. Cryst. Growth, 1987, 85, 252–255 CrossRef CAS.
- X. Dong, J. M. Hua and T. Z. Ke, Acta Chim. Sin., 1983, 1, 230–233 CrossRef.
- D. Xu, X. Q. Wang, W. T. Yu, S. X. Xu and G. H. Zhang, J. Cryst. Growth, 2003, 253, 481–487 CrossRef CAS.
- Z. H. Sun, G. H. Zhang, X. Q. Wang, Z. L. Gao, X. F. Cheng, S. J. Zhang and D. Xu, Cryst. Growth Des., 2009, 9, 3251 CAS.
- V. V. Ghazaryan, B. A. Zakharov, A. M. Petrosyan and E. V. Boldyreva, Acta Crystallogr., Sect. C: Struct. Chem., 2015, 71, 415–421 CAS.
- A. Yokotani, T. Sasaki, K. Yoshida and S. Nakai, Appl. Phys. Lett., 1989, 55, 2692–2693 CrossRef CAS.
- G. Dhanaraj, M. R. Srinivasan and H. L. Bhat, Raman Spectrosc., 1991, 22, 177–181 CrossRef CAS.
- P. Srinivasan, Y. Vidyalakshmi and R. Gopalakrishnan, Cryst. Growth Des., 2008, 8, 2329–2334 CAS.
- K. Parasuraman, K. S. Sakthi, R. S. Selvaraj, S. J. Das, R. Uthrakumar and B. M. Boaz, Optik, 2014, 125, 3534–3539 CrossRef CAS.
- M. Muthuraman, M. Bagieu-Beucher, R. Masse, J.-F. Nicoud and G. R. Desiraju, J. Mater. Chem., 1999, 9, 1471–1479 RSC.
- L. N. Wang, X. Q. Wang, G. H. Zhang, X. T. Liu, Z. H. Sun, G. H. Sun, L. Wang, W. T. Yu and D. Xu, J. Cryst. Growth, 2011, 327, 133–139 CrossRef CAS.
- M. Mahadevan, K. Ramachandran, P. Anandan, M. Arivanandhan, G. Bhagavannarayana and Y. Hayakawa, Spectrochim. Acta, Part A, 2014, 133, 396–402 CrossRef CAS PubMed.
- K. Thukral, N. Vijayan, Sonia, D. Haranath, K. K. Maurya, J. Philip and V. Jayaramakrishnan, Arabian J. Chem., 2015 DOI:10.1016/j.arabjc.2015.08.022.
-
D. C. G. A. Pinto, C. M. M. Santos and A. M. S. Silva, Recent Research Developments in cyclic Chemistry, Research Signpost, Trivandrum, 2007, pp. 397–475 Search PubMed.
-
J. A. Dean, Analytical Chemistry Handbook, McGraw-Hill, New York, 1995 Search PubMed.
- A. Krishna, N. Vijayan, B. Riscob, B. S. Gour, D. Haranath, J. Philip, S. Verma, M. S. Jayalakshmy, G. Bhagavannarayana and S. K. Halder, Appl. Phys. A: Mater. Sci. Process., 2014, 114, 1257–1265 CrossRef CAS.
- S. Suresh, P. Mani and K. Anand, Int. J. Comput. Appl., 2012, 43, 0975–8887 Search PubMed.
- N. M. Ravindra, R. P. Bharadwaj, K. Sunil Kumar and V. K. Srivastava, Infrared Phys., 1981, 21, 369–381 CrossRef CAS.
- N. M. Ravindra and V. K. Srivastava, Infrared Phys., 1980, 20, 67–69 CrossRef CAS.
- P. Koteeswari, S. Suresh and P. Mani, Am. J. Condens. Matter Phys., 2012, 2, 116–119 CrossRef.
- C. P. Menon and J. Phillip, Meas. Sci. Technol., 2000, 11, 1744–1749 CrossRef CAS.
- A. Krishna, N. Vijayan, S. Gupta, K. Thukral, V. Jayaramakrishnan, B. Singh, J. Philip, S. Das, K. K. Maurya and G. Bhagavannarayana, RSC Adv., 2014, 4, 56188–56199 RSC.
-
J. Philip, in Ferroelectrics – Physical Effects, ed. M. Lallart, InTech, 2011 Search PubMed.
- R. Mohandoss, S. Dhanuskodi, M. S. Jayalakshmy, J. Philip and G. Bhagavannarayana, Cryst. Res. Technol., 2012, 47, 620–629 CrossRef.
- N. Rani, N. Vijayan, B. Riscob, S. Karan Jat, A. Krishna, S. Dhas, G. Bhagvannarayana, B. Rathi and M. A. Wahab, CrystEngComm, 2013, 15, 2127–2132 RSC.
- S. Vanishri, H. L. Bhat, A. Deepthy, V. P. N. Nampoori, E. D. Gomes and M. Belsley, J. Appl. Phys., 2006, 99, 083107 CrossRef.
- D. Tabor, The hardness of solids, Rev. Phys. Technol., 1970, 1, 145–179 CrossRef.
- W. C. Oliver and G. M. Pharr, J. Mater. Res., 1992, 7, 1564–1583 CrossRef CAS.
- C. A. Schuh, Mater. Today, 2006, 9, 32–40 CrossRef CAS.
- I. Bdikin, B. Singh, J. S. Kumar, M. P. F. Graca, A. M. Balbashov, J. Grácio and A. L. Kholkin, Scr. Mater., 2014, 74, 76–79 CrossRef CAS.
- K. Thukral, N. Vijayan, B. Singh, I. Bdikin, D. Haranath, K. K. Maurya, J. Philip, H. Soumya, P. Sreekanth and G. Bhagavannarayana, CrystEngComm, 2014, 16, 9245–9254 RSC.
|
| This journal is © the Partner Organisations 2017 |
Click here to see how this site uses Cookies. View our privacy policy here.  ab,
Prashant
Kumar
c,
Budhendra
Singh
 d,
Subhasis
Das
e,
Rajnikant
f and
Soumya
H.
g
![[thin space (1/6-em)]](https://www.rsc.org/images/entities/char_2009.gif) :
:![[thin space (1/6-em)]](https://www.rsc.org/images/entities/char_2009.gif) 2 molar ratio13 and dissolving them in double distilled water, which acts as a solvent. After that, the prepared solution was kept on a magnetic stirrer for homogenization for a period of 4 hours and then filtered to remove the impurities using Whatmann filter paper. The synthesis process was carried out at a temperature of 45 °C. The synthesized salt was used for growing the single crystal of the title compound. The synthesized salt was again dissolved in distilled water at a temperature of 40 °C to make a saturated solution of LAPP. The resulting solution was then kept in a constant temperature bath with an accuracy of ±0.01 °C at 40 °C. After 20 days, a good quality transparent single crystal was taken out from the solution, which had dimensions of 6 × 7 × 3 mm3 as shown in Fig. 1.
2 molar ratio13 and dissolving them in double distilled water, which acts as a solvent. After that, the prepared solution was kept on a magnetic stirrer for homogenization for a period of 4 hours and then filtered to remove the impurities using Whatmann filter paper. The synthesis process was carried out at a temperature of 45 °C. The synthesized salt was used for growing the single crystal of the title compound. The synthesized salt was again dissolved in distilled water at a temperature of 40 °C to make a saturated solution of LAPP. The resulting solution was then kept in a constant temperature bath with an accuracy of ±0.01 °C at 40 °C. After 20 days, a good quality transparent single crystal was taken out from the solution, which had dimensions of 6 × 7 × 3 mm3 as shown in Fig. 1.

![[thin space (1/6-em)]](https://www.rsc.org/images/entities/i_char_2009.gif) cos
cos![[thin space (1/6-em)]](https://www.rsc.org/images/entities/char_2009.gif) θ vs. sin
θ vs. sin![[thin space (1/6-em)]](https://www.rsc.org/images/entities/char_2009.gif) θ, as shown in Fig. 3(b). A straight line can be fitted to the curve and the slope of the line represents the strain, which was found to be – 0.8 × 10⁻³.
θ, as shown in Fig. 3(b). A straight line can be fitted to the curve and the slope of the line represents the strain, which was found to be – 0.8 × 10⁻³.
![[double bond, length as m-dash]](https://www.rsc.org/images/entities/char_e001.gif) O in-plane deformation was observed at 629 cm−1. The peaks at 855 cm−1 and 873 cm−1 show C–C stretching; however a peak for C–C–N asymmetric stretching was found at 1105 cm−1. Peaks for OH in plane bending and C–C aliphatic chain vibrations were observed at 1165 cm−1 and 1266 cm−1 respectively. A peak at 1290 cm−1 was attributed to NO2 symmetric stretching and a peak for C–O stretching was found at 1326 cm−1. A peak for COO– symmetric bending and two phenyl stretching peaks were observed at 1463 cm−1, 1563 cm−1 and 1593 cm−1, respectively. Peaks at 2944 cm−1, 2979 cm−1 and 3075 cm−1 represent NH3+ symmetric stretching, CH2 asymmetric stretching and O–H stretching, respectively.
O in-plane deformation was observed at 629 cm−1. The peaks at 855 cm−1 and 873 cm−1 show C–C stretching; however a peak for C–C–N asymmetric stretching was found at 1105 cm−1. Peaks for OH in plane bending and C–C aliphatic chain vibrations were observed at 1165 cm−1 and 1266 cm−1 respectively. A peak at 1290 cm−1 was attributed to NO2 symmetric stretching and a peak for C–O stretching was found at 1326 cm−1. A peak for COO– symmetric bending and two phenyl stretching peaks were observed at 1463 cm−1, 1563 cm−1 and 1593 cm−1, respectively. Peaks at 2944 cm−1, 2979 cm−1 and 3075 cm−1 represent NH3+ symmetric stretching, CH2 asymmetric stretching and O–H stretching, respectively.![[double bond, length as m-dash]](https://www.rsc.org/images/entities/char_e001.gif) O in plane of deformation
O in plane of deformation


![[thin space (1/6-em)]](https://www.rsc.org/images/entities/char_2009.gif) 364
364![[thin space (1/6-em)]](https://www.rsc.org/images/entities/char_2009.gif) 468
468![[thin space (1/6-em)]](https://www.rsc.org/images/entities/char_2009.gif) 585
585![[thin space (1/6-em)]](https://www.rsc.org/images/entities/char_2009.gif) 141
141![[thin space (1/6-em)]](https://www.rsc.org/images/entities/char_2009.gif) 975
975![[thin space (1/6-em)]](https://www.rsc.org/images/entities/char_2009.gif) 906
906![[thin space (1/6-em)]](https://www.rsc.org/images/entities/char_2009.gif) 747
747![[thin space (1/6-em)]](https://www.rsc.org/images/entities/char_2009.gif) 216
216![[thin space (1/6-em)]](https://www.rsc.org/images/entities/char_2009.gif) 283
283![[thin space (1/6-em)]](https://www.rsc.org/images/entities/char_2009.gif) 560
560![[thin space (1/6-em)]](https://www.rsc.org/images/entities/char_2009.gif) 730
730![[thin space (1/6-em)]](https://www.rsc.org/images/entities/char_2009.gif) 392
392


