Aggregation-induced emission nanoparticles as photosensitizer for two-photon photodynamic therapy†
Nuernisha
Alifu
a,
Xiaobiao
Dong
b,
Dongyu
Li
a,
Xianhe
Sun
a,
Abudureheman
Zebibula
c,
Deqing
Zhang
b,
Guanxin
Zhang
*b and
Jun
Qian
 *a
*a
aState Key Laboratory of Modern Optical Instrumentations, Center for Optical and Electromagnetic Research, JORCEP (Sino-Swedish Joint Research Center of photonics) Zhejiang University, Hangzhou 310058, China. E-mail: qianjun@zju.edu.cn
bBeijing National Laboratory for Molecular Sciences, CAS Key Laboratory of Organic Solids, Institute of Chemistry, Chinese Academy of Sciences, Beijing 100190, China. E-mail: gxzhang@iccas.ac.cn
cDepartment of Urology, Sir Run-Run Shaw Hospital College of Medicine, Zhejiang University, Hangzhou 310016, China
First published on 26th June 2017
Abstract
Two-photon excited fluorescence microscopy and nanoparticle-assisted photodynamic therapy (PDT) are two important areas in biomedical research, and their combination can be more beneficial. A type of red emissive photosensitizer (PS) with aggregation-induced emission (AIE) features, which is called tetraphenylethylene (TPE-red), was synthesized and further encapsulated with poly(styrene-co-maleic anhydride) (PSMA) to form nanoparticles. Two-photon fluorescence, as well as two-photon excited reactive oxygen species (ROS) generation by TPE-red–PSMA nanoparticles, was characterized. A large two-photon absorption cross-section was observed at 1040 nm with a femtosecond (fs) laser. PDT via two-photon excitation was well realized on tumor cells, using TPE-red–PSMA nanoparticles as PSs under 1040 nm fs laser excitation. Based on our study, we believe that two-photon excited PDT with AIE-active PSs has great potential applications in deep tissue imaging-guided therapy.
Introduction
Imaging-guided therapy (IGT) has attracted much attention of biomedical researchers and doctors since it can be applied in precise medical diagnosis and therapy.1 Photodynamic therapy (PDT) has been one of the most prominent strategies in IGT due to its good selectivity, low invasion and low toxicity.2,3 The implementation of PDT requires three key components: a photosensitizer (PS), reactive oxygen species (ROS), and a light source for irradiation.4,5 As the most critical element, PSs can be stimulated to the excited state using an excitation light source. After a series of energy level transition processes, it can transfer energy to oxygen or oxygen-containing groups in the surrounding environment and finally generate ROS.6 Generally, PDT aims to achieve deep tissue penetration, and PSs with high ROS generation efficiency, low photobleaching, strong fluorescence, high chemical stability, as well as high uptake by targeted cells/tissue are required.7,8 The commonly used PSs for PDT are porphyrin derivatives.9 However, most porphyrin derivatives are hydrophobic, and they are unstable in biological environment. To solve this problem, one possible way is to encapsulate them to form aqueous-dispersive nanoparticles. However, porphyrin derivatives have a negative effect, which is called aggregation-caused quenching (ACQ). The ACQ effect leads to a dramatic reduction in the fluorescence and ROS generation efficiency of porphyrin derivatives when they form nanoaggregates in nanoparticles.10,11 Fortunately, Tang and his co-workers discovered the phenomenon of aggregation-induced emission (AIE) in 2001, which is exactly opposite to the ACQ effect, and can be a better solution to this problem.12 AIE molecules are non-emissive in benign solvents, but they become highly emissive in the aggregation state due to the restriction of intramolecular motions.13,14 Thus, when AIE-active PSs are encapsulated in nanoparticles, the fluorescence brightness, biocompatibility and anti-photobleaching ability can be greatly enhanced. Moreover, the ROS generation efficiency of the encapsulated PSs is also well maintained. It will be more helpful to improve both bioimaging quality and PDT effect.15,16 Thus far, several research groups have carried out correlative studies and obtained some exciting results.17,18The imaging depth and spatial resolution significantly matter in imaging-guided PDT on diseases in deep tissues and some vulnerable organs like the eyes19a and the brain,19b which makes two-photon excited fluorescence microscopy equipped with NIR excitation a favored technology in PDT, generating a new area called two-photon excited PDT. Using NIR light as the excitation source brings in less autofluorescence, and the NIR light can penetrate deeper into bio-tissues due to its low scattering and relatively low absorption effect on them.20 In addition, two-photon excitation can also provide high resolution and low out-of-focus photodamage, realizing precise PDT.21,22
During the past few years, two-photon excited PDT has been performed on in vitro cells, based on various photosensitizers and nanoparticles (gold nanorods23–25/nanocages,26 conjugated polymer nanoparticles,27 quantum dots,28 porphyrin,29–33 mesoporous silica nanoparticles,34 carbon nanodots,35etc.36), under the 700–900 nm fs excitation. In addition, our group realized in vitro three-photon excited PDT for the first time with HPPH-doped silica nanoparticles, under 1550 nm fs laser excitation.36 Very recently, Wang's group utilized polymer nanoparticles as PSs, achieving two-photon excited PDT of in vivo tumors, under 800 nm fs laser excitation.37
AIE nanoparticles are very suitable for two-photon-related applications. By increasing the amount of the encapsulated AIE molecules inside the nanoparticles, both the two-photon absorption property and the quantum yield of AIE nanoparticles can be easily enhanced. Thus, AIE nanoparticles have been used as promising fluorescent bioprobes for various in vitro and in vivo two-photon fluorescence bioimaging.38 However, to the best of our knowledge, there is still no report concerning two-photon excited PDT based on AIE nanoparticles.
Herein, we combined both two-photon excited PDT and nanotechnology. A type of red-emissive PS (singlet oxygen generation efficiency was 0.3239) with AIE features, namely tetraphenylethylene (TPE-red), was synthesized according to our previous report40 and encapsulated with poly(styrene-co-maleic anhydride) (PSMA). Based on an upright scanning microscopic system equipped with a 1040 nm fs laser as the excitation light source, intracellular ROS generation of nanoparticles was indirectly observed using a ROS indicator. Furthermore, the TPE-red–PSMA nanoparticles were used for incubation with HeLa cells for two-photon PDT. We simultaneously realized two-photon fluorescence imaging and two-photon excited PDT on HeLa cells. Our results can provide a good basis for follow-up in vivo experiments.
Results and discussion
Synthesis and characterization of TPE-red–PSMA nanoparticles
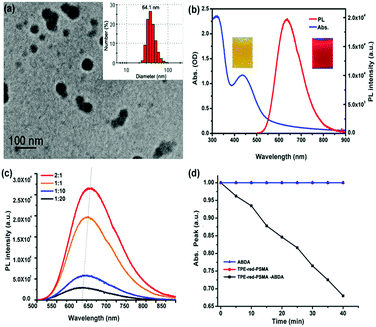
As shown in Fig. 1, the synthesis process of TPE-red–PSMA nanoparticles was facile and convenient. The maleic anhydride units of PSMA molecules were hydrolyzed in the aqueous environment, and they generated carboxyl groups on the surface of nanoparticles. The TPE-red–PSMA nanoparticles were dispersed clearly and stably in water. The morphology and hydrodynamic size distribution of the as-synthesized TPE-red–PSMA nanoparticles (with a weight ratio of TPE-red![[thin space (1/6-em)]](https://www.rsc.org/images/entities/char_2009.gif) :
:![[thin space (1/6-em)]](https://www.rsc.org/images/entities/char_2009.gif) PSMA = 2
PSMA = 2![[thin space (1/6-em)]](https://www.rsc.org/images/entities/char_2009.gif) :
:![[thin space (1/6-em)]](https://www.rsc.org/images/entities/char_2009.gif) 1) were characterized by TEM and dynamic light scattering (DLS), as shown in Fig. 2a. TPE-red–PSMA nanoparticles have an average size of ∼64.1 nm with a low polydispersity. The number of TPE-red molecules in each TPE-red nanoparticle was calculated as ∼1.068 × 10⁵ (the detailed calculation can be found in the ESI†).
1) were characterized by TEM and dynamic light scattering (DLS), as shown in Fig. 2a. TPE-red–PSMA nanoparticles have an average size of ∼64.1 nm with a low polydispersity. The number of TPE-red molecules in each TPE-red nanoparticle was calculated as ∼1.068 × 10⁵ (the detailed calculation can be found in the ESI†).
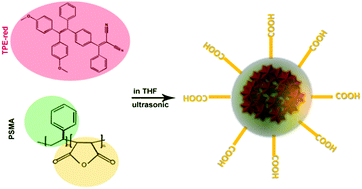 | ||
| Fig. 1 Chemical structures of TPE-red and PSMA, and schematic illustration of the synthesis of TPE-red–PSMA nanoparticles. | ||
Fig. 2b shows the absorption (blue line) and one-photon fluorescence spectra (red line) of TPE-red–PSMA nanoparticles in aqueous dispersion. TPE-red–PSMA nanoparticles were found to have the absorption peaks at 340 nm and 450 nm and the fluorescence peak at 640 nm (with deep red fluorescence emission). Furthermore, TPE-red–PSMA nanoparticles with various weight ratios (TPE-red![[thin space (1/6-em)]](https://www.rsc.org/images/entities/char_2009.gif) :
:![[thin space (1/6-em)]](https://www.rsc.org/images/entities/char_2009.gif) PSMA = 1
PSMA = 1![[thin space (1/6-em)]](https://www.rsc.org/images/entities/char_2009.gif) :
:![[thin space (1/6-em)]](https://www.rsc.org/images/entities/char_2009.gif) 20, 1
20, 1![[thin space (1/6-em)]](https://www.rsc.org/images/entities/char_2009.gif) :
:![[thin space (1/6-em)]](https://www.rsc.org/images/entities/char_2009.gif) 10, 1
10, 1![[thin space (1/6-em)]](https://www.rsc.org/images/entities/char_2009.gif) :
:![[thin space (1/6-em)]](https://www.rsc.org/images/entities/char_2009.gif) 1, 2
1, 2![[thin space (1/6-em)]](https://www.rsc.org/images/entities/char_2009.gif) :
:![[thin space (1/6-em)]](https://www.rsc.org/images/entities/char_2009.gif) 1) were prepared by mixing different amounts of PSMA with the constant amount of TPE-red (1 mg) in similar volumes of water (1 mL) (Fig. S1a, ESI†). As shown in Fig. 2c, the fluorescence intensity of TPE-red–PSMA nanoparticles (with same amounts of TPE-red) increased and red-shifted with the increasing weight ratio (TPE-red
1) were prepared by mixing different amounts of PSMA with the constant amount of TPE-red (1 mg) in similar volumes of water (1 mL) (Fig. S1a, ESI†). As shown in Fig. 2c, the fluorescence intensity of TPE-red–PSMA nanoparticles (with same amounts of TPE-red) increased and red-shifted with the increasing weight ratio (TPE-red![[thin space (1/6-em)]](https://www.rsc.org/images/entities/char_2009.gif) :
:![[thin space (1/6-em)]](https://www.rsc.org/images/entities/char_2009.gif) PSMA) (Fig. S1b, ESI†), which preliminarily proved the AIE properties of TPE-red–PSMA. Thus, TPE-red–PSMA nanoparticles with a weight ratio of 2
PSMA) (Fig. S1b, ESI†), which preliminarily proved the AIE properties of TPE-red–PSMA. Thus, TPE-red–PSMA nanoparticles with a weight ratio of 2![[thin space (1/6-em)]](https://www.rsc.org/images/entities/char_2009.gif) :
:![[thin space (1/6-em)]](https://www.rsc.org/images/entities/char_2009.gif) 1 have the longest peak emission wavelength and the brightest fluorescence, which are more suitable for bioimaging with a high signal-to-noise ratio. In order to further confirm the AIE characteristics of TPE-red molecules inside the nanoparticles, we utilized PSMA to encapsulate TPE-red, 9-diethylamino-5H-benzo[alpha]-phenoxazine-5-one (Nile red) (a type of ACQ dye), and commercial photosensitizers Photochlor (HPPH) and Chlorin e6 (Ce6) (both of them have the ACQ feature). For the four types of nanoparticles, the net concentration of the encapsulated dyes/photosensitizers, as well as the weight ratio of dyes/photosensitizers to PSMA, was kept constant. Under the ultraviolet light irradiation, HPPH–PSMA, Nile-red–PSMA and TPE-red–PSMA nanoparticles showed no fluorescence emission because, after the PSMA encapsulation, the HPPH, Nile-red and TPE-red molecules aggregated inside the nanoparticles, and their fluorescence was quenched due to the ACQ effect. However, TPE-red–PSMA nanoparticles exhibited very bright orange fluorescence (Fig. S2b, ESI†), due to the AIE effect of TPE-red molecules.
1 have the longest peak emission wavelength and the brightest fluorescence, which are more suitable for bioimaging with a high signal-to-noise ratio. In order to further confirm the AIE characteristics of TPE-red molecules inside the nanoparticles, we utilized PSMA to encapsulate TPE-red, 9-diethylamino-5H-benzo[alpha]-phenoxazine-5-one (Nile red) (a type of ACQ dye), and commercial photosensitizers Photochlor (HPPH) and Chlorin e6 (Ce6) (both of them have the ACQ feature). For the four types of nanoparticles, the net concentration of the encapsulated dyes/photosensitizers, as well as the weight ratio of dyes/photosensitizers to PSMA, was kept constant. Under the ultraviolet light irradiation, HPPH–PSMA, Nile-red–PSMA and TPE-red–PSMA nanoparticles showed no fluorescence emission because, after the PSMA encapsulation, the HPPH, Nile-red and TPE-red molecules aggregated inside the nanoparticles, and their fluorescence was quenched due to the ACQ effect. However, TPE-red–PSMA nanoparticles exhibited very bright orange fluorescence (Fig. S2b, ESI†), due to the AIE effect of TPE-red molecules.
The one-photon excited ROS detection was performed upon the 450 nm-CW laser irradiation. ABDA was added to the aqueous dispersion of TPE-red–PSMA nanoparticles, and the absorption intensity of ABDA at 375 nm was monitored, which was performed as an indirect method to characterize the generation efficiency of ROS from TPE-red–PSMA nanoparticles. As shown in Fig. 2d, the absorption intensity of ABDA (at 375 nm) had decreased significantly under continuous irradiation (black line), indicating that the nanoparticles could act as PSs. To confirm that the absorption decrease was really due to the ROS generated by TPE-red–PSMA nanoparticles, experiments with ABDA alone and TPE-red–PSMA nanoparticles alone were performed under the same experimental conditions. As shown in Fig. 2d, the 450 nm-CW irradiation (40 min) caused almost no change in the absorption of either TPE-red–PSMA nanoparticles (without ABDA) or ABDA (without TPE-red–PSMA nanoparticles). These control experiments demonstrated that the decrease in absorption at 375 nm was only due to the simultaneous presence of TPE-red–PSMA nanoparticles and ABDA, under 450 nm-CW irradiation.
Two-photon fluorescence of TPE-red–PSMA nanoparticles
Two-photon fluorescence of TPE-red–PSMA nanoparticles was excited by the 1040 nm fs laser, and its spectrum was measured via a spectrometer (PG2000, Ideaoptics Instruments), as shown in Fig. 3a. The aqueous dispersion of TPE-red–PSMA nanoparticles in the capillary was imaged using the two-photon fluorescence microscope, and a bright deep red fluorescence image could be observed, as shown in the inset of Fig. 3a. To confirm that the observed fluorescence was indeed emitted via two-photon excitation, a series of fluorescence intensities of TPE-red–PSMA nanoparticles under the 1040 nm fs excitation with various powers were measured, as shown in Fig. 3b. The fluorescence intensity of TPE-red–PSMA nanoparticles had a good linear proportion to the square of the 1040 nm fs excitation intensity, indicating the nonlinear two-photon absorption process.41 Two-photon absorption cross-sections (TPACSs) of the TPE-red molecule were measured at various wavelengths, and the values are shown in Fig. 3c. At 1040 nm, it was 27.72 GM.Two-photon fluorescence imaging
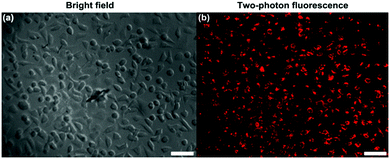
HeLa cells were treated with TPE-red–PSMA nanoparticles for 2 h. The upright scanning microscope (Olympus, BX61+FV1200) equipped with a 1040 nm fs laser (Fig. S4, ESI†) was used to perform two-photon fluorescence imaging of cancer cells. As shown in Fig. 4, TPE-red–PSMA nanoparticles could effectively stain HeLa cells with a high imaging contrast, according to their bright two-photon fluorescence signals.Two-photon excited ROS generation of TPE-red–PSMA nanoparticles
As shown in Fig. S3a (ESI†) (black line), the peak absorption (at 375 nm) of the mixture containing ABDA and TPE-red–PSMA nanoparticles decreased with the increase in 1040 nm fs irradiation time, suggesting ROS generation under two-photon excitation. To confirm that the absorption decrease was really due to ROS generated by TPE-red–PSMA nanoparticles, experiments with ABDA alone and TPE-red–PSMA nanoparticles alone were performed under the same experimental conditions, respectively. As shown in Fig. S3a (ESI†), the absorption (at 375 nm) of both TPE-red–PSMA nanoparticles (without ABDA, red line) and ABDA (without TPE-red–PSMA nanoparticles, blue line) was kept unchanged, even under the 1040 nm fs irradiation for 40 min. These control experiments demonstrated that the decrease in absorption of ABDA at 375 nm was only due to the simultaneous presence of TPE-red–PSMA nanoparticles and ABDA, under 1040 nm fs irradiation.Intracellular two-photon excited ROS
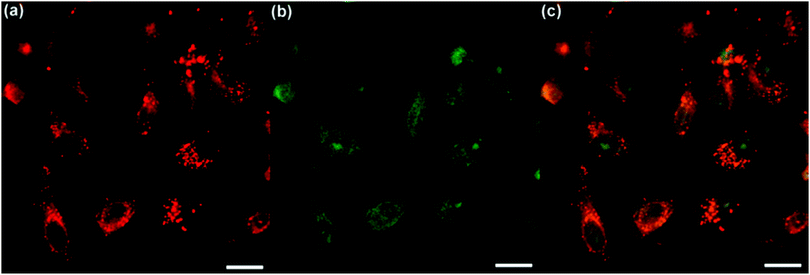
To evaluate the two-photon excited ROS generation efficiency of TPE-red–PSMA nanoparticles inside HeLa cells, a cell-permeable organic dye, 2′,7′-dichlorofluorescein diacetate (DCF-DA), was used. As a type of indicator of ROS generation, DCF-DA itself is non-emissive, but can be rapidly oxidized by ROS and can become a highly fluorescent dye called dichlorofluorescein (DCF). The fluorescence signals from the cells were detected in two channels. The red two-photon fluorescence signals of TPE-red–PSMA nanoparticles in the membrane of the cells are shown in Fig. 5a. The fluorescence signals from the green channel demonstrated the existence of the DCF. As shown in Fig. 5b, strong green two-photon fluorescence of DCF was observed inside cells, suggesting the ROS-generating capability of TPE-red–PSMA nanoparticles under 1040 nm fs irradiation. In contrast, as shown in Fig. S5a and c (ESI†), HeLa cells incubated with TPE-red–PSMA nanoparticles but without DCF-DA showed no fluorescence signals in the green channel upon 1040 nm fs irradiation. As shown in Fig. S5b and d (ESI†), HeLa cells treated with DCF-DA but without TPE-red–PSMA nanoparticles showed no fluorescence signals in either red channel or green channel upon 1040 nm fs irradiation. These results illustrated that TPE-red–PSMA nanoparticles inside cells could generate ROS under two-photon excitation.Two-photon excited in vitro PDT
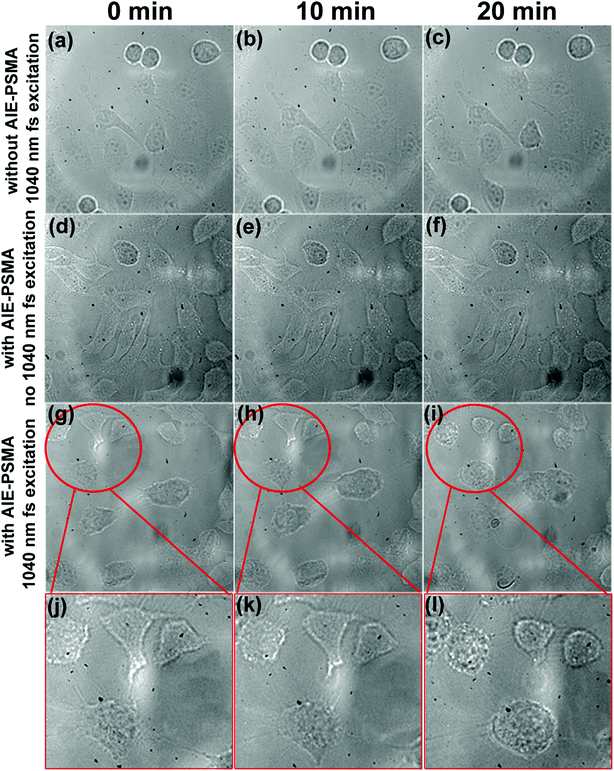
As shown in Fig. 6g–i, transmission images of HeLa cells were captured during two-photon excited PDT process. After 20 min irradiation, the morphological changes of HeLa cells became more evident (cells became round), and even some necrosis appeared as shown in Fig. 6l. As shown in Fig. 6a–f, two control experiments were performed under the same two-photon excitation conditions. In one control experiment (Fig. 6a–c), HeLa cells were treated without TPE-red–PSMA nanoparticles but irradiated with the 1040 nm fs laser for 20 min.It could be observed that no morphological changes occurred, which indicated that the 1040 nm fs irradiation was safe for HeLa cells. In another control experiment (Fig. 6d–f), HeLa cells were treated with TPE-red–PSMA nanoparticles, but were not irradiated using the 1040 nm fs laser. No morphological changes could be observed either, which indicated that the TPE-red–PSMA nanoparticles alone were biocompatible for HeLa cells. Thus, it becomes clear that the damages to HeLa cells were from the ROS produced by two-photon excited PDT process, which was based on TPE-red–PSMA nanoparticles. To the best of our knowledge, this is the first time that AIE nanoparticles were used as PSs for two-photon excited PDT in vitro.
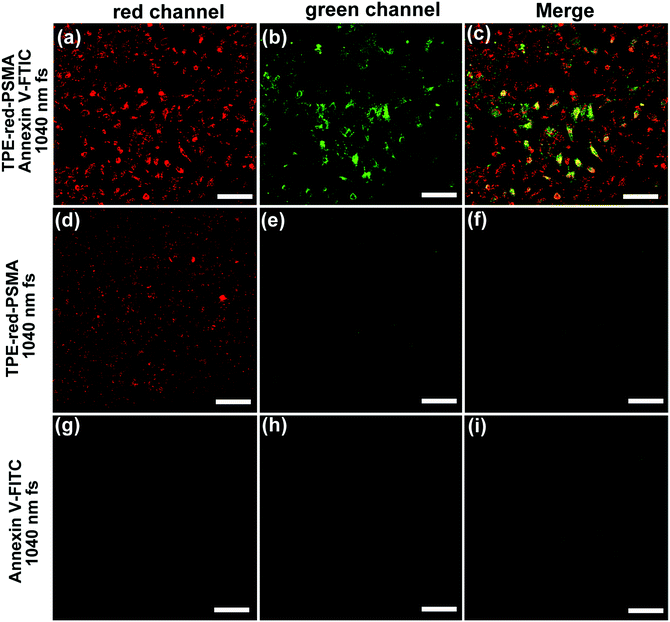
To quantitatively study the two-photon excited PDT action, HeLa cells were incubated with TPE-red–PSMA nanoparticles and fluorescein isothiocyanate (FITC)-tagged Annexin V (Annexin V-FITC) and then scanned using the 1040 nm fs laser for 120 s. Annexin V-FITC can bind to the membrane of the apoptotic cells that express phosphatidylserine. After that, it could emit green fluorescence upon 1040 nm fs excitation. As shown in Fig. 7b, c and Fig. S6b, c (ESI†), after 120 s fs irradiation, majority of the cells in the scanned area emitted green fluorescence, indicating that their apoptosis process occurred, which was induced by the two-photon excited ROS. In two control experiments, cells did not take on green fluorescence at all (Fig. 7d–i). By dividing the quantity of the “green” emitted cells by that of the “red” emitted cells (stands for the total quantity of the nanoparticles stained cells), the HeLa cell death ratio upon two-photon excited PDT was found to be about 90%.
Experimental
Materials and instruments
TPE-red was synthesized according to our previous report.40 Tetrahydrofuran (THF), 9,10-anthracenediyl-bis(methylene)dimalonic acid (ABDA), 2′,7′-dichlorofluorescein diacetate (DCF-DA), dimethyl sulfoxide (DMSO), poly(styrene-co-maleic anhydride) (PSMA), Rhodamine 6G (Rh6G), and 9-diethylamino-5H-benzo[alpha]-phenoxazine-5-one (Nile red) were purchased from Sigma. Annexin V-FITC apoptosis detection kit was purchased from Life Science Reagent biotechnology. Photochlor (HPPH) was purchased from Chembest, and Chlorin e6 (Ce6) was purchased from Frontier Scientific. Dulbecco's Modified Essential Medium (DMEM) and fetal bovine serum (FBS) were purchased from GIBCO. Deionized (DI) water was used in all experiments.The morphologies of TPE-red–PSMA nanoparticles were characterized using the JEOL JEM-1220 EX transmission electron microscope operated at 160 kV in bright-field mode. Particle size and distribution of TPE-red–PSMA nanoparticles were determined by dynamic light scattering (DLS) with a particle size analyzer (Zetasizer Nano ZS-90, malvern). The Shimadzu 2550 UV-Vis scanning spectrophotometer and a HITACHI F-2500 fluorescence spectrophotometer were used to measure the absorption and photoluminescence (PL) spectra of samples. Two-photon fluorescence spectra of TPE-red–PSMA nanoparticles were measured by a home-built system equipped with a 1040 nm fs laser [from an amplified output of a large-mode-area ytterbium-doped photonic crystal fiber (PCF) oscillator (150 fs, 50 MHz)]21 and collected using an optical fiber spectrometer (PG2000, Ideaoptics Instruments).
Synthesis of TPE-red–PSMA nanoparticles
TPE-red–PSMA nanoparticles were prepared by a self-assembly method as follows: 5 mg TPE-red was dissolved in THF to make stock solution A (1 mg mL−1). A similar method was used to make stock solution B (PSMA in THF, 10 mg mL−1). Then, 200 μL stock solution A was added to different volumes (10 μL, 20 μL, 200 μL and 400 μL) of solution B to produce various solution mixtures. Each mixture was diluted to 1 mL with THF, and then quickly added to 5 mL DI water under ultrasonication to form carboxyl functionalized nanoparticles. The as-synthesized TPE-red–PSMA nanoparticles were filtered using a 0.22 μm filter. During nanoparticle formation, the maleic anhydride units of PSMA molecules were hydrolyzed in the aqueous environment, which formed carboxyl groups. HPPH, Ce6 and Nile red were encapsulated by PSMA using the same method.Detection of one- and two-photon excited ROS
Chemical oxidation of ABDA in the aqueous dispersion of TPE-red–PSMA nanoparticles was used as an indirect method to characterize ROS generation efficiency. ABDA (60 μL, 1 mg mL−1 in DMSO) was added into the aqueous dispersion of TPE-red–PSMA nanoparticles, and irradiated using a 450 nm-CW laser or a 1040 nm fs laser. The ROS generated from the nanoparticles can oxidize ABDA and cause a decrease in the absorbance of ABDA. In this case, the decrease in the absorption intensity of ABDA was monitored as a function of irradiation time.Cell culture
HeLa cells (human cervical cancer cells) were cultivated in DMEM with 10% FBS, 1% penicillin, and 1% amphotericin B. One day before the treatment, cells were seeded in 35 mm cultivation dishes and grown until they reached 70–80% confluence. During treatment, a 50 μL stock solution of TPE-red–PSMA nanoparticles (200 μg mL−1) was added to a HeLa cell plate. Another 50 μL stock solution of TPE-red–PSMA nanoparticles was added to another HeLa cell plate for a control experiment. A third HeLa cell plate without any treatment was used for another control experiment. The cells were incubated for 2 hours at 37 °C in an atmosphere of 5% CO2. Then, the cells were washed thrice with 1× PBS and directly imaged using a two-photon fluorescence microscope.Two-photon excited fluorescence imaging
Fluorescence images of cells were taken using a two-photon fluorescence microscope as shown in Fig. S3 (ESI†). The system consisted of an upright scanning microscope (Olympus, BX61+FV1200) equipped with the aforementioned 1040 nm fs laser. The 1040 nm fs laser beam was guided into the upright scanning microscope and focused onto the cell samples by a 20×/1.00 (Olympus) water-immersed objective, and the two-photon excited fluorescence signals were epi-collected with the same objective. The fluorescence signals then passed through a 590 nm long pass filter and detected by a photomultiplier tube (PMT) via non-descanned detection (NDD) mode.Measurements of two-photon absorption cross-section
Two-photon absorption cross-section (TPACS, δ) describes the absorption ability of a fluorophore under two-photon excitation. Herein, TPACS of TPE-red–PSMA nanoparticles was measured via a two-photon-induced fluorescence method.20The TPACSs at 680–1020 nm and 1040 nm were measured based on a commercial upright two-photon fluorescence scanning microscope (Olympus, water-immersed Objective: 25×/1.00), equipped with a Ti:sapphire fs laser or the aforementioned 1040 nm fs laser. The fs laser beam was focused onto a capillary (containing the THF solution of TPE-red molecules) by the objective, and the two-photon excited fluorescence signals were collected by the same objective (Fig. S3, ESI†). Rhodamine 6G (Rh6G) in methanol was used as reference.42
Intracellular detection of two-photon excited ROS and two-photon excited apoptosis rate of cells
Two-photon excited ROS generation inside cells (under 1040 nm fs laser irradiation) was detected using DCF-DA (a type of intracellular ROS assay kit). Two-photon excited apoptosis rate of cells (under 1040 nm fs laser irradiation) was measured using Annexin-V-FITC (a type of apoptosis detection kit). HeLa cells were cultured at 37 °C in an atmosphere of 5% CO2. The culture medium was removed when cell confluence reached 80%, and the cell plates were washed twice with PBS buffer. After incubation with TPE-red–PSMA nanoparticles (20 μg mL−1) for 2 h in the dark, the cells were further incubated with DCF-DA/Annexin-V-FITC for 20 min. The cells incubated with DCF-DA were washed twice with PBS and then exposed to 1040 nm fs irradiation for 10 s. The cells incubated with Annexin-V-FITC were directly exposed to 1040 nm fs irradiation for 120 s. After irradiation, fluorescence images of treated cells were acquired using the two-photon fluorescence microscope. The two-photon fluorescence signals first pass through a 980 nm short-pass dichroic mirror (filter the excitation light). After that, the signal light was divided into two channels by the 579 nm dichroic mirror: one passed through a band-pass filter (495–540 nm) and then was received by PMT2, and the other (wavelength longer than 579 nm) was received by PMT1. Thus, red fluorescence from nanoparticles and green fluorescence from ROS-active DCF-DA/apoptosis-active Annexin-V-FITC can be observed simultaneously, as shown in Fig. S3 (ESI†).In vitro PDT
To confirm the two-photon excited PDT effect of TPE-red–PSMA nanoparticles, HeLa cells treated with them were irradiated using the 1040 nm fs laser for 20 min. In one control experiment, HeLa cells treated with nanoparticles were not irradiated by the 1040 nm fs laser. In the other control experiment, HeLa cells were neither treated with TPE-red–PSMA nanoparticle nor irradiated by the 1040 nm fs laser. During the entire process, the morphological changes of cells were recorded by a CCD camera (Fig. S3, ESI†).Conclusions
Herein, a type of red-emitting organic dye (TPE-red) with AIE properties was synthesized as PS and encapsulated by PSMA to form nanoparticles. Two-photon fluorescence and two-photon excited ROS generation of TPE-red–PSMA nanoparticles were characterized, respectively. Large two-photon absorption cross-section of TPE-red–PSMA nanoparticles at 1040 nm was observed. Based on an upright two-photon fluorescence microscope equipped with a 1040 nm fs laser, two-photon excited PDT on HeLa cells was well realized, using TPE-red–PSMA nanoparticles as PS. Our results indicated that two-photon excited PDT based on AIE-active PSs has great potentials in deep tissue imaging-guided therapy in the future.Acknowledgements
This study was supported by the National Basic Research Program of China (973 Program; 2013CB834704), the National Natural Science Foundation of China (61275190), and the Fundamental Research Funds for the Central Universities.References
- Y. Huang, S. He, W. Cao, K. Cai and X. Liang, Nanoscale, 2012, 4, 6135 RSC.
- G. Feng, W. Wu, S. Xu and B. Liu, ACS Appl. Mater. Interfaces, 2016, 8, 21193 CAS.
- J. F. Gohy and Y. Zhao, Chem. Soc. Rev., 2013, 42, 7117 RSC.
- Y. Zhang, L. Pang, C. Ma, Q. Tu, R. Zhang, E. Saeed, A. E. Mahmoud and J. Wang, Anal. Chem., 2014, 86, 3092 CrossRef CAS PubMed.
- J. P. Celli, B. Q. Spring, I. Rizvi, C. L. Evans, K. S. Samkoe, S. Verma, B. W. Pogue and T. Hasan, Chem. Rev., 2010, 110, 2795 CrossRef CAS PubMed.
- D. E. Dolmans, D. Fukumura and R. K. Jain, Nat. Rev. Cancer, 2003, 3, 380 CrossRef CAS PubMed.
- J. Zhao, W. Wu, J. Sun and S. Guo, Chem. Soc. Rev., 2013, 42, 5323 RSC.
- W. A. Velema, W. Szymanski and B. L. Feringa, J. Am. Chem. Soc., 2014, 136, 2178 CrossRef CAS PubMed.
- A. B. Ormond and H. S. Freeman, Materials, 2013, 6, 817 CrossRef CAS.
- N. Sekkat, H. van den Bergh, T. Nyokong and N. Lange, Molecules, 2011, 17, 98 CrossRef PubMed.
- J. B. Birks, Photophysics of Aromatic Molecules, Wiley, 1970 Search PubMed.
- J. Luo, Z. Xie, J. W. Y. Lam, L. Cheng, H. Chen, C. Qiu, H. Kwok, X. Zhan, Y. Liu, D. Zhu and B. Tang, Chem. Commun., 2001, 1740 RSC.
- D. Ding, K. Li, B. Liu and B. Z. Tang, Acc. Chem. Res., 2013, 46, 2441 CrossRef CAS PubMed.
- X. Xue, Y. Zhao, L. Dai, X. Zhang, X. Hao, C. Zhang, S. Huo, J. Liu, C. Liu, A. Kumar, W. Q. Chen, G. Zou and X. J. Liang, Adv. Mater., 2014, 26, 712 CrossRef CAS PubMed.
- Y. Yuan, R. T. Kwok, B. Z. Tang and B. Liu, J. Am. Chem. Soc., 2014, 136, 2546 CrossRef CAS PubMed.
- Y. Li, Y. Wu, J. Chang, M. Chen, R. Liu and F. Li, Chem. Commun., 2013, 49, 11335 RSC.
- Y. Yuan, G. Feng, W. Qin, B. Tang and B. Liu, Chem. Commun., 2014, 50, 8757 RSC.
- C. C. Chang, M. C. Hsieh, J. C. Lin and T. C. Chang, Biomaterials, 2012, 33, 897 CrossRef CAS PubMed.
- (a) H. Hirschberg, D. R. Sorensen, E. Angell-Petersen, Q. Peng, B. Tromberg, C.-H. Sun, S. Spetalen and S. Madsen, J. Environ. Pathol. Toxicol., 2006, 25, 1 CrossRef; (b) S. V. Goverdhan, S. Hannan, R. B. Newsom, A. J. Luff, H. Griffiths and A. J. Lotery, Eye, 2008, 22, 849 CrossRef CAS PubMed.
- Y. Wang, R. Hu, W. Xi, F. Cai, S. Wang, Z. Zhu, R. Bai and J. Qian, Biomed. Opt. Express, 2015, 6, 3783 CrossRef CAS PubMed.
- J. Qian, D. Wang, F. Cai, Q. Zhan, Y. Wang and S. He, Biomaterials, 2012, 33, 4851 CrossRef CAS PubMed.
- W. S. Kuo, C. Y. Chang, H. H. Chen, C. L. L. Hsu, J. Y. Wang, H. F. Kao, L. C. S. Chou, Y. C. Chen, S. J. Chen, W. T. Chang, S. W. Tseng, P. C. Wu and Y. C. Pu, ACS Appl. Mater. Interfaces, 2016, 8, 30467 CAS.
- T. Zhao, K. Yu, L. Li, T. Zhang, Z. Guan, N. Gao, P. Yuan, S. Li, S. Yao, Q. Xu and G. Xu, ACS Appl. Mater. Interfaces, 2014, 6, 2700 CAS.
- N.-T. Chen, K.-C. Tang, M.-F. Chung, S.-H. Cheng, C.-M. Huang, C.-H. Chu, P.-T. Chou, J. S. Souris, C.-T. Chen, C.-Y. Mou and L.-W. Lo, Theranostics, 2014, 4, 798 CrossRef PubMed.
- T. Zhao, X. Shen, L. Li, Z. Guan, N. Gao, P. Yuan, S. Q. Yao, Q.-H. Xu and G. Xu, Nanoscale, 2012, 4, 7712 RSC.
- L. Gao, J. Fei, J. Zhao, H. Li, Y. Cui and J. Li, ACS Nano, 2012, 6, 8030 CrossRef CAS PubMed.
- X. Shen, L. Li, H. Wu, S. Yao and Q. Xu, Nanoscale, 2011, 3, 5140 RSC.
- Z. Qi, D. Li, P. Jiang, F. Jiang, Y. Li, Y. Liu, W.-K. Wong and K.-W. Cheah, J. Mater. Chem., 2011, 21, 2455 RSC.
- J. Qian, D. Wang, F. Cai, Q. Zhan, Y. Wang and S. He, Biomaterials, 2012, 33, 4851 CrossRef CAS PubMed.
- C.-T. Poon, P.-S. Chan, C. Man, F.-L. Jiang, R. N. S. Wong, N.-K. Mak, D. W. J. Kwong, S.-W. Tsao and W.-K. Wong, J. Inorg. Biochem., 2010, 104, 62 CrossRef CAS PubMed.
- E. Secret, M. Maynadier, A. Gallud, A. Chaix, E. Bouffard, M. Gary-Bobo, N. Marcotte, O. Mongin, K. E. Cheikh, V. Hugues, M. Auffan, C. Frochot, A. Morère, P. Maillard, M. B. Desce, M. J. Sailor, M. Garcia, J.-O. Durand and F. Cunin, Adv. Mater., 2014, 26, 7643 CrossRef CAS PubMed.
- J. Schmitt, V. Heitz, A. Sour, F. Bolze, H. Ftouni, J.-F. Nicoud, L. Flamigni and B. Ventura, Angew. Chem., Int. Ed., 2015, 54, 169 CrossRef CAS PubMed.
- M. Khurana, H. A. Collins, A. Karotki, H. L. Anderson, D. T. Cramb and B. C. Wilson, Photochem. Photobiol., 2007, 83, 1441 CrossRef CAS PubMed.
- G. Garcia, F. Hammerer, F. Poyer, S. Achelle, M.-P. Teulade-Fichou and P. Maillard, Bioorg. Med. Chem., 2013, 21, 153 CrossRef CAS PubMed.
- J. Wang, Z. Zhang, S. Zha, Y. Zhu, P. Wu, B. Ehrenberg and J.-Y. Chen, Biomaterials, 2014, 35, 9372 CrossRef CAS PubMed.
- D. Li, H. Zhang, L. Chu, X. Zhao and J. Qian, Opt. Quantum Electron., 2015, 47, 3081 CrossRef CAS.
- L. Guo, J. Ge, Q. Liu, Q. Jia, H. Zhang, W. Liu, G. Niu, S. Liu, J. Gong, S. Hackbarth and P. Wang, Adv. Healthcare Mater., 2017, 1601431 CrossRef PubMed.
- X. Lou, Z. Zhao and B. Z. Tang, Small, 2016, 12, 6430 CrossRef CAS PubMed.
- S. Xu, Y. Yuan, X. Cai, C.-J. Zhang, F. Hu, J. Liang, G. Zhang, D. Zhang and B. Liu, Chem. Sci., 2015, 6, 5824 RSC.
- F. Hu, Y. Huang, G. Zhang, R. Zhao, H. Yang and D. Zhang, Anal. Chem., 2014, 86, 7987 CrossRef CAS PubMed.
- G. S. He, Q. Zheng, K. T. Yong, F. Erogbogbo, M. T. Swihart and P. Prasad, Nano Lett., 2008, 8, 2688 CrossRef CAS PubMed.
- D. A. Oulianov, I. V. Tomov, A. S. Dvornikov and P. M. Rentzepis, Opt. Commun., 2001, 191, 235 CrossRef CAS.
- A. T. R. Williams, S. A. Winfield and J. N. Miller, Analyst, 1983, 108, 1067 RSC.
Footnote |
| † Electronic supplementary information (ESI) available: Characterization of TPE-red–PSMA nanoparticles; detection of two-photon excited ROS; schematic illustration of the setup for two-photon fluorescence imaging; control of intracellular detection of two-photon excited ROS. See DOI: 10.1039/c7qm00092h |
| This journal is © the Partner Organisations 2017 |

