Design of bond-cleavage-induced intramolecular charge transfer emission with dibenzoboroles and their application to ratiometric sensors for discriminating chain lengths of alkanes†
Takuya
Matsumoto
,
Hirofumi
Takamine
,
Kazuo
Tanaka
 * and
Yoshiki
Chujo
*
Department of Polymer Chemistry, Graduate School of Engineering, Kyoto University, Katsura, Nishikyo-ku, Kyoto 615-8510, Japan. E-mail: kazuo123@chujo.synchem.kyoto-u.ac.jp; chujo@chujo.synchem.kyoto-u.ac.jp
First published on 11th September 2017
Abstract
Dibenzoborole derivatives containing four-coordinated boron were designed to realize emission from the bond-cleavage-induced intramolecular charge transfer (BICT) transition. A series of electron-donating and accepting groups were introduced into dibenzoborole through regioselective bromination and Suzuki–Miyaura coupling reaction in high yields. The synthesized dibenzoboroles showed dual-emissive properties composed of emission from the π–π* transition with four-coordinated boron and the BICT transition with a three-coordinated state. The influence of the substituents on the optical properties was experimentally and theoretically analyzed. Next, on the basis of the dual-emissive properties, it was demonstrated that dibenzoborole was feasible as a ratiometric fluorescent sensor for discriminating the viscosity of solvent alkanes including the length of alkane chains with a wide detection range. Finally, it was demonstrated that this detection system with a ratiometric output was applicable for evaluating viscosity with mixture samples and various kinds of natural oils.
Introduction
Organoboron conjugated compounds have distinctive electrochemical and optical properties because of their electron-deficient nature originating from the vacant p-orbitals of boron atoms.1,2 Various electronic and optical characteristics have been reported from organoboron compounds such as strong electro-accepting ability,3,4 anti-aromaticity,5–9 high electron mobility,10–12 and affinity to specific anions.13–18 Moreover, unique optical behaviors were also observed as dual-emissive outputs caused by the intramolecular B–N photodissociation of the Lewis adduct in the excited state.19 We also reported emission annihilation through cleavage at the B–N dative bond in dibenzoborole derivatives.20 A series of dibenzoheteroles including the four-coordinated group 13 elements were synthesized with the amine ligand.20 In the photoluminescence (PL) spectra, the dibenzoboroles unexpectedly showed fairly slight fluorescence emission. From the theoretical and experimental analyses, in summary, it was proposed that bond cleavage at the B–N dative bond should proceed after photo-irradiation. So far, although numerous organoboron compounds and boron complexes have been reported, there are still very few examples, especially offering functional luminescent organoboron molecules, which can present structural alteration in the excited state.Some luminescent molecules show structural transformation in the excited state, followed by simultaneously presenting two kinds of emission bands in different wavelength regions in the spectra.21,22 These dual-emissive properties are applicable not only to color tuning with luminescent materials but also to quantitative analyses for environmental factors by evaluating the intensity ratios between each emission band. As a typical example, in luminescent molecules with a twisted intramolecular charge transfer (TICT) mechanism, dual emission properties originating from the locally excited (LE) and TICT states can be realized by restricting molecular motions around the movable bond or unit.23 Indeed, various ratiometric detection systems for monitoring changes in biomolecules24,25 and tuning of the optical properties of luminescent materials26–30 have been accomplished based on restriction of motion in the excited state. From the polymers, by introducing “element-blocks,” which are defined as a functional building block composed of heteroatoms, various types of dual-emissive materials have been prepared.31
By monitoring these changes in the intensity ratios between each emission band, quantitative analyses can be achieved for evaluating the degree of changes in environmental factors. For instance, the above luminescent dyes involving TICT emission have been applied for sensing viscosity.32–36 However, due to the intrinsic sensitivity of luminescent properties to polarity, there was often interference with the measurements. Therefore, designed viscosity probes with less polarity dependence have been developed and widely used for mapping the viscosity in materials and cells.37–39 In addition, as a promising alternative to the ratiometric approach, fluorescent lifetime imaging microscopy was proposed as the latest advance in quantitative viscosity imaging.40,41 Although these systems are powerful tools for monitoring microenvironmental information, the probes can only appropriately work under relatively-high viscosity conditions (>10 mPa s). In addition, the emission quantum efficiencies are often critically low due to loss of excitation energy through vigorous molecular motions. Thus, it can be said that it is still challenging to obtain a sensing system, especially for lower viscosity conditions (<1 mPa s).
Herein, dibenzoborole derivatives were designed to realize emission from the bond-cleavage-induced intramolecular charge transfer (BICT) transition. To suppress the deactivation process by electron transfer to the dibenzoborole moiety from the lone pair of the released nitrogen after the photoinduced bond cleavage, the energy levels were modulated by the substituent effect at both end groups. From the optical measurements, dual emission from both the pristine π–π* and BICT transition processes was observed. These emission properties can be reasonably interpreted by theoretical investigation. Next, it was indicated that the BICT emission was critically sensitive to solvent viscosity in a wide detection range. In particular, owing to the ratiometric output, quantitative evaluation was achieved, leading to the discrimination of the length of alkanes. Furthermore, viscosity measurements were accomplished with mixture samples such as gasoline and mineral oils. This is the first example, to the best of our knowledge, that not only offers the rational design of luminescent dyes with dual-emissive properties including the novel emission mechanism of BICT, but also demonstrates superior quantitative sensing for an environmental factor in a wide detection range compared to the conventional materials.
Results and discussion
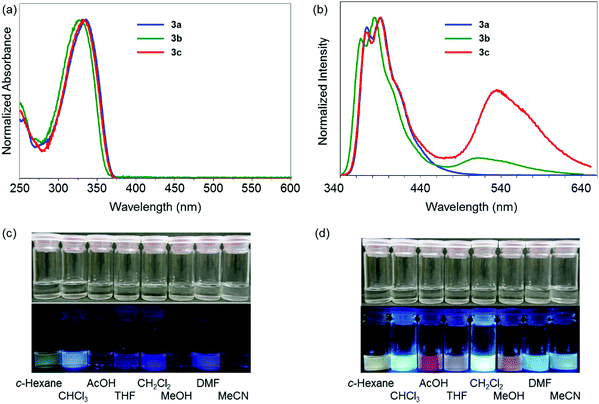
In a previous study, it was suggested from theoretical investigation that the localization of negative charge was enhanced at the boron atom in a dibenzoborole derivative in the excited state.20 From this fact, we proposed that the bond cleavage at the B–N bond could proceed by reducing electrostatic interaction between the boron and nitrogen. It is known that three-coordinated boron can work as a strong electron-acceptor. Then, electron transfer can occur from the lone pair in the free nitrogen, resulting in the loss of emission. According to this speculation, we hypothesized that by introducing the electron donating groups of fluoride moieties, the highest occupied molecular orbital (HOMO) level at the dibenzoborole moiety should be lifted up. As a result, electron transfer can be suppressed. Furthermore, in the dibenzoborole moiety, strong push–pull interaction between the substituents and three-coordinated boron results in strong CT emission. To confirm the validity of this idea, a series of dibenzoboroles was prepared (Scheme 1). The non-substituted dibenzoborole 1 was synthesized using the reported method.20 The bromination of 1 was performed selectively at the 3 and 7 positions in 84% yield, and the geometry of dibromodibenzoborole 2 was confirmed from X-ray structural analysis with single crystals (Fig. S13, ESI†). Dibenzoboroles 3a–c were obtained through Suzuki–Miyaura coupling reactions with palladium catalyst tris(dibenzylideneacetone)dipalladium(0) (Pd2(dba)3) and 2-dicyclohexylphosphino-2′,4′,6′-triisopropylbiphenyl (Xphos). All the coupling reactions proceeded with over 80% yields. The final products showed good solubility in common organic solvents and high stability even under ambient conditions. According to the molecular structure of 2 according to single crystal X-ray structural analysis, the bond length between boron and nitrogen was 1.873 Å and similar to the reported B–N bond lengths (Fig. S13, ESI†).19,20 In 11B NMR, sharp peaks of the synthesized dibenzoboroles were observed at 6.16–6.35 ppm. These results mean that the boron atoms should have four-coordination geometries in the solid and solution states.To examine the electronic properties in the ground state, the UV-vis absorption spectra of 3a–c were measured (Fig. 1a). The data are listed in Table 1. Similar shapes were obtained in both the spectra from dibenzoboroles regardless of the type of substituents. The absorption bands were observed with the peaks at around 330 nm attributable to the π–π* transition. The effects of solvents and substituents on their absorption bands were slightly detected (Fig. S14 and S15, ESI†). The contribution from the CT transition should be negligible. Additionally, comparing the spectra even with those of the dibenzogallole derivatives as previously reported, similar spectra were obtained from dibenzogalloles.42 Indeed, all the samples were a clear and colorless solution, and they were identical to the naked eye. These results mean that the electronic structures in the ground state were preserved by the coordination of nitrogen to boron. The coordination of nitrogen to boron in dibenzoboroles should be responsible for the preservation effect of electronic structures and compound stabilities.
Next, the electronic properties in the excited state were evaluated from the PL spectra. A significant substituent effect was observed in the PL spectra in the solution state (Fig. 1b). A single emission band with the peak at 373 nm was observed from 3a having electron-withdrawing trifluoromethylphenyl groups. In contrast, dual-emissions were observed from 3b and 3c having electron-neutral phenyl and electron-donating methoxyphenyl groups, respectively. Emission bands at around 330 nm were observed from both solutions with similar shapes to that of 3a, whereas another emission band appeared in the longer wavelength region. In particular, the emission band of 3c was detected in the longer wavelength region by 24 nm than that of 3b. The emission bands from 3a, 3b, and 3c in the shorter wavelength region were hardly affected by solvent polarity (Fig. S14, ESI†). In contrast, the emission bands around 540 nm in the spectra of 3b and 3c showed significant solvatochromism. As a result, colorful luminescent solutions were prepared (Fig. 1c). By increasing solvent polarity, bathochromic shifts were observed. From the Lippert–Mataga plots,23 the solvent effects of all the emission bands of 3a–c were evaluated (Fig. S15, ESI†). The slope values calculated from the plots of the peak shifts prepared from the emission bands of 3b and 3c in the longer wavelength region were much larger than those with short wavelengths. Furthermore, relatively longer emission lifetimes at around 520 nm of 3b and 3c were detected as 13.1 ns and 22.1 ns than that of 3a (1.14 ns), respectively (Table S14, ESI†). The emission bands of 3b and 3c at 380 nm included the components with shorter lifetimes. These data mean that the emission bands at around 330 nm should originate from the LE state, and those at around 520 nm were attributable to the CT transition. The excitation spectra were monitored at each peak position with dibenzoboroles (Fig. S16, ESI†). Obviously, similar shapes of the spectra were obtained to those of the absorption spectra. The spectra collected at 388 nm of 3b and 3c completely overwrapped with those at 534 nm. No peaks appeared from 380 nm to 520 nm in the spectra collected at 534 nm. These results also support that the emission bands in the shorter wavelength region in 3b and 3c should be assigned as the LE emission from the π–π* transition. The CT emissions were simultaneously obtained in the longer wavelength region. Additionally, it was indicated that these LE and CT emissions were caused from the sole species in the ground states. This fact proposes that the three-coordinated state could be generated after excitation. In summary, introduction of electron-donating groups into dibenzoborole can contribute to induction of dual-emission properties. Owing to the dual-emissive properties, colorful emission colors were obtained from the solutions even by slightly changing the solvent polarity.
From the intensity ratios of the emission bands at 390 nm and 535 nm, the Stevens–Ban plots were prepared to estimate the height of the energy barrier ΔEa in the transition between the LE and CT states in n-octane and n-decane (Fig. S17, ESI†).43–45 From the slopes with 3c, the ΔEa values were determined as 4.3 kJ mol−1 in both solvents. These values propose that a transition from the semi-stable LE state to the most stable CT state is possible at room temperature. From 3b, although relatively larger values were obtained (n-octane: 9.3 kJ mol−1, n-decane: 8.9 kJ mol−1), it was also indicated that the transition in the excited state should be acceptable. These results were supported by the date from the variable-temperature PL measurements (Fig. S18 and S19, ESI†). At 77 K, the emission bands at around 520 nm from the solutions containing 3b and 3c disappeared. On the other hand, by increasing the solution temperature, the relative intensity of the emission band at around 520 nm increased. From these data, it is suggested that 3b and 3c have two stable excited states and transition between these states readily occurs at room temperature. In Fig. S18 (ESI†), the emission band in the longer wavelength region disappeared in the glassy frozen state at 77 K, indicating that this emission was not phosphorescence. In addition, in the polystyrene film, the emission band disappeared as well. These data also suggest that disappearance of the emission band should be induced by suppression of molecular motions.
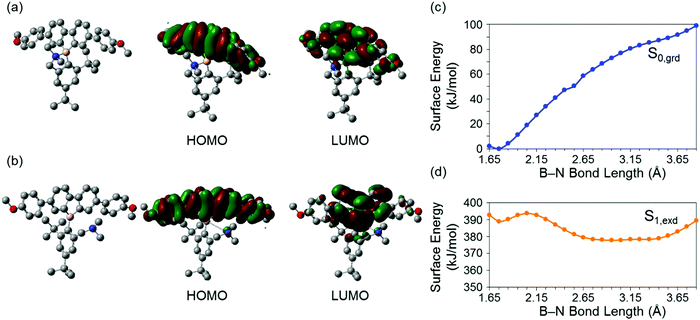
Theoretical analyses of dibenzoboroles were performed to gain a further understanding of the electronic properties and to propose the BICT process. The ground and excited states of 3c were evaluated by density functional theory (DFT) calculations (Fig. 2).46 It was shown that the optimized geometry of 3c in the ground state had a four-coordinated boron atom, and the main transition corresponded to a HOMO–LUMO transition. The HOMO and lowest unoccupied molecular orbital (LUMO) were mainly distributed over the whole of the tetraphenyl unit. In the excited states, the distance between the boron and nitrogen atoms was 3.219 Å and twice as long as that in the ground state (1.750 Å). This result proposed that, in the excited state, the B–N bond was cleaved, and subsequently the boron atom had a three-coordinated state.13,14 The main transition of the excited 3c was also from HOMO to LUMO. The HOMO was mainly distributed on the tetraphenyl unit. In contrast, the LUMO was localized at the dibenzoborole moiety. This difference in the electron localization suggests that CT should occur in the transition between HOMO–LUMO. That is, the bond-cleavage-induced CT (BICT) should proceed in the transition.
For the deep insight into the optical properties originated from BICT, the calculations were executed with 3a–c by changing the lengths of the B–N bonds in the ground and excited states. In Fig. 2c, the surface energy of 3c is presented. It was found that in the ground states S0,grd, the bond length of the most stable structure was 1.75 Å, and the boron atom had a four-coordinated structure. As the B–N bond length increased, the surface energy S0,grd in the ground state increased. In contrast, increase in the B–N bond length led to the stabilization of S1,exd in the excited state. Finally, it was revealed that the most stable geometry in the excited state possesses a 3.15 Å distance between the boron and nitrogen in which the bond should be no longer formed. This result significantly supports the emission mechanism by the BICT process. Although 3a and 3b showed similar behaviors, the energy barriers in these dibenzoboroles for the elongation of the B–N bond lengths were larger than that in 3c. These calculation results showed good agreements with the experimental data: 3a showed only a single emission band with the peak at 390 nm, and the relative emission intensity of 3b at 511 nm was much lower than that of 3c.
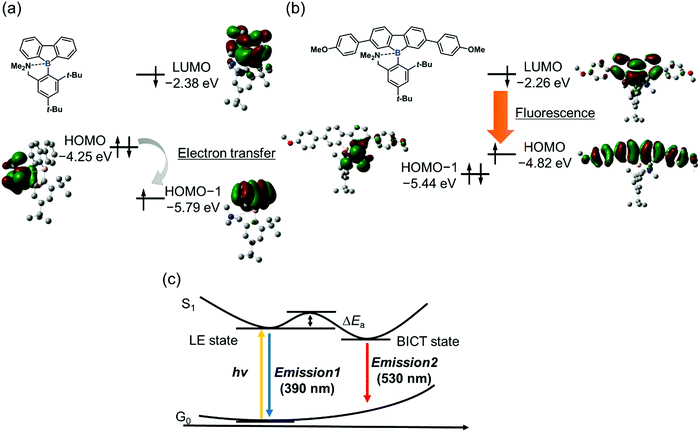
From the energy levels of each electronic state of the synthesized dibenzoboroles, their emissive properties can be interpreted. As mentioned above, the electronic state having localized electron orbitals on the tetraphenyl moiety is the HOMO (Fig. 3b). Therefore, significant emission from the CT transition can be observed as shown in 3b and 3c. On the other hand, when the HOMO is localized at the released amine group, a non-radiative decay process initiated by electron transfer should be possible. Indeed, in the previous study, the CT emission was hardly observed from the dibenzoborole derivative as shown in Fig. 3a. The introduction of electron-donating groups could contribute to controlling their orbital energy levels and improving their emission properties.
From the above theoretical discussion, the emission properties can be illustrated (Fig. 3c). The negative charge was enhanced at the boron atom in the dibenzoborole moiety by excitation.20 Therefore, the bond cleavage between the boron and nitrogen is induced in the excited state. Then, the CT state can be formed between the resulting three-coordinated boron and the conjugated moiety. Furthermore, the non-radiative decay process through the electron transfer from the free amine to the fluorene moieties including three-coordinated boron after the bond cleavage can be prohibited because of higher energy levels of the HOMO than that of the amine group. As a result, dibenzoboroles presented dual-emissions from the LE state without bond cleavage and the BICT state. The electron-donating groups in the dibenzoborole moiety of 3c can play roles not only in enhancing the formation of the BICT state but also in elevating the energy level of the HOMO. Thus, significant dual-emission was observed from dibenzoboroles having electron-donating groups.
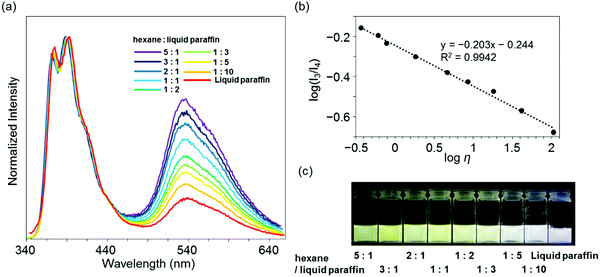
Highly sensitive stimuli-responsivity of the BICT emission was found and applied as an optical sensor for solvent viscosity. With the solutions of 3c in various lengths of n-alkanes CnH2n+2 (n = 5–16), the intensity ratios between the two emission bands were monitored (Fig. 4a). It was observed that as the number of carbons in n-alkane decreased, the relative intensity of the emission band around 535 nm increased. By employing the Förster–Hoffmann equation47 (eqn (1)), the relationships between relative emission intensity and solvent viscosity are described (Fig. 4b).
log(I3/I4) = α![[thin space (1/6-em)]](https://www.rsc.org/images/entities/char_2009.gif) log log![[thin space (1/6-em)]](https://www.rsc.org/images/entities/char_2009.gif) η + C η + C | (1) |
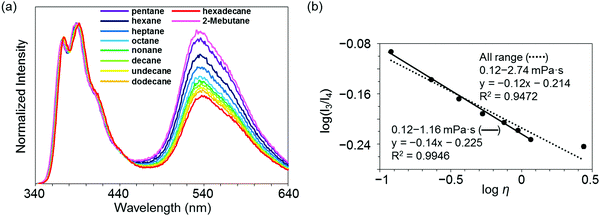 | ||
| Fig. 4 (a) Emission spectra of 3c in n-alkane solvent with the excitation light at λmax,abs (1.0 × 10⁻⁵ M). (b) Förster–Hoffmann plots of the ratio of dual emission bands (I3 and I4) of 3c. | ||
Finally, to demonstrate the applicability of 3c for practical usage, a discrimination experiment was performed with mixture systems containing hexane and liquid paraffin and natural oils such as gasoline, kerosenes and heavy mineral oils. From the mixture samples, a linear relationship was also obtained with eqn (1) in a wide viscosity range from 0.37 to 107 mPa s according to the R2 value (Fig. 5a and b). It should be noted that the emission quantum yields were constantly more than 50%. This fact proposes visualization of solvent viscosity by emission chromism. Indeed, accordingly, the emission color was turned from white to yellow by increasing the amount of hexane (Fig. 5c). This result clearly indicates that BICT-based viscosity sensing is applicable even in a mixture system. In the case of natural oils, similarly to the above protocol with n-alkanes, the intensity ratios were plotted with the sample containing 3c, and the data were fitted to the standard line obtained from the data set of n-alkanes (Fig. 6). Then, the viscosities of the pristine fluids were estimated (Table 2). The calculated data showed good agreement with the real values obtained with the commodity viscometer. In particular, from the comparison of viscosity values from both methods with the natural samples, similar tendencies were obtained. The applicability of the BICT-based viscosity sensor with practical products was demonstrated.
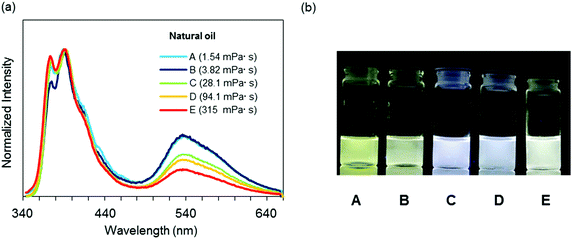 | ||
| Fig. 6 (a) Emission spectra of 3c in various natural oils with the excitation light at λmax,abs (1.0 × 10⁻⁵ M). (b) Photographs of 3c in various natural oils under UV irradiation (λ = 254 nm). | ||
| Sample | Natural oil | Calculated valuea [mPa s] | Measured valueb [mPa s] |
|---|---|---|---|
| a Determined from the fitting to the standard line prepared in Fig. 4b. b Determined with a commodity viscometer. | |||
| A | Kerosene | 4.39 | 1.54 |
| B | Heavy distillate kerosene | 4.99 | 3.82 |
| C | Light mineral oil | 28.0 | 28.1 |
| D | Heavy mineral oil a | 55.9 | 94.1 |
| E | Heavy mineral oil b | 242 | 315 |
Conclusion
Discrimination of the length of the alkyl chains in alkanes was accomplished by luminescent molecular probes. Based on high sensitivity of the BICT emission to solvent viscosity, distinct changes in the emission colors originating from the alteration of the dual-emissive property of the probe molecule were observed. Finally, feasibility with practical mixture products was demonstrated. By employing the BICT mechanism, degradation of the unstable three-coordinated boron species was completely suppressed and regulation of the molecular dynamics between the two excited states was achieved. Therefore, the environment responsiveness of transient species in the excited state can be utilized in the detection mechanism. This concept might be valid not only for constructing molecular probes for monitoring trace differences in environmental factors but also for preparing optically functional materials with high sensitivity transient species and reactive intermediates.Conflicts of interest
The authors declare no competing financial interest.Acknowledgements
This work was partially supported by the Mitsubishi Foundation (for K. T.) and a Grant-in-Aid for Scientific Research on Innovative Areas “New Polymeric Materials Based on Element-Blocks (No. 2401)” (JSPS KAKENHI Grant Number JP24102013).References
- F. Jäkle, Coord. Chem. Rev., 2006, 250, 1107–1121 CrossRef.
- A. Escande and M. J. Ingleson, Chem. Commun., 2015, 51, 6257–6274 RSC.
- N. Matsumi, K. Naka and Y. Chujo, J. Am. Chem. Soc., 1998, 120, 5112–5113 CrossRef CAS.
- S. Yamaguchi, T. Shirasaka, S. Akiyama and K. Tamao, J. Am. Chem. Soc., 2002, 124, 8816–8817 CrossRef CAS PubMed.
- C.-H. Zhao, A. Wakamiya, Y. Inukai and S. Yamaguchi, J. Am. Chem. Soc., 2006, 128, 15934–15935 CrossRef CAS PubMed.
- H. Braunschweig, V. Dyakonov, J. O. C. Jimenez-Halla, K. Kraft, I. Krummenacher, K. Radacki, A. Sperlich and J. Wahler, Angew. Chem., Int. Ed., 2012, 51, 2977–2980 CrossRef CAS PubMed.
- H. Braunschweig and T. Kupfer, Chem. Commun., 2011, 47, 10903–10914 RSC.
- A. Iida, A. Sekioka and S. Yamaguchi, Chem. Sci., 2012, 3, 1461–1466 RSC.
- A. Iida and S. Yamaguchi, J. Am. Chem. Soc., 2011, 133, 6952–6955 CrossRef CAS PubMed.
- S. Osumi, S. Saito, C. Dou, K. Matsuo, K. Kume, H. Yoshikawa, K. Awaga and S. Yamaguchi, Chem. Sci., 2016, 7, 219–227 RSC.
- R. Yoshii, H. Yamane, A. Nagai, K. Tanaka, H. Taka, H. Kita and Y. Chujo, Macromolecules, 2014, 47, 2316–2323 CrossRef CAS.
- S. Hashimoto, T. Ikuta, K. Shiren, S. Nakatsuka, J. Ni, M. Nakamura and T. Hatakeyama, Chem. Mater., 2014, 26, 6265–6271 CrossRef CAS.
- C. J. Berger, G. He, C. Merten, R. McDonald, M. J. Ferguson and E. Rivard, Inorg. Chem., 2014, 53, 1475–1486 CrossRef CAS PubMed.
- Z. Zhou, A. Wakamiya, T. Kushida and S. Yamaguchi, J. Am. Chem. Soc., 2012, 134, 4529–4532 CrossRef CAS PubMed.
- L. Wang, G. Fang and D. Cao, Sens. Actuators, B, 2015, 221, 63–74 CrossRef CAS.
- G. R. Kumar, S. K. Sarkar and P. Thilagar, Phys. Chem. Chem. Phys., 2015, 17, 30424–30432 RSC.
- Y. Fu, F. Qiu, F. Zhang, Y. Mai, Y. Wang, S. Fu, R. Tang, X. Zhuang and X. Feng, Chem. Commun., 2015, 51, 5298–5301 RSC.
- G. R. Kumar, S. K. Sarkar and P. Thilagar, Phys. Chem. Chem. Phys., 2015, 17, 30424–30432 RSC.
- K. Matsuo, S. Saito and S. Yamaguchi, J. Am. Chem. Soc., 2014, 136, 12580–12583 CrossRef CAS PubMed.
- T. Matsumoto, K. Tanaka, K. Tanaka and Y. Chujo, Dalton Trans., 2015, 44, 8697–8707 RSC.
- G. Zhang, G. M. Palmer, M. W. Dewhirst and C. L. Fraser, Nat. Mater., 2009, 8, 747–751 CrossRef CAS PubMed.
- L. E. Jennings and N. J. Long, Chem. Commun., 2009, 3511–3524 RSC.
- B. Valeur, Molecular Fluorescence, Wiley-VCH, Weinheim, Germany, 2002 Search PubMed.
- A. Okamoto, K. Tainaka, K. Nishiza and I. Saito, J. Am. Chem. Soc., 2005, 127, 13128–13129 CrossRef CAS PubMed.
- A. Suzuki, N. Nemoto, I. Saito and Y. Saito, Org. Biomol. Chem., 2014, 12, 660–666 CAS.
- H. Dong, C. Zhang, J. Yao and Y. S. Zhao, Chem. – Asian J., 2016, 11, 2656–2661 CrossRef CAS PubMed.
- Y. Wei, H. Dong, C. Wei, W. Zhang, Y. Yan and Y. S. Zhao, Adv. Mater., 2016, 16, 7424–7429 CrossRef PubMed.
- H. Dong, Y. Wei, W. Zhang, C. Wei, C. Zhang, J. Yao and Y. S. Zhao, J. Am. Chem. Soc., 2016, 138, 1118–1121 CrossRef CAS PubMed.
- H. Naito, K. Nishino, Y. Morisaki, K. Tanaka and Y. Chujo, Angew. Chem., Int. Ed., 2017, 56, 254–259 CrossRef CAS PubMed.
- K. Nishino, H. Yamamoto, K. Tanaka and Y. Chujo, Org. Lett., 2016, 18, 4064–4067 CrossRef CAS PubMed.
- Y. Chujo and K. Tanaka, Bull. Chem. Soc. Jpn., 2015, 88, 633–643 CrossRef CAS.
- H. Qian, M. E. Cousins, E. H. Horak, A. Wakefield, M. D. Liptak and I. Aprahamian, Nat. Chem., 2017, 9, 83–87 CAS.
- M. A. Haidekker, T. P. Brady, D. Lichlyter and E. A. Theodorakis, J. Am. Chem. Soc., 2006, 128, 398–399 CrossRef PubMed.
- V. I. Stsiapura, A. A. Maskevich, V. A. Kuzmitsky, V. N. Uversky, I. M. Kuznetsova and K. K. Turoverov, J. Phys. Chem. B, 2008, 112, 15893–15902 CrossRef CAS PubMed.
- M. A. Haidekker, T. P. Brady, D. Lichlyter and E. A. Theodorakis, Bioorg. Chem., 2005, 33, 415–425 CrossRef CAS PubMed.
- R. Hu, E. Lager, A. Aguilar-Aguilar, J. Liu, J. W. Y. Lam, H. H. Y. Sung, I. D. Williams, Y. Zhong, K. S. Wong, E. Peña-Cabrera and B. Z. Tang, J. Phys. Chem. C, 2009, 113, 15845–15853 CAS.
- M. A. Haidekker and E. A. Theodorakis, J. Mater. Chem. C, 2016, 4, 2707–2718 RSC.
- M. K. Kuimova, Phys. Chem. Chem. Phys., 2012, 14, 12671–12686 RSC.
- Z. Yang, J. Cao, Y. He, J. H. Yang, T. Kim, X. Peng and J. S. Kim, Chem. Soc. Rev., 2014, 43, 4563–4601 RSC.
- R. Kotani, H. Sotome, H. Okajima, S. Yokoyama, Y. Nakaike, A. Kashiwagi, C. Mori, Y. Nakada, S. Yamaguchi, A. Osuka, A. Sakamoto, H. Miyasaka and S. Saito, J. Mater. Chem. C, 2017, 5, 5248–5256 RSC.
- X. Peng, Z. Yang, J. Wang, J. Fan, Y. He, F. Song, B. Wang, S. Sun, J. Qu, J. Qi and M. Yan, J. Am. Chem. Soc., 2011, 133, 6626–6635 CrossRef CAS PubMed.
- T. Matsumoto, K. Tanaka and Y. Chujo, J. Am. Chem. Soc., 2013, 135, 4211–4214 CrossRef CAS PubMed.
- B. Stevens and M. I. Ban, Trans. Faraday Soc., 1964, 60, 1515–1523 RSC.
- T. Costa, M. G. Miguel, B. Lindman, K. Schillén and J. S. Seixas de Melo, J. Phys. Chem. B, 2005, 109, 11478–11492 CrossRef CAS PubMed.
- F. B. Dias, J. C. Lima, A. L. Maçanita, S. J. Clarson, A. Horta and I. F. Piérola, Macromolecules, 2000, 33, 4772–4779 CrossRef CAS.
- M. J. Frish, et al., Gaussian 09, revision D.01, Gaussian, Inc., Wallingford, CT, 2009 Search PubMed.
- T. Förster and G. Hoffmann, Z. Phys. Chem., 1971, 75, 63–76 CrossRef.
Footnote |
| † Electronic supplementary information (ESI) available. CCDC 1561443. For ESI and crystallographic data in CIF or other electronic format see DOI: 10.1039/c7qm00350a |
| This journal is © the Partner Organisations 2017 |


