 Open Access Article
Creative Commons Attribution 3.0 Unported Licence
Reaction-based indicator displacement assay (RIA) for the colorimetric and fluorometric detection of hydrogen peroxide†
Xiaolong
Sun
*a,
Maria L.
Odyniec
a,
Adam C.
Sedgwick
a,
Karel
Lacina
ab,
Suying
Xu
c,
Taotao
Qiang
d,
Steven D.
Bull
a,
Frank
Marken
a and
Tony D.
James
 *a
*a
aDepartment of Chemistry, University of Bath, BA2 7AY, UK. E-mail: Xiaolong.sun86@gmail.com; T.D.James@bath.ac.uk
bCEITEC, Masaryk University, Kamenice 5, 62500, Brno, Czech Republic
cDepartment of Analytical Chemistry, Faculty of Science, Beijing University of Chemical and Technology, Beijing, 100029, China
dCollege of Light Industry Science and Engineering, Shaanxi University of Science and Technology, Xi'an, 710021, China
First published on 17th February 2017
Abstract
Based on the complexation of phenylboronic acid (PBA) with Alizarin Red S (ARS), we developed a new chemosensor for the detection of hydrogen peroxide (H2O2) in aqueous media. This platform has demonstrated its ability to detect H2O2via colorimetric, fluorometric, and electrochemical measurements. The experimental observations reveal that the system displays a red-shifted visible colour change, on–off fluorescence response indicating release of indicator (ARS) and turn-on electrochemical signal indicating generation of phenol, after reaction with H2O2. With this work we have demonstrated that our reaction-based indicator displacement assay (RIA) systems, can be employed as an assay for H2O2 and hydrogen peroxide-related species for environmental and physiological detection.
1. Introduction
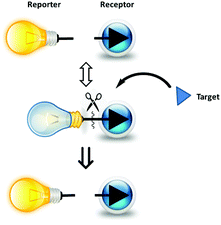
Hydrogen peroxide (H2O2) was first described in 1818 by Louis Jacques Thénard, who produced it by treating barium peroxide with nitric acid.1 It is the simplest peroxide with an oxygen–oxygen single bond and is a strong oxidant, which has been widely used as a bleaching agent and disinfectant, such as fabric stain removers, leather-making, contact lens disinfectants and hair dyes.2,3 In biological and physiological processes, H2O2 is an essential oxygen metabolite in living systems, with mounting evidence supporting its role as a messenger in cellular signal transduction.4 In particular, H2O2, as one of the reactive oxygen species (ROS), has important roles as a signalling molecule in the regulation of a wide variety of biological processes, such as immune response, cell signalling,5 Alzheimer's diseases6 and cancer.7 Thus, chemical and biological sensing of H2O2in vivo and in vitro has drawn much attention over the past decades.Among the powerful tools available for H2O2 detection are synthetic small-molecular fluorescent probes owing to their high sensitivity, simple manipulation and easy instrumentation. We have a long-standing interest in boronic acids for monosaccharide and anion detection.8–10 Previously, we also investigated the use of “integrated” and “insulated” boronate-based fluorescent complexes for the detection of H2O2 (pKa = 11.6).11,12 In addition, Chang and co-workers have developed a series of boronate-based derivatives for the fluorescence detection of H2O2 in living systems.13–23 Therefore, we were inspired to explore and develop more boronic acid based systems for detection of H2O2 (Scheme 1).
In terms of design of fluorescent probes, specifically our strategy for the detection of H2O2 is based on the construction of a reporter–receptor framework through reversible covalent bonding (Scheme 1). Alizarin Red S (ARS) has been successfully employed as a general optical reporter for various studies, such as binding ability of boronic acids with carbohydrates.24,25 Binding with boronic acids derivatives, ARS showed a visible colour change (from purple to orange) and an increase in fluorescence intensity due to the inhibition of proton-induced fluorescence quenching (Scheme 2).26 Also, our previous research has demonstrated the binding and analyte-mediated release of ARS with hydrogel-bound boronic acid.27 Notably, the use of surfactants by Ngeontae et al. improved the sensitivity of glucose sensors developed using alizarin–boronic acid adducts.28
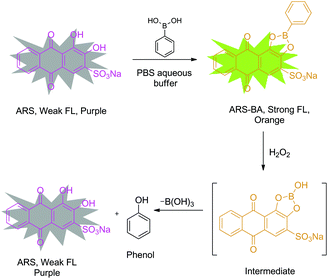 | ||
| Scheme 2 Design strategy of probe ARS–PBA complex for the detection of hydrogen peroxide in neutral aqueous buffer with added CTAB. | ||
Bearing these results in mind, we decided to evaluate the sensing system, ARS–PBA complex, that was formed by the attachment of phenylboronic acid with Alizarin Red S in situ (Scheme 2), assembled with the assistance of cetyl trimethylammonium bromide (CTAB) for the detection of H2O2 in an aqueous environment. It was demonstrated that the sensing system displays good colorimetric, fluorometric and electrochemical response towards H2O2 in neutral aqueous buffer. The oxidation between boronic ester and H2O2, which lead to the release of ARS and generation of phenol can be detected optically through a colour change. Meanwhile, significant fluorescence changes indicate that the methodology could be potentially used for biologically cell imaging and endogenous detection of H2O2. Therefore, this representative system can be extended to new applications for the study of other reactive oxygen and nitrogen species (ROS and RNS), using a Reaction-based Indicator displacement Assay (RIA) (Scheme 1).29 We have previously demonstrated the RIA concept using ARS with 2-(N,N-dimethylaminomethyl) phenylboronic acid (NBA) which can be used to selectively detect peroxynitrite using the neighbouring nitrogen of NBA to protect the boron and facilitate ARS complexation without the need to add CTAB. The current system shows how we can generalise the RIA concept to any boronic acid by means of CTAB to facilitate complexation and assembly of the RIA system.
2. Experimental
2.1 Solvents and reagents
Solvents and reagents were HPLC or reagent grade unless stated otherwise and were purchased from Fisher Scientific UK, Frontier Scientific Europe Ltd, TCI UK, and Sigma-Aldrich Company Ltd and were used without further purification.2.2 UV-Vis measurements
UV-Vis measurements were performed on Perkin-Elmer Spectrophotometers. Absorption, utilising Starna Silica (quartz) cuvette with 10 mm path lengths, two faces polished. Data was collected via the Perkin-Elmer Lambda 20 software package.2.3 Fluorescence measurements
Fluorescence measurements were performed on a Perkin-Elmer Luminescence Spectrophotometer LS 50B and Gilden Photonics Ltd. FluoroSENS, utilising LB UV4 FACES MACRO CUVETTE PMMA with 10 mm path lengths, four faces polished. Data was collected via the Perkin-Elmer FL Winlab software package.2.4 Electrochemical measurements
Electrochemical measurements were performed on a μ-Autolab potentiostat, Metrohm Autolab B.V. Carbon (3 mm) and gold (2 mm) disc electrodes were used as working and auxiliary electrodes, respectively. Saturated calomel electrode was used as reference. Square wave voltammetry (SWV) with frequency 8.3 Hz, potential step 4.95 mV and amplitude 10.05 mV was used. Working electrode was polished with alumina slurry (0.3 μm) and rinsed with distilled water before each scan.2.5 Experimental procedure
In the corresponding experiments, UV-Vis absorbance and fluorescence titrations with H2O2 were carried out at 25 °C in pH 7.30 PBS buffer (KH2PO4, 1/15 M; Na2HPO4, 1/15 M) with 2.0 mM cetyl trimethylammonium bromide (CTAB) and electrochemical data was obtained in pH 7.30 buffer (KCl, 0.1 M, KH2PO4, 1/15 M; Na2HPO4, 1/15 M). The ARS–PBA complexes were formed by mixing free ARS (50 μM) with phenylboronic acid (200 μM) in situ.3. Results and discussion
3.1 UV-Vis measurements with H2O2
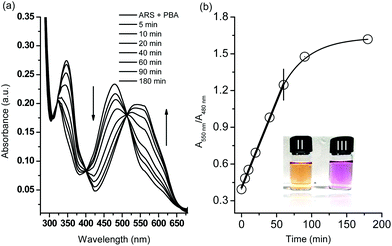
Initially, in the UV-Vis spectroscopy, we observed that the maximum absorbance of free ARS (50 μM) was centred at λabs = 550 nm while addition of phenylboronic acid (200 μM) caused a blue shift to λabs = 480 nm which was attributed to the conjugated structure formed in pH 7.30 PBS buffer (Scheme 1 and Fig. S1†). Therefore, the boronic ester formation of ARS with PBS led to a significant colour change from purple to orange over 15 min.The H2O2-mediated oxidation of aryl boronate to phenol and subsequent decomposition of the intermediate induced release of ARS from the complex resulting in the recovery of the free ARS absorption. From Fig. 1a, when H2O2 (500 μM) was added to a solution of ARS–PBA complex (ARS, 50 μM; PBA, 200 μM), a significant decrease in the 480 nm absorbance was observed with the appearance of a red-shifted band centred at 550 nm over through 3 h with 2.0 mM CTAB in the system and a clear iso-absorbance point can be seen at 510 nm. As can be seen from Fig. 1b, there is a good linear relationship between the absorption ratio (A550 nm/A480 nm) and reaction time (0–60 min) at an initial concentration of ARS–PBA (50 μM) and H2O2 (500 μM). However, the recovered absorption intensity from the complex probe is only 86.9% of the original free ARS over a prolonged time, probably due to incomplete reaction or incomplete decomposition of the intermediate. Importantly, the absorption wavelength shift is a reflection of the colour change (from orange to purple over 60 min) which can be readily visualised by the naked-eye (Fig. 1a). More importantly, ratiometric absorbance changes increase the dynamic range and permit signal-rationing, thus they provide a built-in correction for monitoring of environmental effects.30,31
3.2 Emission measurements with H2O2
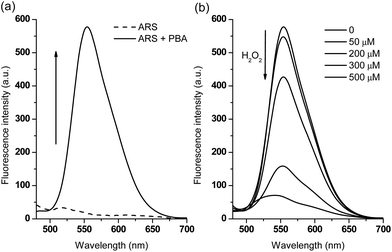
In terms of emission spectroscopy, the fluorescence of free ARS (50 μM) is quenched due to the active protons of the hydroxyanthraquinone (Fig. 2a), while the addition of various concentrations of phenylboronic acid causes a dramatic fluorescence intensity increase through the binding of the catechol unit of ARS with the boronic acid moiety (Fig. S2†). The formed complex was then used as part of a new fluorescence sensing system with a very strong emission properties.Subsequently, we investigated the fluorescence sensing ability towards H2O2 in time and dose-dependent manner. Initially, a higher concentration of PBA (600 μM) was used since it triggered a larger fluorescence increase (F/F0 = 38.5) in the presence of ARS (50 μM, Fig. S2†). However, from the time-dependant curve (Fig. S3†) and dose-dependent curve (Fig. S4†), it was found that when using higher concentrations of PBA, in order to quench the fluorescence completely, a higher concentration of H2O2 (approximately 1 mM, quenching efficiency FT/F0 = 0.06) was required over a long time period (1 h). This is attributed to the excess phenylboronic acid present in the system consuming significant amounts of H2O2. Therefore, for the sake of sensitivity, we reduced the concentration of PBA to 200 μM in the sensing system. As can be seen from Fig. 2a, the fluorescence intensity of ARS (50 μM) increased to F/F0 = 28.5 in the presence of PBA (200 μM), while only 500 μM H2O2 resulted in a dramatic decrease in fluorescence (quenching efficiency, FT/F0 = 0.12) over 1 h (Fig. 2b and S5†). Thus, in the case of using lower PBA concentrations with ARS, resulted in lower concentrations of H2O2 being required to release ARS and to produce large fluorescence changes.
3.3 Electrochemical measurements with H2O2
Finally, we also evaluated our sensing procedure using electrochemistry in order to better explain the mechanisms involved, square wave voltammetry (SWV) (only the homogeneous effects were evaluated as the electrode was polished before each scan). To the PBS buffer solution of ARS (50 μM), PBA (200 μM) was added to form the complex for further study. The oxidation signal of free ARS at an electrochemical potential of 0.375 V was remarkably decreased due to the hindered oxidation of ARS unit after its complexation with PBA (Fig. 3a).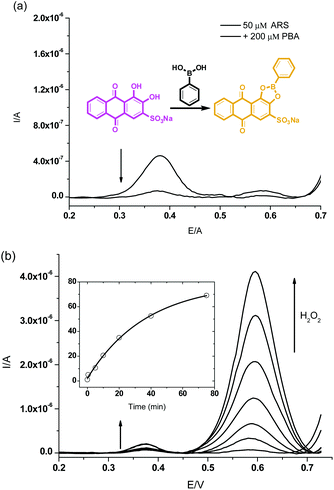 | ||
| Fig. 3 Square wave voltammograms for (a) the ARS only (50 μM), ARS–PBA (ARS, 50 μM; PBA, 200 μM) (b) and then addition of H2O2 (300 μM, 0–75 min), Time-kinetics curve as embedded figure. | ||
The electrical effect on the system consisting of ARS–PBA was studied over time after addition of H2O2 (300 μM, Fig. 3b). We can see reappearance of the peak for the released ARS at 0.375 V and the generation of phenol, cleaved from PBA by H2O2 was tracked using the signal at 0.585 V. The oxidation process for ARS–PBA were enhanced over time (0–80 min) due to the reaction and hydrolysis of the intermediate. The inequality of ARS and phenol peaks is caused not only by the different electrochemical activity and mobility of these two molecules but also by subsequent boronic acid–diol, i.e. ARS–PBA interactions. It has been already shown that the cleavage of PBA forming borate and phenol is accelerated by added diol.11 ARS acts in a catalytic manner as it is released from the cleaved complex and interacts with another PBA molecule facilitating its cleavage. It is important to note that slow cleavage of PBA occurs spontaneously and also contributes to the observed phenol signal.
3.4 CTAB influence on sensitivity and selectivity
The effect of CTAB on the binding of ARS with PBA and on the sensitivity of reaction with H2O2 was determined (Fig. S6 and S7†). At various CTAB (1–20 mM) concentrations, fluorescence intensities of the ARS–PBA complex were enhanced due to a strengthening of the interactions (Fig. S6b†). Then we compared the emission intensity changes for the ARS–PBA complexes with different concentrations of CTAB using a constant 500 μM of H2O2 (Fig. S7†). The ARS–PBA system with 1 mM CTAB produced the biggest response toward H2O2 and further increases of CTAB concentrations reduced the H2O2 response up to 5 mM after which the response remained constant (Fig. S7b†).We then evaluated the selectivity of the ARS–PBA system towards various ROS, Fig. S8–S10.† In the absence of CTAB, the complex of ARS–PBA produces a weak fluorescence and displayed fluorescence turn-off in the presence of ROS (−OCl, H2O2, ROO˙, −O2, ˙OH, 1O2, 500 μM, respectively), with the following selectivity order: −OCl > H2O2 > ˙OH > 1O2 > ROO˙ = −O2. However, in the presence of 2 mM CTAB, the ARS–PBA complex displayed a strong fluorescence and the following selectivity order towards ROS: ˙OH > H2O2 > −OCl > −O2 > 1O2 > ROO˙. The surprisingly high response to hydroxyl radical with CTAB is probably due to degradation of the surfactant.32 Whilst the reduced response towards hypochlorite can be ascribed to the micelle protecting the ARS–PBA complex from attack by the ROS.
In summary, CTAB is essential for facilitating ARS–PBA complex formation and therefore enhancing the fluorescence response towards ROS.
4. Conclusion
Using the assembly of phenylboronic acid with Alizarin Red S aided by CTAB, we have developed a chemosensor for the detection of H2O2 in aqueous media. We have analysed its behaviour towards H2O2 using colorimetric, fluorescence, and electrochemical techniques. The experimental observations demonstrate that the assembled RIA probe displays a visible colour change, on–off fluorescence response and turn-on electrochemical signal, for the sensing of H2O2. Indicating that our reaction-based indicator displacement assay (RIA) concept can provide a good platform as a new and rapid diagnostic assay for H2O2 and hydrogen peroxide-related environmental and physiological analysis in the future.Acknowledgements
TDJ and XS are grateful for financial support from China Scholarship Council (CSC) and University of Bath Full Fees Scholarship. ACS and MLO thank the EPSRC for Studentships. The Catalysis And Sensing for our Environment (CASE) network is thanked for research exchange opportunities. KL is grateful for financial support from the Ministry of Education, Youth and Sports of the Czech Republic under the project CEITEC 2020 (LQ1601) and from the EU Seventh Framework Programme under the “Capacities” specific programme (Contract No. 286154 – SYLICA). TDJ Thanks SUST for a Guest Professorship.Notes and references
- L. J. Thénard, Annales de chimie et de physique, 2nd series, 1818, vol. 8, pp. 306–312 Search PubMed.
- C. Tredwin, S. Naik, N. Lewis and C. Scully, Br. Dent. J., 2006, 200, 371–376 CrossRef CAS PubMed.
- B. E. Watt, A. T. Proudfoot and J. A. Vale, Toxicol. Rev., 2004, 23, 51–57 CrossRef CAS PubMed.
- M. Giorgio, M. Trinei, E. Migliaccio and P. G. Pelicci, Nat. Rev. Mol. Cell Biol., 2007, 8, 722–728 CrossRef CAS PubMed.
- J. P. Fruehauf and F. L. Meyskens, Clin. Cancer Res., 2007, 13, 789–794 CrossRef CAS PubMed.
- M. P. Mattson, Nature, 2004, 430, 631–639 CrossRef CAS PubMed.
- H. Ohshima, M. Tatemichi and T. Sawa, Arch. Biochem. Biophys., 2003, 417, 3–11 CrossRef CAS PubMed.
- E. Galbraith and T. D. James, Chem. Soc. Rev., 2010, 39, 3831–3842 RSC.
- R. Nishiyabu, Y. Kubo, T. D. James and J. S. Fossey, Chem. Commun., 2012, 47, 1106–1123 RSC.
- S. D. Bull, M. G. Davidson, J. M. van den Elsen, J. S. Fossey, A. T. Jenkins, Y. B. Jiang, Y. Kubo, F. Marken, K. Sakurai, J. Zhao and T. D. James, Acc. Chem. Res., 2013, 46, 312–326 CrossRef CAS PubMed.
- X. Sun, S.-Y. Xu, S. E. Flower, J. S. Fossey, X. Qian and T. D. James, Chem. Commun., 2013, 49, 8311–8313 RSC.
- X. Sun, Q. Xu, G. Kim, S. E. Flower, J. P. Lowe, J. Yoon, J. S. Fossey, X. Qian, S. D. Bull and T. D. James, Chem. Sci., 2014, 5, 3368 RSC.
- M. C. Y. Chang, A. Pralle, E. Y. Isacoff and C. J. Chang, J. Am. Chem. Soc., 2004, 126, 15392–15393 CrossRef CAS PubMed.
- A. E. Albers, V. S. Okreglak and C. J. Chang, J. Am. Chem. Soc., 2006, 128, 9640–9641 CrossRef CAS PubMed.
- E. W. Miller, O. Tulyathan, E. Y. Isacoff and C. J. Chang, Nat. Chem. Biol., 2007, 3, 263–267 CrossRef CAS PubMed.
- D. Srikun, E. W. Miller, D. W. Domaille and C. J. Chang, J. Am. Chem. Soc., 2008, 130, 4596–4597 CrossRef CAS PubMed.
- G. C. Van de Bittner, E. A. Dubikovskaya, C. R. Bertozzi and C. J. Chang, Proc. Natl. Acad. Sci. U. S. A, 2010, 107, 21316–21321 CrossRef CAS PubMed.
- D. Srikun, A. E. Albers, C. I. Nam, A. T. Iavarone and C. J. Chang, J. Am. Chem. Soc., 2010, 132, 4455–4465 CrossRef CAS PubMed.
- B. C. Dickinson, C. Huynh and C. J. Chang, J. Am. Chem. Soc., 2010, 132, 5906–5915 CrossRef CAS PubMed.
- E. W. Miller, A. E. Albers, A. Pralle, E. Y. Isacoff and C. J. Chang, J. Am. Chem. Soc., 2005, 127, 16652–16659 CrossRef CAS PubMed.
- G. C. Van de Bittner, C. R. Bertozzi and C. J. Chang, J. Am. Chem. Soc., 2013, 135, 1783–1795 CrossRef CAS PubMed.
- B. C. Dickinson, Y. Tang, Z. Chang and C. J. Chang, Chem. Biol., 2011, 18, 943–948 CrossRef CAS PubMed.
- A. R. Lippert, G. C. Van de Bittner and C. J. Chang, Acc. Chem. Res., 2011, 44, 793–804 CrossRef CAS PubMed.
- G. Springsteen and B. Wang, Chem. Commun., 2001, 1608–1609 RSC.
- C. Cannizzo, S. Amigoni-Gerbier and C. Larpent, Polymer, 2005, 46, 1269–1276 CrossRef CAS.
- D. K. Palit, H. Pal, T. Mukherjee and J. P. Mittal, J. Chem. Soc., Faraday Trans., 1990, 86, 3861–3869 RSC.
- W. M. J. Ma, M. P. Pereira Morais, F. D'Hooge, J. M. H. van den Elsen, J. P. L. Cox, T. D. James and J. S. Fossey, Chem. Commun., 2009, 532–534 RSC.
- K. Ngamdee, T. Noipa, S. Martwiset, T. Tuntulani and W. Ngeontae, Sens. Actuators, B, 2011, 160, 129–138 CrossRef CAS.
- X. L. Sun, K. Lacina, E. C. Ramsamy, S. E. Flower, J. S. Fossey, X. H. Qian, E. V. Anslyn, S. D. Bull and T. D. James, Chem. Sci., 2015, 6, 2963–2967 RSC.
- Z. Xu, S. K. Kim, S. J. Han, C. Lee, G. Kociok-Kohn, T. D. James and J. Yoon, Eur. J. Org. Chem., 2009, 2009, 3058–3065 CrossRef.
- Y. Kubo, M. Yamamoto, M. Ikeda, M. Takeuchi, S. Shinkai, S. Yamaguchi and K. Tamao, Angew. Chem., Int. Ed., 2003, 42, 2036–2040 CrossRef CAS PubMed.
- O. Horváth and R. Huszánk, Photochem. Photobiol. Sci., 2003, 2, 960–966 Search PubMed.
Footnote |
| † Electronic supplementary information (ESI) available: General methods, methods used for ROS generation and UV and fluorescence spectra. See DOI: 10.1039/c6qo00448b |
| This journal is © the Partner Organisations 2017 |

