 Open Access Article
Antibiofilm activity of Parkia javanica against Pseudomonas aeruginosa: a study with fruit extract†
Antu Das‡
a,
Manash C. Das‡a,
Padmani Sandhub,
Niranjan Dasc,
Prosun Tribedid,
Utpal C. Dee,
Yusuf Akhter b and
Surajit Bhattacharjee
 *a
*a
aDepartment of Molecular Biology & Bioinformatics, Tripura University, Suryamaninagar, Tripura 799022, India. E-mail: sbhattacharjee@gmail.com
bCentre for Computational Biology and Bioinformatics, School of Life Sciences, Central University of Himachal Pradesh, Shahpur, District-Kangra, Himachal Pradesh 176206, India
cDepartment of Chemistry, Netaji Subhash Mahavidyalaya, Udaipur, Tripura 799114, India
dDepartment of Microbiology, Don Bosco University, Guwahati, Assam–781017, India
eDepartment of Chemistry, Tripura University, Suryamaninagar, Tripura 799022, India
First published on 17th January 2017
Abstract
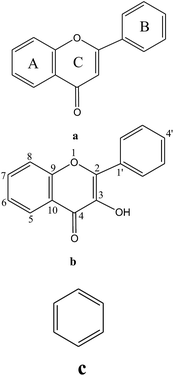
Parkia javanica is a well-known ethno-botanical plant of the north-east region of India. Ethnic communities of the region use several parts, including fruits, of this plant for the treatment of various ailments like diarrhoea, dysentery, cholera, food poisoning etc. In addition fruits are consumed by the local tribes of the north-east as food supplements. With this background we have performed chemical characterisation, and investigated the antimicrobial and antibiofilm potentiality of ethyl acetate fraction of Parkia javanica fruit extract (PJE) against model biofilm-causing microorganism Pseudomonas aeruginosa. PJE was initially prepared from fruit extract, and assayed by IR and UV spectroscopy and HPLC to confirm the presence of compounds. HPLC and NMR analysis reveals that PJE contains flavone compounds baicalein, quercetin and chrysin. PJE, baicalein, quercetin and chrysin were then tested for antimicrobial and antibiofilm activity against P. aeruginosa. PJE showed very significant antimicrobial activity against P. aeruginosa wherein the minimum inhibitory concentration was found at 180 μg mL−1. Interestingly, the antibiofilm study illustrates that minimum concentration of PJE (30 μg mL−1) exhibited maximum activity whereas maximum concentration of PJE (90 μg mL−1) exhibited minimum antibiofilm activity. It was also observed that compounds baicalein, quercetin and chrysin separately show lower to moderate antibiofilm activity in comparison to PJE. Molecular docking study indicates that baicalein, quercetin and chrysin have good binding affinity with bacterial quorum sensing and motility associated proteins. Furthermore, we have also observed that in comparison with higher concentration, lower concentration of PJE exhibited better attenuation in swarming motility, secretion of proteases and virulence factors like pyoverdin and pyocyanin. AFM study reveals that aggregates in PJE are smaller in size at low concentrations than at higher concentrations. Observations in the present study suggest that PJE as a whole shows higher antibiofilm activity at low concentration whereas individual compounds have comparatively lower antibiofilm activity. This validates the phytomedicinal significance of Parkia javanica against bacterial biofilms.
1 Introduction
Biofilm can be represented as a cluster of microorganisms embedded in self-secretory extracellular polymeric substances. Several bacteria develop biofilm as an alternative survival strategy for their growth and development. Pseudomonas aeruginosa, an efficient biofilm-forming Gram-negative bacterium, often forms biofilm during virulence exhibition and disease progression.1 It has been observed that Pseudomonas aeruginosa causes several serious pathogenic manifestations in human hosts like urinary tract infection, skin infection, lung infection etc. which may even be life-threatening.2,3 Antibiotics are routinely used to control Gram-positive as well as Gram-negative pathogenic microbial growth and survival. But recently it has been observed that biofilm-forming bacterial strains develop antibiotic resistance very fast.4 Thus, the treatment of microbial biofilm with conventional antibiotics becomes troublesome. Therefore, the uses of new antibacterial and antibiofilm compounds have drawn more attention in order to prevent microbial growth and biofilm formation.5 In this context, it has been reported that plant-derived extracts often exhibit good antibacterial and antibiofilm properties against a range of microorganisms.4,6 The north-eastern region of India including Tripura is rich in higher biodiversity with some rare and endangered taxa. The north-eastern region represents about 50% of the total plant species of India.7 Thus, the potentialities of ethno-medicinal plants provide a strong platform to explore efficient phytochemical bioactive compounds obtained from them.8Parkia javanica is a leguminous plant found in mainly South East Asian countries including the north-east part of India.9 The fruits of this plant are very popular for preparing traditional medicines among the locals. The local people used to take these fruits (raw or cooked) with local spices such as garlic, chilli pepper and dried shrimp to enhance the aroma. The fruits are also used traditionally to treat diseases such as diabetes, kidney pain and cholera. Various parts of this plant like the bark and leaves are also efficiently used by the people of Manipur for curing various ailments like diabetes, intestinal disorders, bleeding piles, diarrhoea and dysentery.9 Similarly, the tribes of Tripura use different parts of the plant to treat stomach ache and cholera.10 The tribes of Mizoram also use the green portion of the fruit and leaf of this plant to treat wounds, scabies, diarrhoea, dysentery and food poisoning.11 To date, no work has been done to explore the potentiality of Parkia javanica as an antibiofilm agent against disease-causing microorganisms. Therefore, the current study is an effort to investigate the antimicrobial and antibiofilm activity of ethyl acetate fraction of Parkia javanica fruit extract (PJE) using Pseudomonas aeruginosa as a model organism. In addition, three flavone compounds, namely baicalein, quercetin and chrysin, were identified in the PJE. Experimental results on antibiofilm activity of PJE were further substantiated by in silico analysis of binding of baicalein, quercetin and chrysin with biofilm-associated target proteins.
2 Materials and methods
2.1 Plant material and chemicals
Fruits of P. javanica were purchased from a local market of Agartala, West Tripura in the month of January–February 2010 and again in 2011. The fruits and hence plant were independently identified by Dr N. K. Chakraborty (Retd Prof. of Botany, MBB College, Agartala) and by Dr B. K. Datta (Professor, Department of Botany, Tripura University). A voucher specimen (UD/Agt/2010/520) has been preserved in the herbarium house of the botany department, Tripura University. Solvents used in the chromatographic separation were purchased from Merck, India. All bacterial media were purchased from Himedia, India. Purified baicalein, quercetin and chrysin were purchased from Sigma, India.2.2 Preparation of extracts
Fresh air-dried semi-powdered fruits (2 kg) were extracted with MeOH (4 L × 3) and filtered. Filtrate was then concentrated to obtain a semisolid mass (365 g). It was then suspended in H2O (ca. 250 mL), defatted with hexane and then successively partitioned with CHCl3, EtOAc and n-butanol. The n-butanol extract (5 g part of total 75 g) was subjected to reverse phase column chromatography (CC) over Diaion HP-20. The column was eluted with a range of gradient eluents, viz. H2O, H2O–MeOH (4![[thin space (1/6-em)]](https://www.rsc.org/images/entities/char_2009.gif) :
:![[thin space (1/6-em)]](https://www.rsc.org/images/entities/char_2009.gif) 1 to 1
1 to 1![[thin space (1/6-em)]](https://www.rsc.org/images/entities/char_2009.gif) :
:![[thin space (1/6-em)]](https://www.rsc.org/images/entities/char_2009.gif) 5) and MeOH (500 mL each). Each 50 mL fraction was collected and concentrated under reduced pressure and monitored by TLC. Fractions eluted with H2O–MeOH (1
5) and MeOH (500 mL each). Each 50 mL fraction was collected and concentrated under reduced pressure and monitored by TLC. Fractions eluted with H2O–MeOH (1![[thin space (1/6-em)]](https://www.rsc.org/images/entities/char_2009.gif) :
:![[thin space (1/6-em)]](https://www.rsc.org/images/entities/char_2009.gif) 4) exhibiting identical TLC patterns were mixed and concentrated to an oily mass (1.2 g). This oily mass was again subjected to normal CC over silica gel and eluted successively with EtOAc (10–90%) in petroleum ether (500 mL for each) and finally with EtOAc–MeOH gradient system. The fractions of methanol in ethyl acetate (5–10% MeOH in EtOAc) were almost similar in composition on TLC. These were mixed together to obtain a deep brown coloured semisolid mass (0.5 g) designated as PJE and showed remarkable antibiofilm activity compared to the other fractions. Three components have been identified as chrysin, baicalein and quercetin in this fractionated extract though some minor unidentified components were also present.
4) exhibiting identical TLC patterns were mixed and concentrated to an oily mass (1.2 g). This oily mass was again subjected to normal CC over silica gel and eluted successively with EtOAc (10–90%) in petroleum ether (500 mL for each) and finally with EtOAc–MeOH gradient system. The fractions of methanol in ethyl acetate (5–10% MeOH in EtOAc) were almost similar in composition on TLC. These were mixed together to obtain a deep brown coloured semisolid mass (0.5 g) designated as PJE and showed remarkable antibiofilm activity compared to the other fractions. Three components have been identified as chrysin, baicalein and quercetin in this fractionated extract though some minor unidentified components were also present.
2.3 High performance liquid chromatographic (HPLC) analysis
HPLC analysis was conducted with a Dionex UltiMate 3000 Rapid Separation LC (RSLC) system (Thermo Fisher Scientific Inc., MA, USA). Compounds were separated on a C18 (4.6 × 250 mm; 5 μm) column (Dionex, USA) at room temperature. Data acquisition, peak integration, and calibrations were accomplished using Dionex Chromeleon software (Version 6.80 RS 10). An isocratic elution was programmed with 20% MeOH and 80% water for 30 min, flushing and post-run equilibration of the column with 100% MeOH for 5 min. The flow rate was kept constant throughout the analysis at 1 mL min−1 and the injection volume was 20 μL. For detection of the compounds; the UV detector was adjusted at 254, 280 and 320 nm. Chromatogram of the extract was found to contain peaks for some polyphenolics like baicalein, quercetin and chrysin (compared with standard sample) along with some minor unidentified components having retention times very close to each other.2.4 Ultraviolet (UV), Fourier transform infrared (FTIR) and nuclear magnetic resonance (NMR) spectrophotometric analysis
Spectrophotometric analysis of PJE was done to determine qualitatively the presence of several functional groups. UV-visible spectrophotometric analysis (in MeOH, c = 0.1 mg mL−1) was conducted in the wavelength range 200–800 nm using a UV-visible spectrophotometer (PerkinElmer). UV spectrum of PJE showed characteristic peaks for phenolic OH and α,β-unsaturated carbonyl (![[double bond splayed left]](https://www.rsc.org/images/entities/char_e009.gif) CO–CH
CO–CH![[double bond, length as m-dash]](https://www.rsc.org/images/entities/char_e001.gif) C
C![[double bond splayed right]](https://www.rsc.org/images/entities/char_e00a.gif) ). Further, FTIR analysis was also done to identify the characteristic functional groups in the extract (PJE). A small quantity (2 mg) of dry, finely divided, extract was dispersed into a small, clean mortar with 200 mg of dried, spectrophotometric-grade KBr. The mixture was thoroughly ground and mixed firmly and vigorously for several minutes using a clean pestle. The mixture was then placed in a stainless steel die and 8 tons pressure was applied for 3 min under a hydraulic press to form a KBr thin disc. The pressed KBr disc was then transfer to the disc holder for FTIR analysis. The FTIR spectrum was obtained using a PerkinElmer 2000 infrared spectrometer. The sample was scanned from 4000 to 400 cm−1 for 16 times to increase the signal to noise ratio. Each and every analysis was repeated four times for the spectrum confirmation. FTIR spectra also corroborated the presence of phenolic –OH, carbonyl (
). Further, FTIR analysis was also done to identify the characteristic functional groups in the extract (PJE). A small quantity (2 mg) of dry, finely divided, extract was dispersed into a small, clean mortar with 200 mg of dried, spectrophotometric-grade KBr. The mixture was thoroughly ground and mixed firmly and vigorously for several minutes using a clean pestle. The mixture was then placed in a stainless steel die and 8 tons pressure was applied for 3 min under a hydraulic press to form a KBr thin disc. The pressed KBr disc was then transfer to the disc holder for FTIR analysis. The FTIR spectrum was obtained using a PerkinElmer 2000 infrared spectrometer. The sample was scanned from 4000 to 400 cm−1 for 16 times to increase the signal to noise ratio. Each and every analysis was repeated four times for the spectrum confirmation. FTIR spectra also corroborated the presence of phenolic –OH, carbonyl (![[double bond splayed left]](https://www.rsc.org/images/entities/char_e009.gif) CO) and olefinic (
CO) and olefinic (![[double bond splayed left]](https://www.rsc.org/images/entities/char_e009.gif) C
C![[double bond, length as m-dash]](https://www.rsc.org/images/entities/char_e001.gif) C
C![[double bond splayed right]](https://www.rsc.org/images/entities/char_e00a.gif) ) functionalities along with aromatic rings.
) functionalities along with aromatic rings.
1H-NMR spectroscopy of the PJE was also carried out to detect the presence of compounds and possible functional groups in the crude plant extract. 1H-NMR spectra of PJE in DMSO-d6 were recorded with a Varian XL-400 NMR spectrometer. Chemical shifts were recorded as δ (ppm) with tetramethylsilane (TMS) as an internal standard. The resulting spectra were compared with the reference and possible chemicals present in the PJE were determined.12–14
2.5 Microbial strain
In the current investigation, Pseudomonas aeruginosa MTCC 2488 (P. aeruginosa) was selected as test organism and tryptic soy broth (TSB) medium was used for the cultivation of the bacteria. Initially bacteria were streaked from a −80 °C glycerol stock onto tryptic soy agar plate and a fresh single colony was inoculated into 25 mL TSB medium and incubated at 37 °C for 24 h. From there, 106 CFU mL−1 bacterial cell suspensions were taken for all subsequent experiments.2.6 Determination of antibacterial susceptibility
Disc diffusion method using the Bauer–Kirby technique15 was employed for determination of zone of microbial growth inhibition as per recommendation of National Committee for Clinical Laboratory Standards.16 The extent of antibacterial susceptibility of PJE was expressed in millimeters by measuring the diameter of zone of inhibition. Briefly, paper discs of 4 mm in diameter soaked with different concentrations of PJE, baicalein, quercetin and chrysin were placed on an agar plate overlaid with soft agar (0.7%) that was previously inoculated with P. aeruginosa. The plate was then incubated at 37 °C for 48 h. After the incubation, the diameter of the clear zone (mm) around the disc was measured which indicates the antibacterial sensitivity.2.7 Determination of minimum inhibitory concentration (MIC)
MICs of PJE, baicalein, quercetin and chrysin against P. aeruginosa were determined by using standard broth microdilution assay.17 Briefly, 50.0 μL of 106 CFU mL−1 bacterial cell suspensions were taken in microplate wells and to those were added 50.0 μL of PJE, baicalein, quercetin and chrysin of different concentrations to attain final concentrations of 5 to 300 μg mL−1. The microplate was then incubated at 37 °C for 48 h. After the incubation period, the MIC was determined by a microplate reader (Synergy H1 hybrid reader, Biotek). The MIC represents the lowest concentration which produces almost no absorbance at 600 nm.2.8 Effect of PJE, baicalein, quercetin and chrysin on the growth kinetics of P. aeruginosa
Equal numbers (106 CFU mL−1) of P. aeruginosa were separately inoculated into 25 mL sterile TSB media. Different concentrations of PJE (7.5 μg mL−1, 15 μg mL−1, 30 μg mL−1, 60 μg mL−1, 90 μg mL−1, 180 μg mL−1, 220 μg mL−1, 240 μg mL−1 and 260 μg mL−1), baicalein, quercetin and chrysin were then separately added into conical flasks and incubated at 37 °C for up to 48 h. During incubation, cell growth was determined by measuring the absorbance at 600 nm at 2 h intervals.182.9 Evaluation of biofilm-forming capability of P. aeruginosa
Before starting the antibiofilm assay, the organism P. aeruginosa MTCC 2488 was tested for its ability to form biofilm. To evaluate this, P. aeruginosa was grown in a 96-well plate and incubated at 37 °C for 48 h. Tubes were then washed three times with sterile phosphate buffer saline (PBS) and stained with 0.1% (v/v) safranin for 10 min. The excess stain was removed by washing with sterile PBS and the plate was then dried at 37 °C. Safranin from adherent P. aeruginosa was re-dissolved in 30% (v/v) glacial acetic acid. Thereafter, absorbance was recorded at 492 nm for safranin-stained glacial acetic acid suspension.192.10 Antibiofilm activity assay
Interference of biofilm formation upon PJE, baicalein, quercetin and chrysin treatment was investigated using the protocol mentioned above for examining the biofilm-forming ability of bacteria. Sub-MIC concentrations of PJE (90 μg mL−1, 60 μg mL−1, 30 μg mL−1, 15 μg mL−1 and 7.5 μg mL−1), baicalein, quercetin and chrysin were added to the bacterial suspension and incubated at 37 °C for 48 h. Wells (PJE, baicalein, quercetin and chrysin treated and untreated) were then washed and stained with safranin as per the biofilm capability evaluation procedure described above.17 Percentage biofilm inhibition was calculated with respect to untreated control using the following formula:2.11 Estimation of total extractable protein concentration from biofilm
The microbial population density in biofilm is directly proportional to the extractable protein concentration.17 Therefore, to estimate the total extractable protein from tube surface, P. aeruginosa was incubated as per the biofilm inhibition assay. After the incubation, planktonic cells were removed following which the adhered biofilm cells were washed gently with sterile PBS and boiled for 30 min in 0.5 (N) NaOH to extract the protein. The suspension was then centrifuged at 10![[thin space (1/6-em)]](https://www.rsc.org/images/entities/char_2009.gif) 000 rpm for 5 min and the resulting clear supernatant was collected. From the supernatant, protein concentration was determined according to Lowry's method.20
000 rpm for 5 min and the resulting clear supernatant was collected. From the supernatant, protein concentration was determined according to Lowry's method.20
2.12 Analysis of biofilm formation on glass surface by fluorescence microscopy
To examine the antibiofilm potentiality of PJE, baicalein, quercetin and chrysin against P. aeruginosa biofilm, P. aeruginosa was separately grown in media containing varying concentrations of PJE (90 μg mL−1, 60 μg mL−1 and 30 μg mL−1), baicalein, quercetin and chrysin. Sterile glass cover slips were added to each growth medium to allow the development of microbial biofilm over it and incubated at 37 °C for 48 h. After the incubation, cover slips were recovered, stained with acridine orange (4 μg mL−1), air-dried and observed under a fluorescence microscope (Leica DM 4000B, Germany).212.13 In silico analysis of antibiofilm activity
In order to analyse the predicted antibiofilm activity of the three investigated compounds baicalein, quercetin and chrysin from PJE, molecular docking analyses were performed. The 3D structures of baicalein (CID: 5281605), chrysin (CID: 5281607) and quercetin (CID: 5280343) were derived from PubChem.22 The tertiary structures of quorum sensing and motility related proteins of P. aeruginosa were derived from Protein Data Bank23 and the proteins for which crystal structures were not available were subjected to automated homology modelling using Phyre2.24 The PDBQT files for all protein and ligands were prepared using AutoDockTools suite25 and docking was performed using the AutoDock Vina26 tool. The protein–ligand complexes were visualised graphically using PyMOL27 and interactions were plotted using LigPlot+.282.14 Swarming motility of P. aeruginosa
Swarming motility of P. aeruginosa was investigated in small 35 × 10 mm polystyrene plates containing swarming motility media [nutrient agar (8 g L−1) supplemented with glucose (5.0 g L−1)]. An aliquot of 2 μL of overnight culture either treated or untreated with sub-MIC doses of PJE was point-inoculated in the centre of the plate, the spot dried for 20 min at room temperature and plates incubated for 48 h at 37 °C. Diameter of circular bacterial growth from the point of inoculation was used to measure the swarming motility of bacteria.292.15 Azocasein-degrading proteolytic activity of P. aeruginosa
To determine the amount of protease released by P. aeruginosa, the bacteria were incubated as per the biofilm inhibition assay. The proteolytic activity in the cell-free supernatant of P. aeruginosa was determined according to the method of Kessler et al.30 with minor modifications. Briefly, pre-incubated cells were collected, centrifuged at 10![[thin space (1/6-em)]](https://www.rsc.org/images/entities/char_2009.gif) 000 rpm for 5 min and the clear supernatant was collected. 150 μL cell-free clear supernatant was added to 1 mL of 0.3% azocasein prepared in 0.05 M Tris–HCl (pH 7.5) and the reaction mixture was incubated at 37 °C for 15 min. After incubation, the reaction was stopped by the addition of 10% trichloroacetic acid. Thereafter, the reaction mixture was centrifuged again at 10
000 rpm for 5 min and the clear supernatant was collected. 150 μL cell-free clear supernatant was added to 1 mL of 0.3% azocasein prepared in 0.05 M Tris–HCl (pH 7.5) and the reaction mixture was incubated at 37 °C for 15 min. After incubation, the reaction was stopped by the addition of 10% trichloroacetic acid. Thereafter, the reaction mixture was centrifuged again at 10![[thin space (1/6-em)]](https://www.rsc.org/images/entities/char_2009.gif) 000 rpm for 5 min to obtain a clear supernatant. Absorbance of clear supernatant was then measured at 400 nm (Shimadzu, Japan). Thus degraded azocasein from each pre-incubated well was measured with respect to untreated control.29
000 rpm for 5 min to obtain a clear supernatant. Absorbance of clear supernatant was then measured at 400 nm (Shimadzu, Japan). Thus degraded azocasein from each pre-incubated well was measured with respect to untreated control.29
2.16 Pyoverdin secretion assay
P. aeruginosa was separately grown in TSB media containing different sub-MIC doses (90 μg mL−1, 60 μg mL−1 and 30 μg mL−1) of PJE and incubated at 37 °C for 48 h. Thereafter, each culture medium was centrifuged at 10![[thin space (1/6-em)]](https://www.rsc.org/images/entities/char_2009.gif) 000 rpm for 15 min, and the cell-free supernatant was collected. Extent of pyoverdin production in PJE-treated and untreated culture supernatant was then measured using a fluorescence spectrophotometer at an excitation wavelength of 405 nm and an emission wavelength of 465 nm.31
000 rpm for 15 min, and the cell-free supernatant was collected. Extent of pyoverdin production in PJE-treated and untreated culture supernatant was then measured using a fluorescence spectrophotometer at an excitation wavelength of 405 nm and an emission wavelength of 465 nm.31
2.17 Pyocyanin quantification assay
The pyocyanin quantification assay was performed according to the method described by Essar et al.32 Briefly, P. aeruginosa was incubated in presence and absence of sub-MIC doses (90 μg mL−1, 60 μg mL−1 and 30 μg mL−1) of PJE at 37 °C for 48 h. Thereafter, the culture media were centrifuged at 10![[thin space (1/6-em)]](https://www.rsc.org/images/entities/char_2009.gif) 000 rpm for 15 min and the cell-free supernatant was collected. A 5 mL culture supernatant was extracted with 3 mL of chloroform and then re-extracted into 1 mL of 0.2 N HCl to get an orange yellow to pink coloured solution. The absorbance of this solution was measured at 520 nm. Concentration of pyocyanin released per millilitre of culture supernatant was determined by multiplying the absorbance at 520 nm by a factor of 17.072.32
000 rpm for 15 min and the cell-free supernatant was collected. A 5 mL culture supernatant was extracted with 3 mL of chloroform and then re-extracted into 1 mL of 0.2 N HCl to get an orange yellow to pink coloured solution. The absorbance of this solution was measured at 520 nm. Concentration of pyocyanin released per millilitre of culture supernatant was determined by multiplying the absorbance at 520 nm by a factor of 17.072.32
2.18 Determination of particle size of PJE by atomic force microscopy
Several dilutions of PJE, viz. 90 μg mL−1, 60 μg mL−1, 30 μg mL−1, were prepared in DMSO. 10 μL from each dilution were spread over a clean dry glass coverslip as thin film and allowed to dry at 37 °C for 1 h. Films were then analysed by an atomic force microscope (Bruker-Innova) first at 10 μm scale and gradually up to 4 μm scale at a scanning speed of 1 Hz. All images were obtained with a resolution of 512 × 512 pixels. From the observed images, size distributions of particles were measured.332.19 Contour plot
To establish the relationship between biofilm inhibition (%), reduction in motility (%) with pyocyanin inhibition (%), a contour plot was constructed by Minitab 16. A contour plot is a graphical technique for representing a 3-dimensional surface by plotting constant Z slices, called contours, in a 2-dimensional format. That is, a given value for Z lines are drawn for connecting the (x, y) coordinates where that Z value occurs.2.20 Statistical analysis
All experiments were performed in triplicate. Data were presented as mean ± standard deviation. Significance level was determined by using one way ANOVA and level of significance was represented as P value < 0.01 (denoted with *), P value < 0.001 (denoted with **) and P value < 0.0001 (denoted with ***). Statistical analyses were performed using Graph Pad Prism 6.0 software (GraphPad, CA, USA).3 Results
3.1 Identification of presence of compounds in PJE by UV-visible, IR and NMR spectroscopy and HPLC
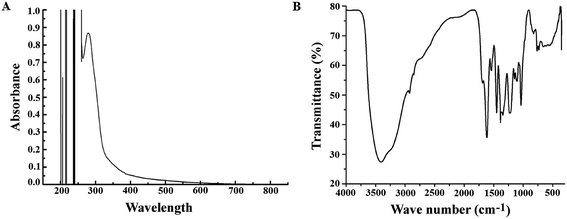
After preparation of the extract (PJE), we measured the absorption spectrum of the ethyl acetate fraction between 200 nm and 800 nm wavelength. The result showed several absorption peaks particularly in the UV region (Fig. 1A) indicating the presence of different chromophoric groups like α,β-unsaturated carbonyl, olefinic and phenolic –OH etc. Presence of these functional groups in PJE was further supported through the detection of characteristic infrared absorption frequencies and was done by subjecting PJE to FTIR analysis. The FTIR spectrum showed peaks corresponding to hydroxyl (3409 cm−1) and carbonyl (1690 cm−1, α,β-unsaturated) functional groups in the PJE (Fig. 1B). Thus the spectroscopic analysis revealed the presence of several compounds having diverse functional groups in the PJE which may exhibit different biological activities. In fact, the fractionated extract (PJE) of the P. javanica fruits was found to contain three known flavonoids, viz. baicalein, quercetin and chrysin, as determined by HPLC analysis of the extract and comparison with chromatograms of standard baicalein, quercetin and chrysin. HPLC chromatogram (Fig. 2) of the extract of PJE was found to contain several peaks (Fig. 2A) marked as a, b, c, d and e. Among these b, c and e are the peaks corresponding to major compounds present in higher quantities. Through running purified compounds we have observed that peaks (retention time in X axis and peak height in Y axis) of pure baicalein (Fig. 2B), quercetin (Fig. 2C) and chrysin (Fig. 2D) match with b, c and e peaks of the PJE chromatogram respectively. From these observations it can be inferred that PJE contain baicalein, quercetin and chrysin in significant quantities. Thus we estimated antibacterial and antibiofilm activities separately for baicalein, quercetin and chrysin along with PJE. The 1H-NMR spectroscopic analysis of PJE in DMSO-d6 revealed the presence of hydroxyl groups and flavonoid moieties in the sample. The 1H-NMR spectrum of PJE in DMSO-d6 showed signals at chemical shifts of aromatic region δ 6–8 ppm and hydroxyl groups δ 9–13 ppm. The 1H-NMR spectrum (ESI Fig. 1†) exhibited proton signals at δ 6–8 ppm characteristic of flavone/flavonol/aromatic nucleus.12–14 Based on the chemical shift values of the aromatic region, PJE contains flavonoid compounds, mainly baicalein, quercetin and chrysin. From the observed peaks, probable structures of functional groups of compounds were also obtained (Table 1).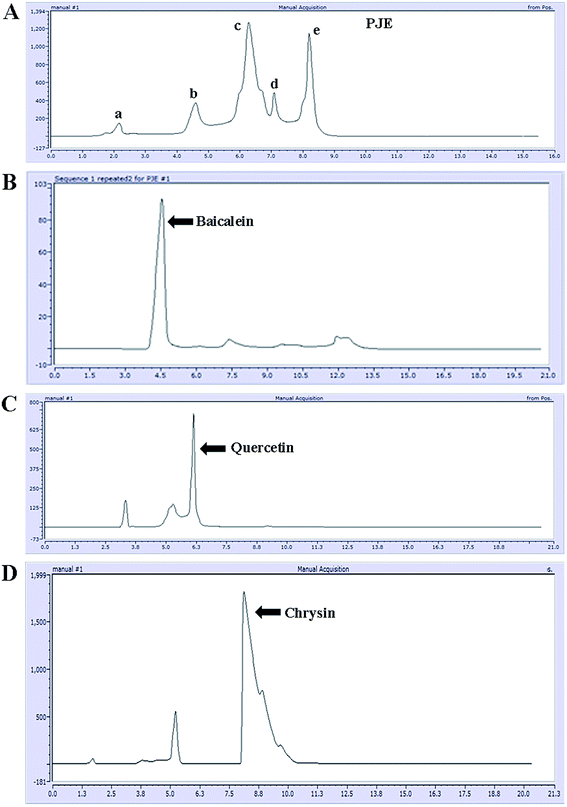 | ||
| Fig. 2 HPLC chromatogram of PJE (A). Major peaks present in the chromatogram were compared with respect to peaks of standard compounds baicalein (B), quercetin (C) and chrysin (D). | ||
3.2 Evaluation of antimicrobial activity of PJE against P. aeruginosa
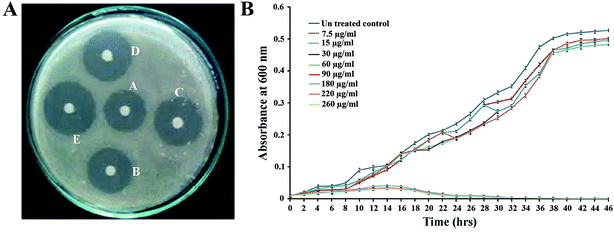
The antimicrobial activity of PJE against P. aeruginosa was assessed by the disc diffusion method in an agar plate. It was observed that the radius of inhibited zone was increased considerably with an increase in the amount of PJE (Fig. 3A). Results showed that PJE exhibits considerable antimicrobial activity against P. aeruginosa and the MIC value was found to be 180 μg mL−1. Considering the value of MIC, we selected 90 μg mL−1 (1/2 of MIC), 60 μg mL−1 (1/3 of MIC), 30 μg mL−1 (1/6 of MIC), 15 μg mL−1 (1/12 of MIC) and 7.5 μg mL−1 (1/24 of MIC) concentrations of PJE in the sub-MIC range to examine the antibiofilm potentiality against P. aeruginosa. Through sensitivity assay we have also found that baicalein at 300 μg mL−1 shows 65%, quercetin at 220 μg mL−1 shows 84.2% and chrysin at 225 μg mL−1 shows 60% inhibition of P. aeruginosa. From this observation we selected 150 μg mL−1, 125 μg mL−1, 100 μg mL−1, 75 μg mL−1, 50 μg mL−1 of baicalein; 90 μg mL−1, 100 μg mL−1, 110 μg mL−1, 120 μg mL−1, 130 μg mL−1 of quercetin; and 100 μg mL−1, 75 μg mL−1, 50 μg mL−1, 25 μg mL−1, 5 μg mL−1 of chrysin for further antibiofilm activity assay against P. aeruginosa. To evaluate unaltered growth pattern of P. aeruginosa for all these selected sub-MIC doses we studied bacterial growth kinetics after treating P. aeruginosa with different concentrations of PJE (260 μg mL−1, 220 μg mL−1, 180 μg mL−1, 90 μg mL−1, 60 μg mL−1, 30 μg mL−1, 15 μg mL−1 and 7.5 μg mL−1). We have observed that the growth kinetics of bacterial cells in PJE sub-MIC dose-treated samples remain unaltered, whereas for treatment with MIC doses and above, bacterial growth was significantly inhibited with respect to untreated control (Fig. 3B). This result suggests that the selected concentrations of PJE (90 μg mL−1, 60 μg mL−1, 30 μg mL−1, 15 μg mL−1, 7.5 μg mL−1) do not have antimicrobial activity, which can be applied to examine their effect on biofilm formation. In addition we also checked the effect of all selected sub-MIC doses of baicalein and chrysin on growth kinetics of P. aeruginosa. Here also we have observed that all these selected doses do not lead to growth inhibitory effect and thus do not alter the growth pattern of bacterial cells (data not shown).3.3 Attenuation of P. aeruginosa biofilm formation by sub-MIC doses of PJE, baicalein and chrysin
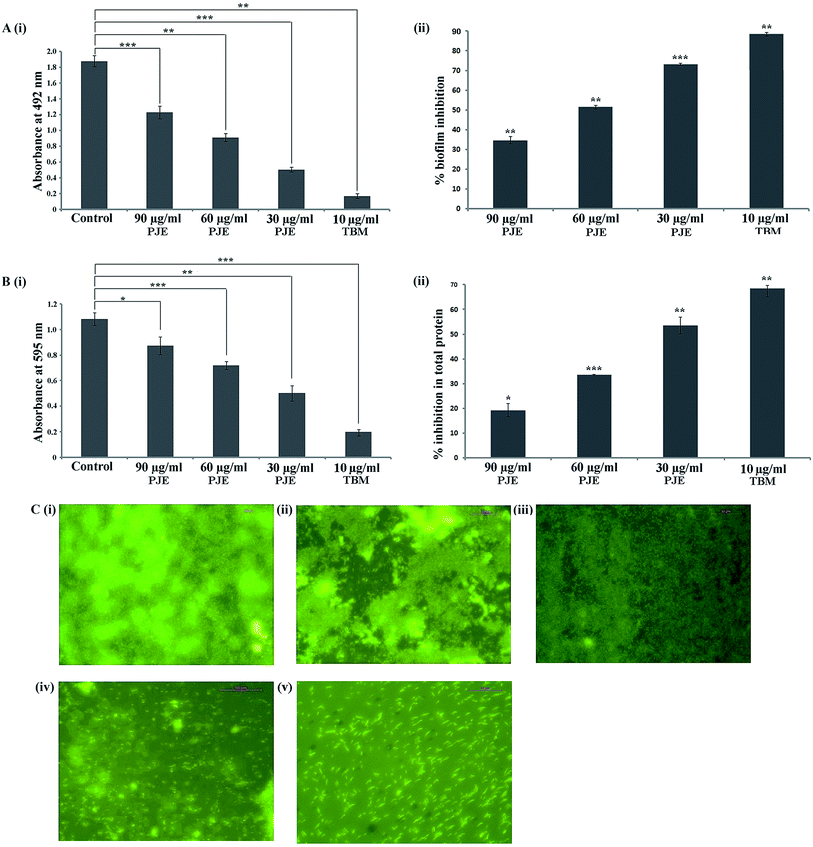
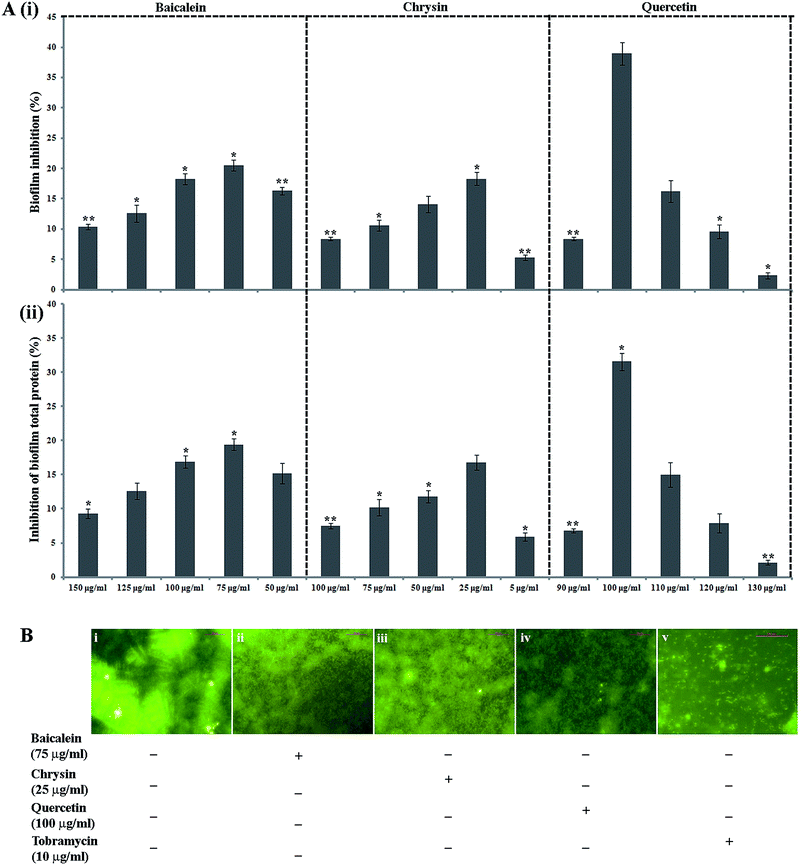
The antibiofilm property of PJE, baicalein, quercetin and chrysin against P. aeruginosa was investigated by estimation of biofilm through safranin staining, measurement of biofilm total protein and observation of biofilm under a fluorescent microscope. The result showed that all selected sub-MIC doses (90 μg mL−1, 60 μg mL−1, 30 μg mL−1) of PJE exhibited significant biofilm attenuation property. Interestingly it was observed that the lowest concentration (30 μg mL−1) gives maximum (73.16%) attenuation while the highest concentration (90 μg mL−1) gives minimum (34.66%) attenuation of biofilm with respect to untreated control [Fig. 4A(i)]. The result also showed that intermediate PJE concentration (60 μg mL−1) gives 51.44% attenuation in biofilm formation [Fig. 4A(ii)]. Thus the result establishes an inversely proportional relationship between the sub-MIC doses of PJE and microbial biofilm inhibition. Sub-MIC doses of baicalein [Fig. 5A(i)], quercetin [Fig. 5A(i)] and chrysin [Fig. 5A(i)] give moderate antibiofilm activity.Consistent with the result obtained from safranin staining assay, protein extraction assay also showed a similar inversely proportional activity with increase in concentration. It was observed that in comparison with the untreated control, all selected sub-MIC doses (90 μg mL−1, 60 μg mL−1, 30 μg mL−1) of PJE exhibited significant reduction in total protein that was extracted from adhered microbial population on the well surface [Fig. 4B(i)]. From the results it was found that 90 μg mL−1, 60 μg mL−1 and 30 μg mL−1 doses of PJE exhibited 19.24%, 33.49% and 53.56% inhibition of bacterial total protein with respect to untreated control [Fig. 4B(ii)]. Inhibition of biofilm total protein by baicalein, quercetin and chrysin was as per the biofilm inhibition. In this case we have found that baicalein at 75 μg mL−1 gave maximum 19.4% [Fig. 5A(ii)], quercetin at 100 μg mL−1 gave maximum 32.35% [Fig. 5A(ii)] and chrysin at 25 μg mL−1 gave maximum 16.8% [Fig. 5A(ii)] inhibition of biofilm total protein. It was also observed that comparatively higher doses of baicalein (Fig. 5B), quercetin (Fig. 5B) and chrysin (Fig. 5B) showed less biofilm attenuation.
To further support biofilm inhibition by sub-MIC doses of PJE (Fig. 4C), baicalein (Fig. 5B), quercetin (Fig. 5B) and chrysin (Fig. 5B), we observed the extent of microbial biofilm formation over cover slip surfaces under a fluorescent microscope. The result showed that all selected sub-MIC doses of PJE exhibited significant to moderate reduction in microbial biofilm formation whereas sub-MIC doses of baicalein, quercetin and chrysin exhibited moderate reduction in microbial biofilm formation. In this case maximum biofilm attenuation was observed after treatment with 30 μg mL−1 of PJE and minimum biofilm attenuation was observed after treatment with 90 μg mL−1 of PJE (Fig. 4C). In the antibiofilm activity assay we used tobramycin as standard drug against which activities of PJE, baicalein, quercetin and chrysin were evaluated. In these studies percentage biofilm and total protein inhibition were calculated with respect to untreated control.
3.4 Binding analysis of baicalein, quercetin and chrysin with quorum sensing associated proteins from P. aeruginosa
We performed docking analyses for baicalein, quercetin and chrysin against the biofilm activity related proteins of P. aeruginosa. The tertiary structures of LasA (PDB ID: 3IT7), LasI (PDB ID: 1RO5) and LasR (PDB ID: 3JPU) of las operon and of PilT (PDB ID: 3JVV) and PilY1 (PDB ID: 3HX6) proteins of pil operon were retrieved from the PDB database. As no structures were available for PilA, PilB and PilC proteins, they were modelled using Phyre2.24 PilA and PilC protein sequences resulted in protein models with very low confidence score, so the structures were discarded. PilB protein was modelled with good confidence score using template protein MsrB (PDB ID: 2K8D) from Methanothermobacter thermoautotrophicus str. DeltaH and was used for docking analysis. The coordinates for docking studies were obtained from the residues interacting with the native ligands of these proteins. For the homology modelled structures the coordinates of the residues corresponding to the homologous ligand interacting residues of template proteins were used. After docking baicalein, quercetin and chrysin with these proteins we have observed that all the proteins of las and pil operon have binding affinity for all three compounds. LasR (PDB ID: 3JPU) has highest binding affinity for baicalein and chrysin (Table 2) while PilT (PDB ID: 3JVV) has highest binding affinity for quercetin. In the case of LasA, LasR and PilT (Fig. 6A, B, D, F, 7A, B, D and F), baicalein and chrysin acquired the same binding pocket as that of native ligand, while for LasI, PilB and PilY1 (Fig. 6C, E, F, 7C, E and F) both compounds have different binding location from the native ligands. Quercetin acquired the same binding pocket as that of native ligands for LasA, LasI, LasR, PilT and PilY1 (Fig. 8A–D, F and G) but acquired a different binding pocket for PilB (Fig. 8E) (Table 2). The interactions between all the proteins and ligands were retained after energy minimization (Fig. 6–8).| No. | Protein | Ligand | Autodock binding scorea (kcal mol−1) | Potential energy (Epot) | ||||
|---|---|---|---|---|---|---|---|---|
| Baicalein | Chrysin | Quercetin | Baicalein | Chrysin | Quercetin | |||
| a Autodock gives a binding score indicating the binding affinity measured in kcal mol−1. Negative scores indicate high binding affinity whereas positive scores indicate weak binding. | ||||||||
| 1 | LasA | Glycine | −6.7 | −6.9 | −5.1 | −5.9011731 × 10⁵ | −5.9071588 × 10⁵ | −5.8986131 × 10⁵ |
| 2 | LasA | Tartaric acid | −7.6 | −7.5 | −3.4 | −5.9154388 × 10⁵ | −5.9773938 × 10⁵ | −5.9122994 × 10⁵ |
| 3 | LasI | Perrhenate | −5.8 | −5.9 | 25.4 | −6.4691419 × 10⁵ | −6.4370956 × 10⁵ | −5.8089875 × 10⁵ |
| 4 | LusR | TY4 | −10.8 | −11.0 | −5.2 | −5.9505344 × 10⁵ | −5.9374981 × 10⁵ | −6.4114612 × 10⁵ |
| 5 | PilB | Zinc ion | −7.2 | −7.1 | −5.4 | −5.8625700 × 10⁵ | −5.8460112 × 10⁵ | −5.7816444 × 10⁵ |
| 6 | PilT | ACP | −7.3 | −7.5 | −6.4 | −1.2151249 × 10⁶ | −1.2196224 × 10⁶ | −1.1124114 × 10⁶ |
| 7 | PilY1 | Calcium ion | −6.7 | −6.7 | 13.3 | −1.1490944 × 10⁶ | −1.1539544 × 10⁶ | −9.9747606 × 10⁵ |
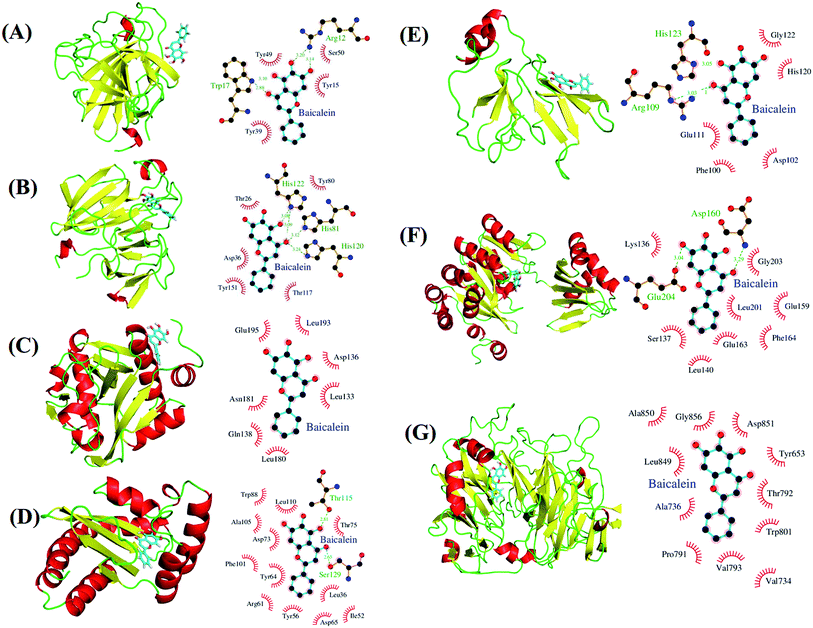 | ||
| Fig. 6 Potential biological targets of baicalein in P. aeruginosa. (A) LasA (PDB ID: 3IT7) in complex with baicalein docked in glycine binding pocket and ligplot image showing protein–ligand interactions. (B) LasA (PDB ID: 3IT7) in complex with baicalein docked in tartaric acid binding pocket and ligplot image showing protein–ligand interactions. (C) LasI (PDB ID: 1RO5) with baicalein docked in perrhenate (O4Re) binding pocket of its homologous protein EsaI (PDB ID: 1K4J) from bacterium Pantoea stewartii subsp. stewartii (Watson et al., 2002) and ligplot image showing protein–ligand interactions. (D) LasR (PDB ID: 3JPU) with baicalein docked in TY4 binding pocket and ligplot image showing protein–ligand interactions. (E) PilB protein in complex with baicalein docked in zinc binding pocket homologous to its template protein MsrB (PDB ID: 2K8D) from Methanothermobacter thermoautotrophicus str. DeltaH and ligplot image showing protein–ligand interactions. (F) PilT protein (PDB ID: 3JVV) in complex with baicalein docked into its phosphomethylphosphonic acid adenylate ester (C11H18N5O12P3) binding pocket and ligplot image showing protein–ligand interactions. (G) PilY1 (PDB ID: 3HX6) in complex with baicalein docked into its calcium binding pocket and ligplot image showing protein–ligand interactions. Proteins are displayed as cartoon models and coloured according to secondary structure content while the ligands are shown in sky blue colour as stick models. | ||
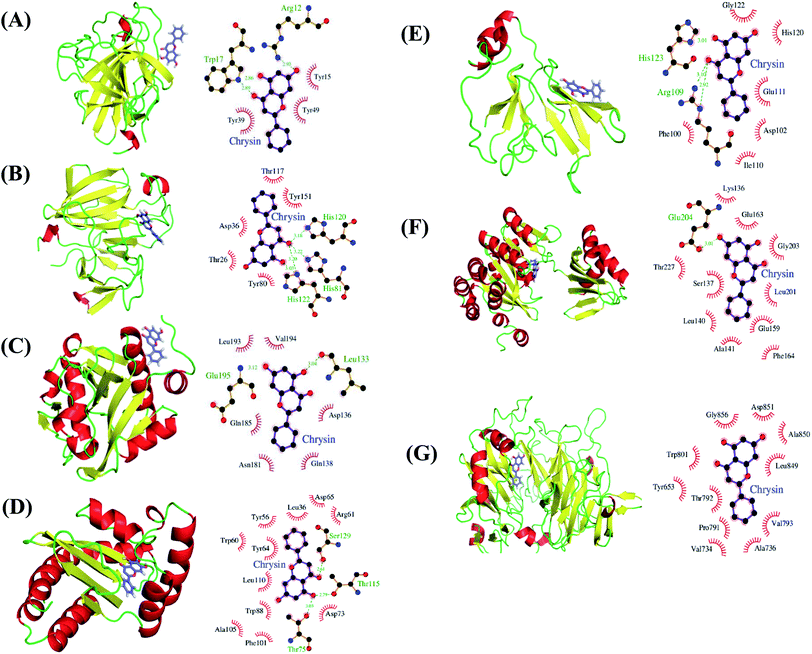 | ||
| Fig. 7 Potential biological targets of chrysin in P. aeruginosa. (A) LasA (PDB ID: 3IT7) in complex with chrysin docked in glycine binding pocket and ligplot image showing protein–ligand interactions. (B) LasA (PDB ID: 3IT7) in complex with chrysin docked in tartaric acid binding pocket and ligplot image showing protein–ligand interactions. (C) LasI (PDB ID: 1RO5) with chrysin docked in to perrhenate (O4Re) binding pocket of homologous protein EsaI (PDB ID: 1K4J) from bacterium Pantoea stewartii subsp. stewartii (Watson et al., 2002) and ligplot image showing protein–ligand interactions. (D) LasR (PDB ID: 3JPU) with chrysin docked in TY4 binding pocket and ligplot image showing protein–ligand interactions. (E) PilB protein in complex with chrysin docked in zinc binding pocket homologous to template protein MsrB (PDB ID: 2K8D) from Methanothermobacter thermoautotrophicus str. DeltaH and ligplot image showing protein–ligand interactions. (F) PilT protein (PDB ID: 3JVV) in complex with chrysin docked into phosphomethylphosphonic acid adenylate ester (C11H18N5O12P3) binding pocket and ligplot image showing protein–ligand interactions. (G) PilY1 (PDB ID: 3HX6) in complex with chrysin docked into calcium binding pocket and ligplot image showing protein–ligand interactions. Proteins are displayed as cartoon models and coloured according to secondary structure content while the ligands are shown in purple colour as stick models. | ||
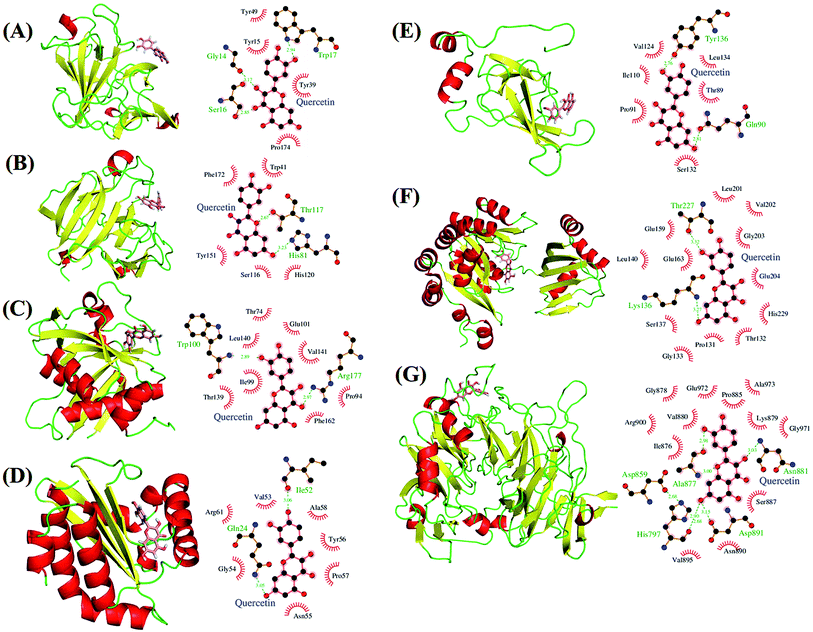 | ||
| Fig. 8 Potential biological targets of quercetin in P. aeruginosa. (A) LasA (PDB ID: 3IT7) in complex with quercetin docked in glycine binding pocket and ligplot image showing protein–ligand interactions. (B) LasA (PDB ID: 3IT7) in complex with quercetin docked in tartaric acid binding pocket and ligplot image showing protein–ligand interactions. (C) LasI (PDB ID: 1RO5) with quercetin docked in perrhenate (O4Re) binding pocket of homologous protein EsaI (PDB ID: 1K4J) from bacterium Pantoea stewartii subsp. stewartii (Watson et al., 2002) and ligplot image showing protein–ligand interactions. (D) LasR (PDB ID: 3JPU) with quercetin docked in TY4 binding pocket and ligplot image showing protein–ligand interactions. (E) PilB protein in complex with quercetin docked in zinc binding pocket homologous to template protein MsrB (PDB ID: 2K8D) from Methanothermobacter thermoautotrophicus str. DeltaH and ligplot image showing protein–ligand interactions. (F) PilT protein (PDB ID: 3JVV) in complex with quercetin docked into phosphomethylphosphonic acid adenylate ester (C11H18N5O12P3) binding pocket and ligplot image showing protein–ligand interactions. (G) PilY1 (PDB ID: 3HX6) in complex with quercetin docked into calcium binding pocket and ligplot image showing protein–ligand interactions. Proteins are displayed as cartoon models and coloured according to secondary structure content while the ligands are shown in salmon colour as stick models. | ||
3.5 Reduction in swarming motility after PJE treatment
As the constituent compounds in PJE exhibited very much lower antibiofilm activity than crude PJE itself, PJE was further explored for its effect on bacterial virulence property. We have observed that the swarming motility was minimally and maximally inhibited when the bacterial cells were treated with 90 μg mL−1 [Fig. 9(ii)] and 30 μg mL−1 [Fig. 9(iv)] concentrations of PJE respectively in comparison to untreated control [Fig. 9i]. Whereas treatment with 60 μg mL−1 of PJE exhibited intermediate attenuation of P. aeruginosa swarming motility [Fig. 9(iii)]. Consistent with the biofilm inhibition results, the swarming motility inhibition by PJE also followed the same trend in motility diameter (Table 3). To establish the relation between biofilm formation ability and swarming motility of the bacteria, we measured the correlation coefficient between these two variables and the result was found to be +0.992. This result suggests that swarming motility and biofilm formation are strongly correlated which indicates that when the swarming motility increases, biofilm formation also increases and vice versa.| PJE untreated control | 90 μg mL−1 | 60 μg mL−1 | 30 μg mL−1 | |
|---|---|---|---|---|
| a Values are expressed as mean ± SD of 3 independent experiments. **P value < 0.005 and ***P value < 0.0005 (vs. control). | ||||
| Distance of migration from centre (mm) | 17 ± 0.25 | 13 ± 0.36** | 7 ± 0.4*** | 2 ± 0.23*** |
3.6 Reduced secretion of P. aeruginosa virulence factors upon PJE treatment
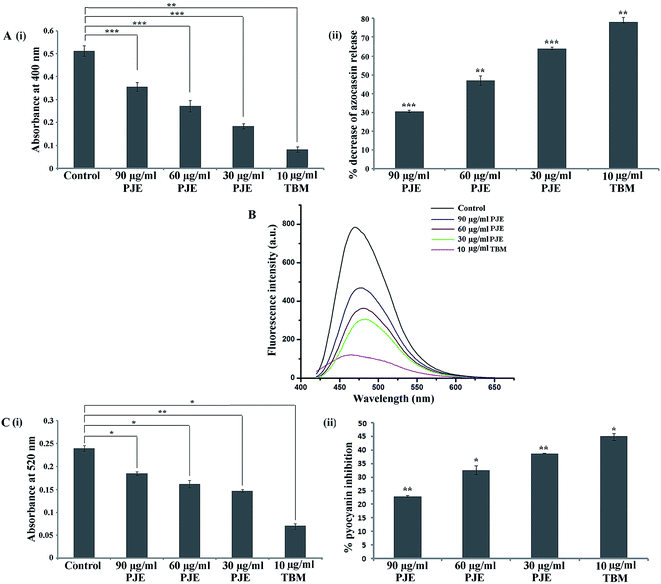
In this present work we measured the secretion of bacterial virulence factors like proteases, pyoverdin and pyocyanin upon treatment with PJE. The result of azocaseinolytic protease assay showed that in comparison to the PJE-untreated cells, PJE-treated microbial cells exhibited reduced level of protease activity wherein the proteolytic activity was maximally and minimally inhibited by 30 μg mL−1 and 90 μg mL−1 concentrations respectively [Fig. 10A(i)]. Upon calculation of percentage inhibition it was found that 30 μg mL−1 of PJE gave a maximum 64.13% inhibition in release of proteases by P. aeruginosa [Fig. 10A(ii)].In comparison to the PJE-untreated microbial cells, PJE-treated cells produce lesser amounts of pyoverdin (Fig. 10B) and pyocyanin (Fig. 10C) as well. From observed absorbances, percentage inhibition in pyocyanin release for 90 μg mL−1, 60 μg mL−1 and 30 μg mL−1 concentrations was found to be 22.92%, 32.5% and 38.75% respectively [Fig. 10C(ii)]. All results of virulence factors showed that all the tested sub-MIC doses of PJE exhibited significant reduction in virulence property compared to the extent of virulence factors produced by the PJE-untreated bacterial cells. We have also observed that the virulence factor secretion from the bacteria was maximally and minimally inhibited when the bacteria were treated with 30 μg mL−1 and 90 μg mL−1 concentrations of PJE respectively.
To establish the relation among microbial biofilm formation, swarming motility and virulence factor (pyocyanin) production by the microorganism under PJE treatment, we have constructed a contour plot among these three variables (biofilm inhibition (%), attenuation in swarming motility (%) and inhibition of pyocyanin (%) release) (ESI Fig. 2†). Experimental results showed that the pattern of microbial biofilm inhibition, inhibition in swarming motility and inhibition in pyocyanin (as virulence factor) release responds similarly with a decrease in PJE concentration. Thus the contour plot explains that when the organism gradually loses its biofilm-forming potentiality, simultaneously the organism loses the swarming motility and virulence factor production capacity as well.
3.7 Detection of nano-sized particles by atomic force microscopy
To explore the underlying cause of the inverse dose-dependent antibiofilm activity, we determined the size distribution of molecules present in 90 μg mL−1, 60 μg mL−1 and 30 μg mL−1 concentrations through atomic force microscopy. It was observed that 90 μg mL−1 concentration has much larger particles [Fig. 11(i)] than 60 μg mL−1 concentration where average particle size was 210 nm in height [Fig. 11(ii)]. For 30 μg mL−1 concentration, particle size of all compounds was within 85 nm whereas average particle height was 55 nm [Fig. 11(iii)]. Also, widths of all these particles were proportionally reduced with height of the particle. This indicates that for 30 μg mL−1 concentration, aggregation size of compounds was the smallest, but, with increase in concentration, the aggregation of compounds increases in size accordingly.4 Discussion
It has been reported in much literature that a biofilm is strongly associated with the drug resistance property of an organism.6 In this context it is noteworthy that eradication of biofilm is often considered to be a difficult task, and therefore the use of plant products to inhibit biofilm may be a viable alternative. Different solvent fractions of plant extracts are known to have antimicrobial and antibiofilm activity against a wide range of pathogenic organisms.4,6 The traditional use of different parts of Parkia javanica including fruits is already known to have therapeutic potentiality against diabetes, renal dysfunction, cholera and several other infections.10,11 Thus we hypothesize that the ethyl acetate fraction of methanolic fruit extract of this plant may exhibit antibacterial and antibiofilm activity against P. aeruginosa.Initially UV-visible and FTIR spectroscopic analysis reveals the presence of several compounds with diverse functional groups in PJE. Further presence of baicalein, quercetin and chrysin in PJE was confirmed by HPLC and NMR where peaks of purified baicalein, quercetin and chrysin were compared with peaks of PJE based on their retention time and chemical shift value12–14 under identical analytical conditions. PJE, baicalein, quercetin and chrysin may exhibit different biological activities. Thus we have evaluated the antimicrobial activity of PJE, baicalein, quercetin and chrysin against P. aeruginosa. The ability of a compound to diffuse in an agar plate depends on various properties like polarity, viscosity etc. which can influence considerably its antimicrobial activity in a plate assay. To overcome the solubility and diffusion of PJE on agar medium, MIC was determined. Antibiofilm activity was then studied with different sub-MIC doses which were selected because at these concentrations compounds do not affect the normal growth kinetics of the organism. Rather sub-MIC doses can modulate bacterial biofilm formation.
It was reported that microbial biofilm formation plays an important role for bacterial survival and exhibition of virulence.1 Therefore, a successful reduction in biofilm formation can be a potential strategy for the management of disease progression and elimination of a pathogen.4,6 In this context, we have assessed the antibiofilm property of PJE,34 baicalein,35 quercetin36,37 and chrysin38 against P. aeruginosa. Flavone compounds were reported to have antibacterial and antibiofilm activity against bacteria.17,39 As baicalein, quercetin and chrysin are flavone compounds, thus we have assessed their antibiofilm effect against the Gram-negative bacterium P. aeruginosa. To compare the bacterial population size in biofilm, we have determined the total extractable protein from the adhered microbial population on the well surface (see Materials and methods). Total extractable protein has been considered as an efficient strategy to measure biofilm biomass. A higher extractable protein concentration means higher microbial biomass in biofilm and vice versa. To further support the effect of PJE on biofilm formation, we have compared the extent of microbial biofilm formation on cover slip surfaces. Thus we have found that PJE at 30 μg mL−1 dose exhibits significant antibiofilm activity whereas baicalein, quercetin and chrysin individually exhibit very much lower to moderate antibiofilm activity. In this case each individual flavone compound also shows higher activity at comparatively lower doses. This reverse dose-dependent effect of PJE may be considered as a result of synergic action of all compounds in diffusion or else alteration in properties like polarity, viscosity etc. to exhibit an antibiofilm effect. Further, to understand the binding affinity of baicalein, quercetin and chrysin with biofilm associated proteins of P. aeruginosa we have performed in silico molecular docking. Binding affinity prediction showed that all three of these compounds interact with the biofilm associated proteins LasA, LasI, LasR, PilB, PilT and PilY1. Their affinity for pilus biogenesis factor PilY1 (ref. 40) and other fimbrial assembly related proteins PilT and PilB indicate that these compounds may impair the pilus assembly, and therefore the twitching motion and intercellular interaction among the bacteria. Their strong interactions with the las operon associated proteins may also be a reason for the disruption of biofilm formation activity of bacteria. The binding affinity study reveals that baicalein, quercetin and chrysin exhibit attenuation of P. aeruginosa attachment and colonisation, which leads to attenuation of biofilm. As a whole, the antibiofilm activity study suggests that because of the presence of several compounds, PJE exhibited significant antibiofilm activity which is very much higher than the antibiofilm activity of the individual compounds baicalein, quercetin and chrysin.
To investigate the underlying mechanism of the microbial biofilm modulation by PJE, we have measured the swarming motility of both PJE-treated and untreated cells. Swarming motility is an important attribute of P. aeruginosa which enhances the translocation speed and promotes better colonization of a surface.6 It was reported that higher swarming motility facilitates microbial biofilm formation efficiently.41 Any interference with the swarming motility of an organism is known to affect the biofilm formation property considerably.42 Thus, in the present study, we hypothesize that biofilm inhibition by PJE could be attributed to the interference or reduction in bacterial swarming motility along with other virulence factors.
Existing literature documents that microbe-mediated pathogenesis is often associated with biofilm formation as microorganisms in biofilm secrete several virulence factors.43 Virulence factors are known to play an important role during invasion of microorganisms into hosts. P. aeruginosa secretes a range of virulence factors including several proteases, pyoverdin, pyocyanin etc. facilitating disease progression.31 Proteases are hydrolytic enzymes that affect the proteins of host cells (infected tissue), thereby facilitating bacterial invasion and growth into host cells. Azocasein is a sensitive substrate for proteases where hydrolysis of the casein releases azo dye into the media which can be detected by measuring the absorbance at 440 nm.44 Pyoverdin and pyocyanin are types of virulence factors (siderophores) expressed by several Gram-negative bacteria including P. aeruginosa. Pyoverdin promotes bacterial growth through improving iron availability which renders an infected host cell in an iron-deficient condition.4 Pyocyanin is the blue-green secondary pigment produced by P. aeruginosa.32 Pyocyanin can kill mammalian cells by targeting a wide range of cellular components and pathways including electron transport chain, vesicular transport and cell growth.32 Thus, in the current study we have measured the pyoverdin and pyocyanin production efficiency of PJE-treated and untreated cells. To graphically represent the relationship among microbial biofilm formation, swarming motility and virulence factor (pyocyanin) production by the microorganism under PJE treatment, we have constructed a contour plot. A contour plot is a graphical approach for representing a 3-dimensional surface by plotting constant Z slices, called contours, in a 2-dimensional format. Thus, the contour plot depicts change in Z dimension with respect to X and Y dimension.
To explore the underlying cause of the reverse dose-dependent antibiofilm activity, we have determined the size distribution of molecules present in 90 μg mL−1, 60 μg mL−1 and 30 μg mL−1 concentrations through atomic force microscopy. Here we found that particle sizes are smallest in 30 μg mL−1 (less aggregation) and biggest in 90 μg mL−1 (more aggregation) concentration. This is a unique property of nano-size compounds to form bigger aggregates at higher concentration.45 But how these nanoparticles were formed with dilution is not known to us, which will need further study of size reduction. Formation of bigger size aggregates may reduce bacterial membrane permeability which in turn may reduce the bioactivity as well.45 Thus PJE at 30 μg mL−1 concentration exhibits higher biofilm attenuation in comparison with higher concentrations. The mechanism of particle size reduction of plant extract with dilution has not been reported yet. But higher bioactivity due to smaller nano-sized particles at lower concentration of compounds has already been reported in the literature.45–47 In our present investigation, the size distribution study reveals that with dilution up to 30 μg mL−1 concentration, smallest nano-sized particles were formed. And likewise due to free nanoparticles, the 30 μg mL−1 concentration exhibited increased antibiofilm activity.
In a nutshell, we can conclude that PJE has antimicrobial properties at MIC levels whereas at sub-MIC doses it exerts significant inhibition of biofilm formation along with reduced production of virulence factors in an inverse dose-dependent manner. In addition PJE contains flavonoids like baicalein, quercetin and chrysin which also exhibit a moderate antibiofilm effect mediated through bacterial attachment and colonisation. Strategies for diminishing the development of biofilm and secretion of several virulence factors through changes in metabolic activity could serve as important steps towards management of infections. Thus the results of the present study of the ethyl acetate fraction of Parkia javanica fruit extract indicate that it may be explored as an antibiofilm agent against various Gram-negative organisms for overcoming biofilm-related pathogenesis.
Conflict of interest
The authors declare that there is no conflict of interests regarding the publication of this paper. The manuscript has not been submitted to more than one journal for simultaneous consideration and not been published previously. No data have been fabricated or manipulated to support our conclusions.Acknowledgements
The authors gratefully acknowledge State Biotech Hub and Dr Syed Arshad Hussain, Dept. of Physics, Tripura University for use of their instrumental facility. The authors also thank Prof. Dipak Ranjan Mal, Dept. of Chemistry, IIT Kharagpur for performing NMR spectroscopy of PJE. Research in YA laboratory is supported by extramural grants from University Grants Commission and SERB-Department of Science & Technology (Government of India). UCD acknowledge DBT, Govt. of India (BT/526/NE/TBP/2013) YA laboratory also thanks Central University of Himachal Pradesh and Bioinformatics Resources and Applications Facility (BRAF), CDAC for providing computational infrastructure.References
- M. R. Parsek and P. K. Singh, Annu. Rev. Microbiol., 2003, 57, 677–701 CrossRef CAS PubMed
.
- D. Lieberman, Am. J. Respir. Crit. Care Med., 2003, 2, 459–468 Search PubMed
.
- C. Delden and B. H. Iglewski, Emerging Infect. Dis., 1998, 4, 551–560 CrossRef PubMed
.
- R. Sarkar, S. K. Chaudhary, A. Sharma, K. K. Yadav, N. K. Nema, M. Sekhoacha, S. Karmakar, F. C. Braga, M. G. Matsabisa, P. K. Mukherjee and T. Sen, J. Ethnopharmacol., 2014, 154, 170–175 CrossRef PubMed
.
- S. J. Projan and P. J. Youngman, Curr. Opin. Microbiol., 2002, 5, 463–465 CrossRef PubMed
.
- L. Kumar, S. Chhibber and K. Harjai, Fitoterapia, 2013, 90, 73–78 CrossRef CAS PubMed
.
- S. Chatterjee, A. Saikia, P. Dutta, D. Ghosh, G. Pangging and A. K. Goswami, Forest Conservation Programme, New Delhi, India, 2006 Search PubMed
.
- B. K. Dutta and P. K. Dutta, Indian J. Tradit. Knowl., 2006, 4, 7–14 Search PubMed
.
- M. H. Khan and P. S. Yadava, Indian J. Tradit. Knowl., 2010, 9, 510–514 Search PubMed
.
- K. Majumder, B. K. Dutta and D. Roy, Inventory and status of medicinal trees of Tripura. Indian Medicinal Plants, ed. P. C. Trivedi, Avishkar publishers, 2009, pp. 93–123 Search PubMed
.
- S. Bhardwaj and S. K. Gakhar, Indian J. Tradit. Knowl., 2005, 4, 75–80 Search PubMed
.
- K. R. Markham and H. Geiger, in Flavonoids: Advances in Research since 1986, ed. J. B. Harborne, Chapman & Hall, London, 1994 Search PubMed
.
- P. K. Agrawal, Carbon-13 NMR of Flavonoids, Elsevier, Amsterdam, 1989 Search PubMed
.
- Q. M. Andersen and K. R. Markham, Flavonoids: Chemistry, Biochemistry and Applications, CRC Taylor & Francis, London, 2006 Search PubMed
.
- R. W. Bauer, M. D. K. Kirby, J. C. Sherris and M. Turck, Am. J. Clin. Pathol., 1966, 45, 493–496 Search PubMed
.
- NCCLS, Performance Standards for Antimicrobial Disk Susceptibility Tests: Approved Standard M2-A7, National Committee for Clinical Laboratory Standards, Wayne, PA, USA, 1997 Search PubMed
.
- M. C. Das, P. Sandhu, P. Gupta, P. Rudrapaul, U. C. De, P. Tribedi, Y. Akhter and S. Bhattacharjee, Sci. Rep., 2016, 22(6), 23347 CrossRef PubMed
.
- S. Gowrishankar, N. D. Mosioma and S. K. Pandian, Evid. Based Complement. Alternat. Med., 2012, 16 Search PubMed
.
- D. Schillaci, M. G. Cusimano, V. Cunsolo, R. Saletti, D. Russo, M. Vazzana, M. Vitale and V. Arizza, AMB Express, 2013, 3, 35 CrossRef PubMed
.
- O. H. Lowry, N. J. Rosebrough, A. L. Farr and R. J. Randall, J. Biol. Chem., 1951, 193, 265–275 CAS
.
- P. Tribedi and A. K. Sil, J. Appl. Microbiol., 2013, 116, 295–303 CrossRef PubMed
.
- Y. Wang, J. Xiao, T. O. Suzek, J. Zhang, J. Wang and S. H. Bryant, Nucleic Acids Res., 2009, 37, W623–W633 CrossRef CAS PubMed
.
- F. C. Bernstein, T. F. Koetzle, G. J. Williams, E. F. Meyer, M. D. Brice, J. R. Rodgers, O. Kennard, T. Shimanouchi and M. Tasumi, Eur. J. Biochem., 1977, 80(2), 319–324 CrossRef CAS PubMed
.
- L. Kelley and B. Jefferys, Phyre2: Protein Homology/analogY Recognition Engine V 2.0. Structural Bioinformatics Group, Imperial College, London, 2011, vol. 22 Search PubMed
.
- G. M. Morris, R. Huey, W. Lindstrom, M. F. Sanner, R. K. Belew, D. S. Goodsell and A. J. Olson, J. Comput. Chem., 2009, 30(16), 2785–2791 CrossRef CAS PubMed
.
- O. Trott and A. J. Olson, J. Comput. Chem., 2010, 31(2), 455–461 CAS
.
- W. L. DeLano, The PyMOL molecular graphics system, 2002 Search PubMed
.
- R. A. Laskowski and M. B. Swindells, J. Chem. Inf. Model., 2011, 51(10), 2778–2786 CrossRef CAS PubMed
.
- M. C. Das, S. Paul, P. Gupta, P. Tribedi, S. Sarkar, D. Manna and S. Bhattacharjee, J. Appl. Microbiol., 2016, 120(4), 842–859 CrossRef CAS PubMed
.
- E. Kessler, M. Safrin, J. C. Olson and D. E. Ohman, J. Biol. Chem., 1993, 268, 7503–7508 Search PubMed
.
- A. Adonizio, K. F. Kong and K. Mathee, Antimicrob. Agents Chemother., 2008, 52, 198–203 CrossRef CAS PubMed
.
- D. W. Essar, L. Eberly, A. Hadero and I. P. Crawford, J. Bacteriol., 1990, 172, 884–900 CrossRef CAS PubMed
.
- K. Mukherjee, P. Tribedi, B. Mukhopadhyay and A. K. Sil, FEMS Microbiol. Lett., 2013, 338, 177–183 CrossRef CAS PubMed
.
- M. Šikić Pogačar, A. Klančnik, F. Bucar, T. Langerholc and S. Smole Možina, J. Sci. Food Agric., 2016, 96(8), 2723–2730 CrossRef PubMed
.
- E. Kvasnickova, O. Matatkova, A. Cejkova and J. Masak, J. Microbiol. Methods, 2015, 118, 106–112 CrossRef CAS PubMed
.
- Z. Lou, C. Li, X. Kou, F. Yu, H. Wang, G. M. Smith and S. Zhu, J. Food Prot., 2016, 79, 1404–1409 CrossRef CAS PubMed
.
- J. H. Lee, J. H. Park, H. S. Cho, S. W. Joo, M. H. Cho and J. Lee, Biofouling, 2013, 29(5), 491–499 CrossRef CAS PubMed
.
- N. Nina, C. Quispe, F. Jiménez-Aspee, C. Theoduloz, G. E. Feresín, B. Lima, E. Leiva and G. Schmeda-Hirschmann, Molecules, 2015, 20, 18144–18167 CrossRef CAS PubMed
.
- H. S. Cho, J. H. Lee, M. H. Cho and J. Lee, Biofouling, 2015, 31(1), 1–11 CrossRef CAS PubMed
.
- J. Orans, M. D. Johnson, K. A. Coggan, J. R. Sperlazza, R. W. Heiniger, M. C. Wolfgang and M. R. Redinbo, Proc. Natl. Acad. Sci. U. S. A., 2010, 107(3), 1065–1070 CrossRef CAS PubMed
.
- N. Verstraeten, K. Braeken, B. Debkumari, M. Fauvart, J. Fransaer, J. Vermant and J. Michiels, Trends Microbiol., 2008, 16, 496–506 CrossRef CAS PubMed
.
- C. D. L. Fuente-Núñez, V. Korolik, M. Bains, U. Nguyen, E. B. M. Breidenstein, S. Horsman, S. Lewenza, L. Burrows and R. E. W. Hancock, Antimicrob. Agents Chemother., 2012, 56, 2696–2704 CrossRef PubMed
.
- P. Williams, Int. J. Med. Microbiol., 2006, 296, 57–59 CrossRef PubMed
.
- K. S. Musthafa, V. Saroja, S. K. Pandian and A. V. Ravi, J. Biosci., 2011, 36, 55–67 CrossRef CAS PubMed
.
- J. R. Morones, J. L. Elechiguerra, A. Camacho, K. Holt, J. B. Kouri, J. T. Ramirez and M. J. Yacaman, Nanotechnology, 2005, 16, 2346–2353 CrossRef CAS PubMed
.
- M. Simitsopoulou, D. Kyrpitzi, A. Velegraki, T. J. Walsh and E. Roilides, Antimicrob. Agents Chemother., 2014, 58, 4953–4956 CrossRef PubMed
.
- J. J. Harrison, R. J. Turner, D. A. Joo, M. A. Stan, C. S. Chan, N. D. Allan, H. A. Vrionis, M. E. Olson and H. Ceri, Antimicrob. Agents Chemother., 2008, 52, 2870–2881 CrossRef CAS PubMed
.
Footnotes |
| † Electronic supplementary information (ESI) available. See DOI: 10.1039/c6ra24603f |
| ‡ Authors equally contributed to this work. |
| This journal is © The Royal Society of Chemistry 2017 |


