 Open Access Article
Creative Commons Attribution 3.0 Unported Licence
Monoclinic Ga2O3 (100) surface as a robust photocatalyst for water-splitting†
Yaqiang Ma a,
Xu Zhao*a,
Mengmeng Niua,
Wei Lia,
Xiaolong Wang
 a,
Caiyun Zhaia,
Tianxing Wanga,
Yanan Tangb and
Xianqi Dai*ab
aCollege of Physics and Electronic Engineering, Henan Normal University, Xinxiang 453007, China. E-mail: zhaoxu@htu.cn; xqdai@htu.cn
bDepartment of Physics, Zhengzhou Normal University, Zhengzhou, Henan 450044, China
First published on 16th January 2017
Abstract
The β-Ga2O3 (100) surface, with or without defects, as a robust photocatalyst for water decomposition was studied on the basis of density functional theory (DFT). The surface defects considered, herein, were oxygen vacancies and doping with higher chalcogens, such as S, Se and Te. Narrowed bandgaps of the defective surfaces, leading to a high utilization of solar energy with respect to pure Ga2O3, were observed. By optimizing the geometrical structures of the initial molecular adsorption states (IS), the transition states (TS) and the final dissociative adsorption states (FS), the reaction activation energy and the adsorption energy of each species in the reaction pathway were obtained. Water acts as a Lewis base and provides electrons to the surfaces. The presence of water on the surfaces more likely preferred the molecular modes. The reaction results demonstrate that the surface is robust for water decomposition, where the defects, both vacancies and doping with high chalcogens, have no evident influence on the reaction parameters. The reaction pathway can be improved by vacancies or Se doping. These findings for water decomposition on Ga2O3 (100) surfaces can be used in synthesis of photocatalysts and for understanding the interactions across the reaction pathway.
Introduction
Hydrogen is considered the ultimate clean energy source for solving the global energy and environmental issues. There are several ways of producing hydrogen, such as from fossil fuels, natural gas by steam reforming,1–3 electrolysis of water,4 reforming of biomass,5 and photocatalytic water-splitting.6–8 Producing hydrogen from water using natural energy, such as sunlight, is considered one of the most promising technologies for solving these problems. Semiconductors with a d10 electron configuration have attracted considerable attention for superior photocatalytic activities, mainly due to their conduction bands being formed by hybridized sp orbits with a large dispersion, which makes them able to generate photoexcited electrons with large mobility.9–11 As a representative of such d10 materials, gallium oxide (Ga2O3) exhibits high activity in water-splitting and in the degradation of organic pollutants. Among the five polymorphs of gallium oxide,12 the β phase with a monoclinic structure was reported to be commonly formed under ordinary conditions. This material has drawn much attention for its potential application in optoelectronic devices, gas sensors, spintronic devices, etc.13–18 In addition, several theoretical simulations have been conducted to explore its structural,19,20 electronic,21 and optical properties.22Recently, β-Ga2O3 has also been particularly noted because of its high photocatalytic activity for the water-splitting reaction.23 The most stable low index surface of β-Ga2O3 is the (100)-B type, as has been proven by theoretical calculations and experiments.20,24 The absorption behaviors of materials such as CO2,25 CH4,26 H2,27–29 formate,2 and CH3OH,30 on Ga2O3 have been investigated using DFT methods, with most of these simulations based on the (100) termination surface. However, the large bandgap of β-Ga2O3 (about 4.8 eV) leads to a low utilization of the solar spectrum because the material is only active in the ultraviolet region. Moreover, vacancies and doping on non-metal atoms of the catalysts are feasible considerations to improve the photo-adsorption properties by influencing the electronic structure of the photocatalysts. It was found that N doping can lead to a p-type electrical conductivity32 and enable tunable light emission.33 The study also showed that the non-metal doping of Ga2O3 could provide an optical bandgap in the visible region.31
In the published literature about photocatalytic water-splitting, the interactions between water and the surfaces of catalysts have been a very important subject.14,34–36 Considering photocatalysts based on Ga2O3 (100) surfaces, several researchers have paid great attentions to their catalytic efficiency and optical properties through carrying out experiments involving the surfaces.37–40 Water adsorption on low index α-Ga2O3 surfaces, with high activation but low stability, was proven by theoretical simulations.41 Moreover, for the most stable phase of β-Ga2O3, the favorable reaction path for water-splitting on a perfect surface and on a NiOx-cluster-modified surface were studied, and it was shown that the β-Ga2O3 (100) surface after loading NiOx had a significant enhancement of activity for generating oxygen.42,43 To the best of our knowledge, there is no report in literature on the impact of the water-splitting reaction with chalcogenide doping. Because the partial decomposition (H2O → H + OH) of water is easier than the complete decomposition (H2O → 2H + O), the surface hydroxyl radical is more critical for photocatalysis. Hence, in this study, we only considered the partial decomposition of water.
In this study, we performed DFT calculations to investigate the water adsorption and decomposition on β-Ga2O3 (100) surfaces. Introducing a non-metal vacancy and chalcogen doping were considered to ameliorate the solar utilization and reaction path. The main purpose of this study was to comprehend the interactions between water and the photocatalytic surfaces in order to supply theoretical guidance to efficiently synthesize Ga2O3 catalysts.
Computational details and models
All the DFT calculations were performed using the Vienna Ab-initio Simulation Package (VASP) code.44,45 The projector-augmented wave (PAW) method was applied to describe the electron–ion interactions.46,47 The exchange–correlation potentials were described through the Predew–Burke–Ernzerhof (PBE) function within the generalized gradient approximation (GGA) formalism.46 A plane wave basis set with a cutoff energy of 420 eV and a 5 × 3 × 1 k-points grid, determined by the Monkhorst–Pack method48 for all the surfaces were found to give good converged results. The atomic structures were relaxed using the conjugate gradient algorithm as implemented in the VASP code until the forces on all the unconstrained atoms were smaller than 0.01 eV Å−1. Dipole correction calculations were performed to compensate for the long-range dipolar interactions with periodic images across the vacuum region. Transition states along the reaction pathway were tested using the CI-NEB (climbing image nudged elastic band) method49,50 and the number of images inserted between the IS and FS were approximately equal to three times the number obtained by the running script (dist.pl) in the VTST script packages.51The formation energies of X-doped defect surfaces, ΔEXf, and the adsorption energies of H2O on all the substrate surfaces,  , are defined as follows:
| ΔEXf = ETotalX-doped − ETotalpefect + μO − μX, |
where ETotalX-doped, ETotalpefect,
 and ETotalSub represent the total energy of the surfaces with and without dopants, and with and without H2O absorption, respectively. The quantity μX (X = O, S, Se, Te and H2O) is the chemical potential of the X atom or molecule obtained from the energy calculation for the X atom or molecule in a cubic cell with a side length of 15 Å. According to the above definitions, positive values of the absorption energy correspond to an endothermic process, whereas negative values indicate that the adsorption is thermodynamically favorable.
The average difference in electron density for water adsorption on the β-Ga2O3 (100) surfaces along the z direction is defined as follows:
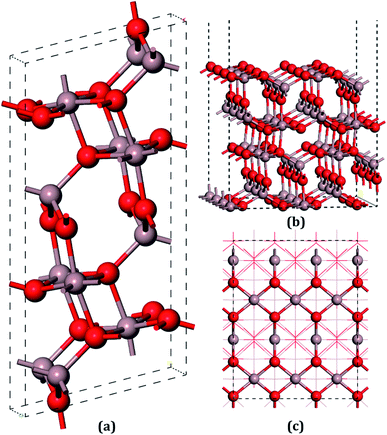
The unit cell of β-Ga2O3 contains 8 Ga and 12 O atoms with a base centered monoclinic structure (Fig. 1(a)). Gallium atoms can be divided into two categories: Ga1, which is tetrahedrally coordinated, and Ga2, which has six O neighbors in a distorted octahedral arrangement. Furthermore, the oxygen atoms can be distinguished by O1, O2 and O3. O1, shared by one octahedron and two tetrahedron gallium atoms, is not on the same plane of a Ga triangle, whereas O2, shared by two octahedrons and one tetrahedron, lies in the plane of a Ga triangle. In addition, O3 has four Ga neighbors tetrahedrally arranged. A vacuum layer of 15 Å between successive slabs along the [001] direction was used to separate the two heterostructures in order to avoid spurious interactions due to the nonlocal nature of the correlation energy.52 The perfect (100) surface is shown in Fig. 1(b) and (c). On the pure surface, 4-fold-coordinated gallium (Ga1), 5-fold-coordinated gallium (Ga2), 3-fold-coordinated oxygen (O1) and 3-fold-coordinated (O3) were exposed, among which Ga2 and O3 were unsaturated. In total, hundred and twenty atoms with twenty-four molecular units in the slabs were distributed in six atomic layers. The bottom two layers were fixed in their bulk positions in all the calculations, whereas the top four layers, together with the adsorbents, were allowed to relax.
Results and discussion
1. Electronic properties of the β-Ga2O3 (100) surface with an oxygen vacancy or doped with higher chalcogens (S, Se and Te)
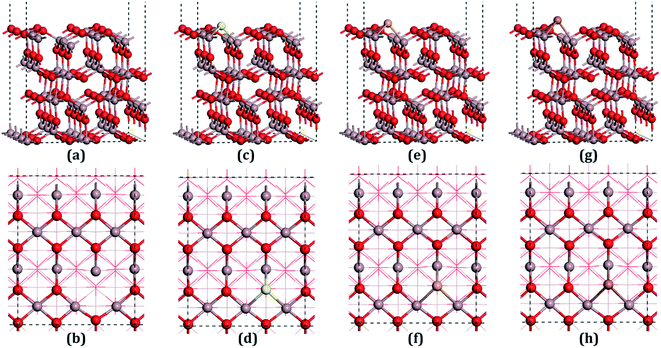
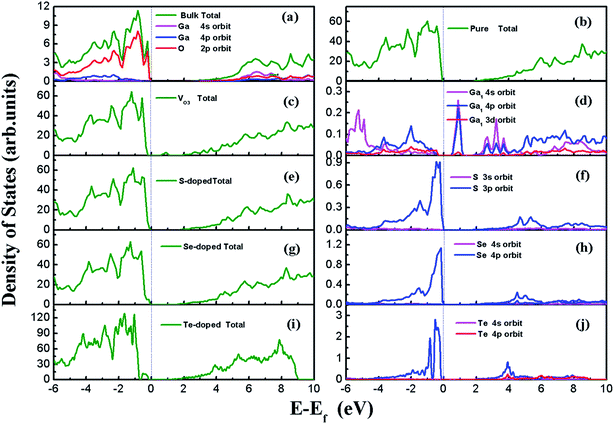
β-Ga2O3 has a C2/m symmetry with four formula units per crystallographic cell, and is characterized by four lattice parameters, namely a, b, c and β. The optimized lattice parameters for β-Ga2O3 are a = 12.26 Å, b = 3.05 Å, c = 5.82 Å, and β = 103.65°, and agree well with experimental values and other DFT values.23,31,40 The density of states (DOS) of the bulk β-Ga2O3, shown in Fig. 3(a), was calculated to obtain the structure of the electronic states for the material. The valance band (VB) was mainly contributed by the oxygen 2p orbits, where the O3 component was the smallest and O2 the largest. In the conductive band (CB), the gallium s character was the main component and the 3s orbits of the Ga2 atoms were slightly larger than those of the Ga1. The energy bandgap (Eb) in this calculation was 2.29 eV (less than the experimental value, which is within 4.6–4.8 eV), which can be explained by the GGA-PBE pseudopotential chosen in the DFT calculations, which underestimates the bandgap by 2–3 eV, and overestimates the lattice parameters. The agreement with the other DFT values was excellent.Four types of positions for both vacancies and doping were considered in the initial configurations, which were categorized by the atoms on the surfaces. The most stable structures of the defect surfaces are shown in Fig. 2, which are all located at O3 sites, not only for vacancies but also for the doping with S, Se and Te. The calculated formation energy of the VO3 surface is 2.909 eV, which is higher than those reported earlier.14,15 This may be due to the different choice of the chemical potential of the oxygen atoms in this study compared to the other reports in the literature. A single value of atomic energy was used in this study, which was half the energy of molecular oxygen described in the previous literature. For S-, Se-, and Te-doped surfaces, the formation energies are listed in Table 1. The S-doped surface had the lowest energy and the Te-doped surface had the highest energy because the large radius of the Te atom hinders the doping. There were only a few areas of damage in the construction of the surfaces, which demonstrated that the defects were reasonable. For VO3 (Fig. 2(a and b)), the most distorted part after optimization was around the Ga1 site. Because of the relatively large atomic radius of S, Se and Te compared to O (Te 1.44 Å, Se 1.15 Å, S 1.01 Å, O 0.60 Å), the Ga–X (X = S, Se and Te) bond lengths were elongated, leading to the dopants being above the surfaces by 0.75 Å, 0.97 Å and 1.15 Å, respectively.
| ΔEXf | eGa1 | eGa2 | eO1 | eO3 | echalcogen | ΔeSurf. | Δh | |
|---|---|---|---|---|---|---|---|---|
| Bulk | −1.837 | −1.884 | 1.240 | 1.243 | ||||
| Perfect | −1.810 | −1.859 | 1.207 | 1.213 | −7.497 | |||
| VO3 | 2.909 | −1.046 | −1.644 | 1.194 | 1.201 | −7.429 | ||
| S-doped | 3.307 | −1.651 | −1.739 | 1.221 | 1.217 | 0.797 | −7.514 | 0.745 |
| Se-doped | 4.005 | −1.594 | −1.697 | 1.221 | 1.217 | 0.630 | −7.522 | 0.968 |
| Te-doped | 4.849 | −1.515 | −1.619 | 1.222 | 1.220 | 0.390 | −7.553 | 1.150 |
The DOS of all the surfaces are shown in Fig. 3. For the perfect (100) surface, the total DOS for the structure was almost the same as for the DOS of the bulk; however, the bandgap was slightly smaller than that for the unit cell, as shown in Fig. 3(b). An extra peak appeared in the DOS for VO3 (seen in Fig. 3(c)) between CBM and VBM, which is called the “impurity state”. The peak comes from the three dangling bonds left behind after O3 leaves. The impurity state is mainly contributed by the 4s and 4p orbits of Ga near the defect site, with the Ga1 atom having the greatest contribution, as indicated in Fig. 3(d). The band gaps for the S-doped surface, Se-doped surface and Te-doped surface were 1.84 eV, 1.66 eV and 1.49 eV, respectively. The VBM edges of the doped systems were shifted upwards, and were mainly composed of S 3p, Se 4p and Te 5p orbits, which are shown in Fig. 3(d), (f) and (j), whereas the CBM remained almost unchanged. This was due to the higher energy of S 3p, Se 4p and Te 5p compared to the O 2p orbits, in which this trend is consistent with the other results.31 The narrowing band gap indicates that the utilization ratio of solar energy for water-splitting by this type of photocatalysts, if they could be used, would be significantly improved.
Charge transfer was calculated by Bader charge analysis53–55 to further understand the distribution of surface atoms, which are labeled in Table 1. Although the absolute values of the Bader charges are not the exact values for the electrons transferred, the relative values can clearly show us the distribution of charges. In this article, negative values indicate electron loss, whereas positive values represent a gain in electrons. Ga1, Ga2, O1, and O3, respectively, denote the atom types defined in the previous paragraph. However, for the deficient surfaces, they represent the atom's proximity to the defects, because the symmetries are destroyed by the defects.
The ΔeSurf. in Table 1 is defined as the sum of charge transfers for all the atoms on the surfaces. For all the surfaces, the ΔeSurf. had negative values, which indicates that the surfaces had lost charge and could easily gain electrons. Surfaces with a charge loss or gain will more easily absorb small molecules.47 Comparing all the surfaces together, the ΔeSurf. for the VO3 surface was the lowest (7.429 |e|), whereas the Te-doped surface lost the most charge (7.553 |e|), indicating that the Te-doped surface had the highest adsorption ability.
The charge transfer of Ga1 and Ga2 to the VO3 surface was changed the most because of the bond breaking. Compared with the pure surface, the charge transfer of Ga1 and Ga2 was reduced by 0.791 |e| and 0.242 |e|, respectively, leading to the least surface charge loss, with a value of 7.429|e|. When S, Se or Te was doped, the transferred charges of S, Se and Te of the defective surface were all smaller than that for O3 (0.797–1.213 |e|, 0.630–1.213 |e|, and 0.390–1.213 |e|, respectively), which manifested that the S, Se and Te atoms got fewer electrons than O. Therefore, the strengths of the Lewis bases for S, Se and Te are weaker than that for O and this will lower the bond strength for adsorbing the H atoms from the water molecules.
2. Water adsorption and decomposition on Ga2O3 (100) surfaces
For all the surfaces, the Bader charges of Ga atoms had negative values, indicating that these atoms all carried positive charges, which indicates that these sites would become strong Lewis acids and could absorb the H2O molecules through the Ow.56 On the contrary, surface oxygen atoms showing positive values, which carried negative charges, would be strong Lewis bases for adsorbing the H atoms of water molecules. Ga2 lost more electrons than Ga1, whereas O3 gained more electrons than O1, which can be seen in Table 1, with these trends also being consistent with the other results.20For the water molecule, the charge transfer of Ow, as shown in Table 2, was 1.142 |e| and for the H atom, it was −0.571 |e|. After the combination of two hydrogen atoms, which respectively lost one electron, the Ow formed two pairs of bonding electrons by combination with two single 2p orbits of the O atoms. The pairs of electrons in the 2s and 2p orbits of the Ow are called lone pair electrons, which can act as Lewis bases by their loss in a reaction. On the contrary, the two H atoms will act as Lewis acids due to the bonding electron pairs tending toward the O atom, forming empty orbits. Adsorption sites between the H2O molecule with the Ga2O3 (100) surfaces were considered with Lewis acids or bases of both the H2O molecules and the structures of the surfaces. Seven initial fundamental models are shown in Fig. 4. The water molecule acts as a Lewis base, and the Ow–Ga bond is the main driving force in water adsorption, as shown in Fig. 4(c)–(f). In addition, the molecule acts as a Lewis acid and the H–O bond plays an important role, as shown in Fig. 4(b) and (g). The Ow–Ga bond and H–O bond cooperate (Fig. 4(a)) because H2O can act as both a Lewis base and a Lewis acid.
| Eads. | Ga–Ow | Ow–H1 | Ow–H2 | ∠HOH | ∠W–S | eGa-ads. | eO-ads. | eOw | eH1 | eH2O/HOH | ||
|---|---|---|---|---|---|---|---|---|---|---|---|---|
| H2O molecule | 0.972 | 0.972 | 104.477 | 1.142 | −0.571 | |||||||
| Perfect | IS | −0.480 | 2.176 | 0.982 | 0.982 | 104.569 | 6.704 | −1.872 | 1.214 | 1.211 | −0.639 | −0.068 |
| TS | −0.266 | 1.939 | 1.331 | 0.976 | 108.927 | 32.948 | ||||||
| FS | −0.271 | 1.927 | 1.377 | 0.975 | 110.605 | 33.006 | −1.863 | 1.235 | 1.193 | −0.638 | −0.039 | |
| VO3 | IS | −0.459 | 2.184 | 0.981 | 0.981 | 104.691 | 11.244 | −1.877 | 1.225 | 1.231 | −0.645 | −0.059 |
| TS | −0.277 | 1.984 | 1.194 | 0.978 | 108.859 | 31.627 | ||||||
| FS | −0.332 | 1.919 | 1.414 | 0.976 | 110.018 | 32.085 | −1.850 | 1.271 | 1.203 | −0.636 | −0.038 | |
| S-doped | IS | −0.484 | 2.388 | 0.975 | 0.974 | 105.899 | 25.843 | −1.761 | 1.226 | 1.216 | −0.641 | −0.050 |
| TS | −0.251 | 2.211 | 1.088 | 0.974 | 108.055 | 51.126 | ||||||
| FS | −0.255 | 1.938 | 1.549 | 0.974 | 110.666 | 44.463 | −1.764 | 1.297 | 1.220 | −0.660 | −0.042 | |
| Se-doped | IS | −0.470 | 2.199 | 0.981 | 0.979 | 105.230 | 17.755 | −1.872 | 1.235 | 1.229 | −0.628 | −0.061 |
| TS | −0.268 | 2.188 | 1.017 | 0.977 | 113.546 | 24.535 | ||||||
| FS | −0.309 | 1.930 | 1.369 | 0.975 | 110.471 | 32.273 | −1.869 | 1.272 | 1.213 | −0.640 | −0.038 | |
| Te-doped | IS | −0.502 | 2.191 | 0.986 | 0.981 | 104.603 | 7.061 | −1.868 | 1.232 | 1.271 | −0.679 | −0.059 |
| TS | −0.285 | 2.003 | 1.117 | 0.979 | 108.410 | 57.325 | ||||||
| FS | −0.333 | 1.918 | 1.429 | 0.975 | 111.407 | 32.602 | −1.855 | 1.281 | 1.245 | −0.640 | −0.046 | |
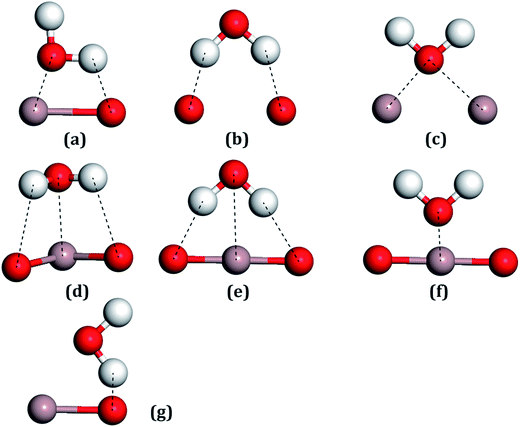 | ||
| Fig. 4 All the possible models of a water molecule adsorbed on the Ga2O3 (100) surfaces. (a) Ga–O bridge site, (b) O–O bridge site, (c) Ga–Ga bridge site, (d–f) Ga top sites, (g) O top site. | ||
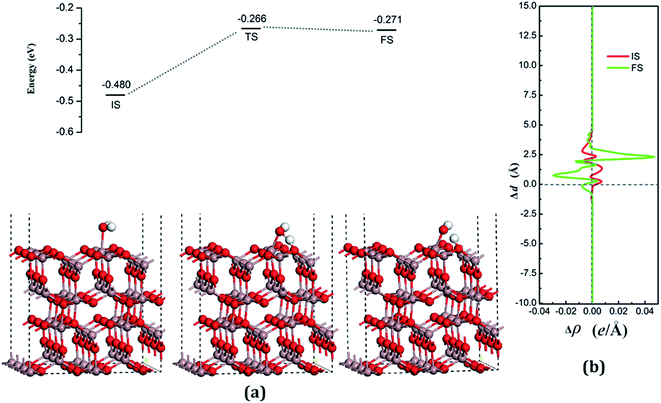
According to the Lewis acid–base theory, the OH radical will be adsorbed onto the top site of Ga atoms, becoming a surface-adsorbed hydroxyl radical, and another product H atom is absorbed onto the O atoms of the surface.46 According to the most stable adsorption structure of adsorption, the possible original structures for the decomposition states could be structured with the OH vertically put on top of Gaads., Ow next to Ga2 and the H atom from the water placed on top of O1 or O3 near the Ga2 atom. The decomposition structure after being fully relaxed is shown in Fig. 5(a) for FS, with an adsorption energy of −0.271 eV. The Ow atom lies on top of the Ga2 atom and the two H atoms move toward the O3. The angle between OH + H fragment and the surface is 33.006°. The detailed structural parameters of the water adsorption and decomposition on the intact surfaces are shown in Table 2.
The configuration of the transition state between these two states was also calculated, and is shown in Fig. 5(a) for TS. The structure of TS is similar to the dissociative state, i.e., it belongs to the “late barrier” and its adsorption energy is −0.266 eV. The decomposition pathway of water on the perfect surface is shown in Fig. 5. By the abovementioned results, the decomposition reaction on the perfect Ga2O3 (100) surface is shown to be an endothermic reaction with a reaction energy of 0.209 eV. Water molecules need an energy of 0.214 eV from the initial molecular state to accomplish the decomposition reaction, but the reverse reaction barrier is very small, with a value of 0.005 eV. These data demonstrate that the molecular adsorption state is the favorable state for water on the perfect Ga2O3 (100) surface. That is to say, the water is mainly in the form of a molecule and it is very difficult to dissociate it on the perfect surface.
The Ga atoms below the Ow atoms were defined as “Gaads.”, whereas the O atom on the surfaces connected to the decomposition products of H atoms were called “Oads.”. H1 is defined as the H atom which decomposes to form H2O because of its inequitable position.
The results of the charge transfers are summarized in Table 2. Charge transfers for free water molecules are also given in Table 2 as a reference. In both molecular adsorption and decomposition on the surface, the electrons transfer from the adsorption water to the surface, indicating that H2O acts as a Lewis base and provides electrons to the surface.
The average difference in charge density for water adsorption on the perfect Ga2O3 (100) surface along the z direction, as shown in Fig. 5(b), was calculated to further understand the charge redistribution in this process. For water molecule adsorption, the average charge density between the water and the surface is increased, indicating that a covalent bond is formed. However, the average charge density of the region between the water decomposition products is mainly negative and the electrons significantly concentrate in the position of the Ow atom, which indicates that there is an ionic bonding interaction between the surface and the main decomposition product of OH.
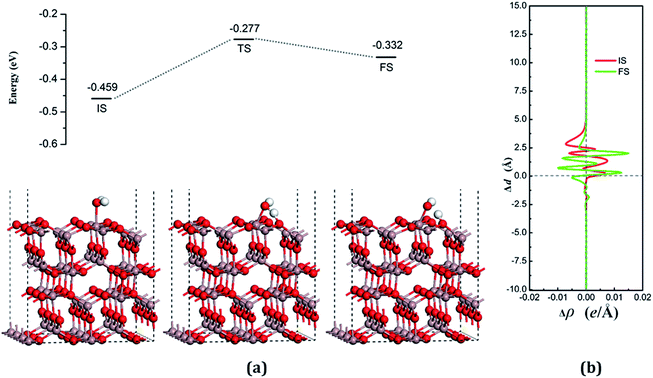
The dissociative adsorption state is shown in Fig. 6(a) for FS, in which one of the decomposition products of OH come to the bridge between Gaads. and Oads. with H moving toward Oads., and another product is an H atom adsorbed onto the O3 on the surface to form another surface-terminated OH radical. The adsorption energy of the dissociative state was −0.032 eV and the angle between the plane of the OH + H fragment and the surface was 32.085°.
The transition state, shown in Fig. 6 (TS), is similar to the decomposition state and belongs to the “later transition state”, with an adsorption energy of −0.277 eV. The reaction barrier for the water decomposition reaction was 0.182 eV, whereas its reverse reaction barrier was 0.055 eV. These results demonstrate that it is more reasonable for a water molecule to be adsorbed on the VO3 surface, but not in the dissociative state. The barrier for the reverse reaction in this pathway is higher than for water dissociation on the perfect surface.
In both the water molecule adsorption and decomposition on the VO3 surface, the electrons transfer from the adsorption water to the surface, as can be seen in Table 2, indicating that H2O acts as a Lewis base and provides electrons to the surface. Fig. 6(b) shows the average difference in electron density for water adsorption on the VO3 surface along the z direction. The molecular adsorption state is similar to water adsorption on the perfect surface, with an increase in the average charge density between the water and the surface, which demonstrates that a covalent bond was formed. The average charge density of the region between the water decomposition product OH and the surface, as shown in Fig. 6(b), has a negative value, but a small positive range (close to 1.25 Å), and the electrons are significantly concentrated around the position of the Ow and upon the surface, which indicates that the interactions between the surface and the main decomposition product of OH are ionic bonding, whereas covalent bonding only plays a very weak role.
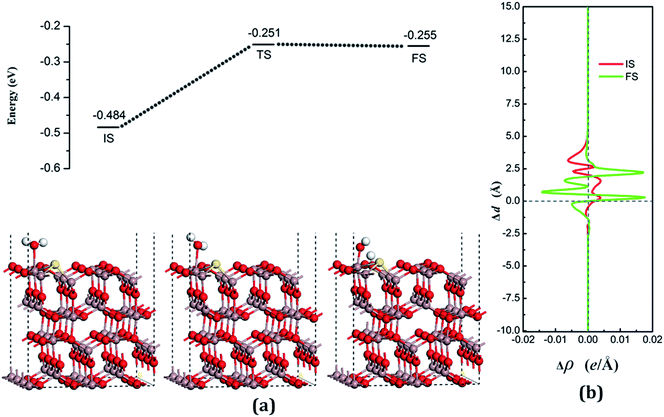
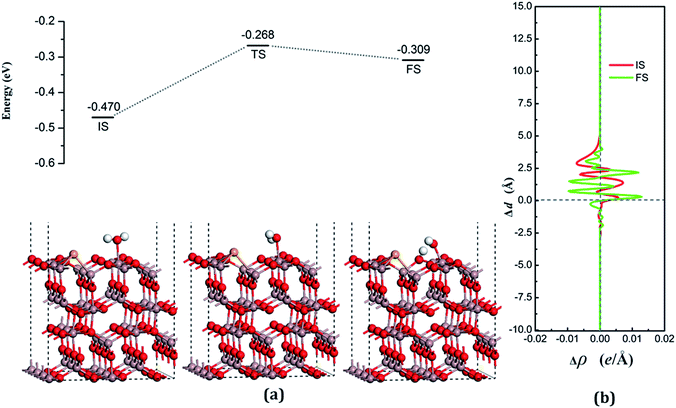
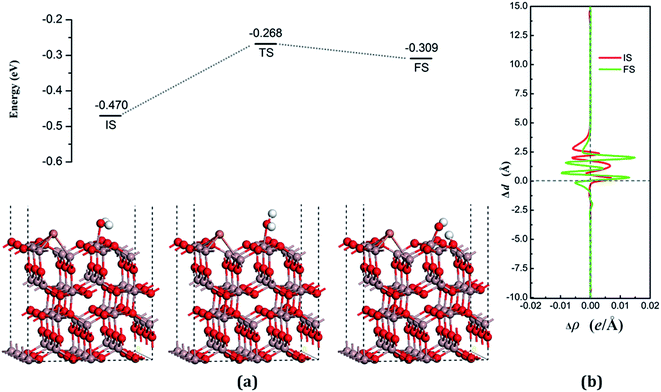
The decomposition configurations on the chalcogenide-doped surfaces are shown in Fig. 7(a) for FS, Fig. 8(a) for FS, and Fig. 9(a) for FS. For water composed on the S-doped surface, the H1 atom connects with O3 and another following, with Ow pointing to the defect site. When water is decomposed on the Se-doped surface, the H1 connects with O1 and another follows, with Ow moving toward another O1 site near Gaads., which connects with Ow. The Ow atom lies on top of the Ga2 atom and the two H atoms move toward the O3 in the case of Te doping. Other structural parameters of water decomposition on the chalcogenide-doped surfaces of Ga2O3 (100) are exhibited in Table 2.
Fig. 7(a) for TS, Fig. 8(a) for TS, and Fig. 9(a) for TS show the transition states, and also the reaction pathway. All the structures of the TS are similar to the dissociative states, which also belongs to the “late barrier”, and the adsorption energies for the S-, Se-, and Te-doped surfaces are −0.251 eV, −0.268 eV and −0.285 eV, respectively. In line with increasing the atomic number of the dopants, the reaction barriers for the water decomposition reaction respectively are 0.223 eV, 0.202 eV and 0.217 eV. However, the reverse reaction barriers are 0.004 eV, 0.041 eV, and 0.048 eV respectively, which are much smaller than the reaction barriers. Therefore, the water is also mainly in the form of a molecule and it is difficult for it to exist on the chalcogenide-doped surfaces.
The charge transfer for water molecule adsorption and decomposition (Table 2) has negative values, indicating that H2O acts as a Lewis base and provides electrons to the surfaces. The average difference in electron density for water adsorption on chalcogenide-doped Ga2O3 (100) surfaces along the z direction, respectively, can be seen in Fig. 7(b), 8(b) and 9(b). In the case of molecular adsorption, the electrons are mainly gathered between the surfaces and the position of the Ow atoms, indicating that the interactions between the surfaces and the water molecules are mainly covalent bonds. The interactions between the surface and the decomposition fragments are chiefly ionic bonding, with a few covalent bonds, because the average charge density between them has mainly negative values, as was shown before.
Conclusion
In order to clarify the interactions between water and photocatalytic surfaces, a comprehensive DFT study was implemented for water adsorption and decomposition on the β-Ga2O3 (100) surfaces with oxygen vacancy and by chalcogen doping. Based on the formation energy, it was easy to obtain the O vacancy and S-doped surfaces, but difficult for Se and Te doping due to their larger atomic radii. For surfaces with an oxygen vacancy and high-chalcogen doping, the bandgap reduces with respect to the perfect surface, denoting that the utilization ratio of the solar energy for water-splitting by this type of photocatalysts, if it could be used, would be significantly improved. H2O acted as a Lewis base for both adsorption and decomposition. In all cases, the transition states all belonged to the “later transition state”, whereas the adsorption energy of water molecule adsorption was lower than for the decomposition state. Therefore, the present states of water on the surfaces are more likely to favor water molecules. The reaction energies were in order VO3 < Se-doped < Te-doped < perfect surface < S-doped. The reverse reaction barriers decreased in the order VO3, Te-doped, Se-doped, perfect and S-doped. Consequently, it was more beneficial for water-splitting when the surface had a vacancy and with Se doping. The defects, both vacancy and chalcogenide-doped, had no evident effect on the reaction parameters. Furthermore, the surface with a robust non-defective-sensitive structure could be used as an anti-poisoning photocatalyst. Our study has important implications for understanding the decomposition of water on β-Ga2O3 (100) surfaces with an oxygen vacancy or chalcogenide doping. Furthermore, it can provide theoretical guidance to efficiently synthesize Ga2O3 photocatalysts.Acknowledgements
This study was financially supported by the National Natural Science Foundation of China (Grant no. 61674053, 11504092, U1404109 and 11504334) and by the High Performance Computing Center of Henan Normal University.References
- R. H. Crabtree, ChemInform, 2010, 26, 987–1007 CrossRef.
- M. Calatayud, S. E. Collins, M. A. Baltanás and A. L. Bonivardi, Phys. Chem. Chem. Phys., 2009, 11, 1397 RSC.
- S. U. M. Khan, M. Al-Shahry and W. B. Ingler, Science, 2003, 297, 2243–2245 CrossRef PubMed.
- J. Rossmeisl, Z. Qu, H. Zhu, G. J. Kroes and J. K. Nørskov, J. Electroanal. Chem., 2007, 607, 83–89 CrossRef CAS.
- R. D. Cortright, R. R. Davda and J. A. Dumesic, Nature, 2002, 418, 964–967 CrossRef CAS PubMed.
- A. L. Linsebigler, G. Lu and J. T. Yates, Chem. Rev., 1995, 95, 735–758 CrossRef CAS.
- Z. Zou, J. Ye, K. Sayama and H. Arakawa, Nature, 2002, 414, 625–627 CrossRef PubMed.
- K. Nakata and A. Fujishima, J. Photochem. Photobiol., C, 2012, 13, 169–189 CrossRef CAS.
- H. Kadowaki, et al., Chem. Lett., 2007, 36, 424–425 CrossRef CAS.
- Z. Lu, et al., Phys. Chem. Chem. Phys., 2014, 16, 12488–12494 RSC.
- J. Sato, N. Saito and H. Nishiyama, J. Photochem. Photobiol., A, 2002, 148, 85–89 CrossRef CAS.
- H. He, et al., Phys. Rev. B: Condens. Matter Mater. Phys., 2006, 74, 195123 CrossRef.
- H. Peelaers and C. G. Van de Walle, Phys. Status Solidi B, 2015, 252, 828–832 CrossRef CAS.
- J. B. Varley, et al., Appl. Phys. Lett., 2010, 97, 142106 CrossRef.
- T. Zacherle, et al., Phys. Rev. B: Condens. Matter Mater. Phys., 2013, 87, 235206 CrossRef.
- F. Zhang, et al., J. Cryst. Growth, 2014, 387, 96–100 CrossRef CAS.
- Y. Chen, et al., J. Mater. Sci.: Mater. Electron., 2015, 26, 3231–3235 CrossRef CAS.
- W. Seiler, et al., Thin Solid Films, 2010, 589, 556–562 CrossRef.
- S. Yoshioka, H. Hayashi, A. Kuwabara, F. Oba, K. Matsunaga and I. Tanaka, J. Phys.: Condens. Matter, 2007, 19, 1351–1356 CrossRef.
- V. M. Bermudez, Chem. Phys., 2006, 323, 193–203 CrossRef CAS.
- K. Yamaguchi, Solid State Commun., 2004, 131, 739–744 CrossRef CAS.
- A. B. Rahane, M. D. Deshpande and S. Chakraborty, J. Phys. Chem. A, 2012, 116, 10559–10565 CrossRef CAS PubMed.
- X. Wang, et al., Angew. Chem., Int. Ed., 2012, 51, 13089–13092 CrossRef CAS PubMed.
- T. Liu, et al., J. Mater. Chem. A, 2015, 3, 10309–10319 CAS.
- Y. Pan, C. Liu, D. Mei and Q. Ge, Langmuir, 2010, 26, 5551–5558 CrossRef CAS PubMed.
- D. Kohl, T. Ochs and W. Geyer, Sens. Actuators, B, 1999, 59, 140–145 CrossRef CAS.
- Y. Yang and P. Zhang, Phys. Lett. A, 2010, 374, 4169–4173 CrossRef CAS.
- Y. Pan, D. Mei, C. Liu and Q. Ge, J. Phys. Chem. C, 2011, 115, 10140–10146 CAS.
- E. A. Gonzalez, P. V. Jasen, A. Juan, S. E. Collins, M. A. Baltanás and A. L. Bonivardi, Surf. Sci., 2005, 575, 171–180 CrossRef CAS.
- M. M. Branda, E. C. Sebastián, J. C. Norberto, A. B. Miguel and L. B. Adrian, J. Phys. Chem. B, 2006, 110, 11847–11853 CrossRef CAS PubMed.
- W. Guo, et al., Phys. Chem. Chem. Phys., 2015, 17, 5817–5825 RSC.
- L. Liu, M. Li, D. Yu, J. Zhang, H. Zhang, C. Qian and Z. Yang, Appl. Phys. A, 2010, 98, 831 CrossRef CAS.
- J. L. F. Da Silva, A. Walsh and A. Wei, Phys. Rev. Lett., 2008, 100, 256401 CrossRef PubMed.
- K. Maeda and K. Domen, J. Phys. Chem. Lett., 2010, 1, 2655–2661 CrossRef CAS.
- Y. Wang, N. Li, P. Duan, X. Sun, B. Chu and Q. He, J. Nanomater., 2015, 2015, 191793 Search PubMed.
- L. S. Reddy, et al., Nanoscale Res. Lett., 2015, 10, 364 CrossRef PubMed.
- C. Li, et al., Energy Environ. Sci., 2015, 8, 1493–1500 CAS.
- H. Hidaka, Photochem. Photobiol. Sci., 2015, 14, 919–928 CAS.
- X. Chai, et al., Sci. China: Chem., 2015, 58, 532–538 CrossRef CAS.
- K. Maeda, et al., J. Phys. Chem. B, 2005, 109, 20504–20510 CrossRef CAS PubMed.
- X. Zhou, E. J. M. Hensen, R. A. van Santen and C. Li, Chem.–Eur. J., 2014, 20, 6915 CrossRef CAS PubMed.
- X. Zhou, H. Dong and A. M. Ren, Int. J. Hydrogen Energy, 2016, 41, 5670 CrossRef CAS.
- X. Zhou, H. Dong and A. M. Ren, Phys. Chem. Chem. Phys., 2016, 18, 11111 RSC.
- G. Kresse and J. Furthmüller, Comput. Mater. Sci., 1996, 6, 15–50 CrossRef CAS.
- P. E. Blöchl, Phys. Rev. B: Condens. Matter Mater. Phys., 1994, 50, 17953–17979 CrossRef.
- G. Kresse and D. Joubert, Phys. Rev. B: Condens. Matter Mater. Phys., 1999, 59, 1758–1775 CrossRef CAS.
- J. P. Perdew, K. Burke and M. Ernzerhof, Phys. Rev. Lett., 1996, 77, 3865–3868 CrossRef CAS PubMed.
- H. J. Monkhorst and J. D. Pack, Phys. Rev. B: Solid State, 1976, 13, 5188–5192 CrossRef.
- G. Henkelman, B. P. Uberuaga and H. A. Jónsson, J. Chem. Phys., 2000, 113, 9901–9904 CrossRef CAS.
- G. Henkelman and H. Jónsson, J. Chem. Phys., 2000, 113, 9978–9985 CrossRef CAS.
- D. Sheppard, P. Xiao, W. Chemelewski, D. Johnson and G. Henkelman, J. Chem. Phys., 2016, 136, 074103 CrossRef PubMed.
- A. Bermudez, F. Jelezko, M. B. Plenio and A. Retzker, Phys. Rev. Lett., 2011, 107, 3745 Search PubMed.
- M. Yu and D. R. Trinkle, J. Chem. Phys., 2010, 134, 498–503 Search PubMed.
- W. Tang, E. Sanville and G. Henkelman, J. Phys.: Condens. Matter, 2009, 21, 84204–84210 CrossRef CAS PubMed.
- E. Sanville, S. D. Kenny, R. Smith and G. Henkelman, J. Comput. Chem., 2007, 28, 899–908 CrossRef CAS PubMed.
- J. Chen, et al., Langmuir, 2013, 29, 7025–7037 CrossRef PubMed.
Footnote |
| † Electronic supplementary information (ESI) available. See DOI: 10.1039/c6ra24798a |
| This journal is © The Royal Society of Chemistry 2017 |


