 Open Access Article
Creative Commons Attribution 3.0 Unported Licence
High pressure studies of Eu2+ and Mn2+ doped NaScSi2O6 clinopyroxenes†
J. Barzowskaa,
Zhiguo Xiab,
D. Jankowskic,
D. Włodarczyk c,
K. Szczodrowskia,
Chong-Geng Mad,
M. G. Brikdef,
Ya. Zhydachevskiic and
A. Suchocki*cdg
aInstitute of Experimental Physics, Gdańsk University, ul. Wita Stwosza 57, 80-952 Gdańsk, Poland
bThe Beijing Municipal Key Laboratory of New Energy Materials and Technologies, School of Materials Sciences and Engineering, University of Science and Technology Beijing, Beijing 100083, China
cInstitute of Physics, Polish Academy of Sciences, Al. Lotników 32/46, 02-668 Warsaw, Poland. E-mail: suchy@ifpan.edu.pl
dCollege of Mathematics and Physics, Chongqing University of Posts and Telecommunications, Chongqing 400065, PR China
eInstitute of Physics, University of Tartu, W. Ostwald Str. 1, Tartu 50411, Estonia
fInstitute of Physics, Jan Dlugosz University, Al. Armii Krajowej 13/15, Czestochowa PL-42200, Poland
gInstitute of Physics, Kazimierz Wielki University, Weyssenhoffa 11, 85-072 Bydgoszcz, Poland
First published on 3rd January 2017
Abstract
High pressure luminescence studies of NaScSi2O6 clinopyroxene (jervisite) doped with Eu2+ and Mn2+ are reported. The efficiency of the energy transfer between Eu2+ and Mn2+ is examined. It is shown that the efficiency of the energy transfer process is weakly dependent on pressure, although a small increase of the probability of nonradiative energy transfer with increase of pressure is observed. In contrast to that the energy transfer efficiency at ambient pressure is independent of temperature between 10 K and 400 K. The Raman spectra under pressure shows fingerprints of the reversible phase transitions at pressures of about 100–120 kbar at room temperature. The occurrence of the phase transition drastically reduces the efficiency of energy transfer, which is restored at higher pressures. The Mn2+ luminescence is quenched at about 200 kbar due to the crossing between the 4T1g and 2T2g excited states occurring at this pressure. The 2T2g state becomes the first excited level at this pressure and due to much stronger coupling with the host the Mn2+ luminescence is quenched. This is the first observation of such behaviour for Mn2+ ions. Pressure dependence of CIE color coordinates is established for this phosphor.
I. Introduction
Recent development of white-light emitting diodes (WLED) and attempts to obtain the most efficient phosphors for diodes with controlled color-rendering index and high correlated color temperature have triggered a great number of studies of various materials, sometimes quite exotic, although existing in nature, or intentionally designed for these purposes. One such material is Na–clinopyroxene with general chemical formula NaMe3+Si2O6. This material has a monoclinic crystallographic structure with space group C2/c at ambient pressure.1 Clinopyroxenes (monoclinic pyroxenes) are components of various minerals, as for example: augite, diopside, pigeonite, hedenbergite, aegirine, jadeite (Na(Al,Fe3+)Si2O6) and omphacite. They are most common in basic and ultrabasic igneous rocks such as basalt, gabbro, peridotite and pyroxenite. Fe-rich clinopyroxenes can occur within granites, diorites and syenites. Alkali-rich clinopyroxenes are particularly abundant in alkaline igneous rocks such as phonolites, basanites, nephelinites etc.2,3 and they are important components of upper Earth mantle,4,5 at least partially determining its seismic properties. Recent studies of NaScSi2O6:Eu2+ and Mn2+ clinopyroxene (this type of clinopyroxene is called jervisite)6 and similar compounds showed that they might be useful as phosphors for WLED, being stable over a wide range of pressures and temperatures, exhibiting useful emission properties with possibility of tuning photoluminescence by using solid solutions between various compounds in clinopyroxene family.6,7Me3+ ions are located in octahedral coordination in clinopyroxene host. It has been established with use of XRD data that Eu2+ ions substitute Na ions in distorted cubic antiprism polyhedrons and Mn2+ are in octahedral coordination replacing Sc ions.1 The site occupancy is related to ionic radii of dopant and host ions, which actually is the most important factor establishing preference in choosing the sites for dopant location.
Previous photoluminescence studies showed that samples of NaScSi2O6 doped only with Eu2+ exhibit typical green emission. By codoping with Mn2+ due to the energy transfer from Eu2+ ions to Mn2+ the color of emission can be changed from green to yellow due to existence of additional luminescence band with maximum at about 660 nm. This bad is associated with typical Mn2+ luminescence due to the 4T1 → 6A1 intraconfigurational transitions within electronic states of the Mn2+ ions. The emission color on the CIE chromaticity diagram depends on the concentration of Mn2+ codopant.1
In order to check further possibility of controlling the luminescence color in these types of compounds we decided to study the effect of hydrostatic pressure on the luminescence properties of clinopyroxenes doped with both Eu2+ and Mn2+ ions. Application of high pressures can effectively change the inter-atomic distances in the solid state materials (depending on pressure and bulk modulus of the material studied – even up to a few tens of %). Therefore the strength of the crystal field experienced by central ions can be effectively changed. If the position of the luminescence is strongly dependent on strength of the crystal field, which is the case of the Eu2+ 5d → 4f transitions8,9 or intraconfigurational Mn2+ optical transitions,10 the color of the emission can be considerably changed by pressure application. This allows for establishing conditions for “chemical pressure” use, i.e. by changing the interatomic distances due to the change of the lattice parameters as the result of preparation of solid solutions with various materials having different lattice parameters associated with different ionic radii of host ions. In this way high pressure application, which can be done in precise and controlled way, allows to check and establish conditions for obtaining the desired luminescence properties of the material for practical applications. Important parts of these effects are details of the energy transfer processes and influence of pressure on the observed phenomena. These are the aims of the present publication.
II. Samples and experimental methods
Samples used for the study were prepared by the sol–gel method and had powdered form. The details of preparation procedure can be found in ref. 1. Three types of samples were studied in details: singly doped NaScSi2O6:Eu(5%), NaScSi2O6:Mn(5%), and doubly doped NaScSi2O6:Eu(5%),Mn(15%). The sample with 15% of Mn2+ was chosen due to the importance of effect of the energy transfer between the Eu2+ and Mn2+ ions and associated with this efficient Mn2+ emission, but with small, on the other hand, effect of concentration quenching, observed for samples with higher concentration of dopants.1The quality and phase purity of the chosen samples were examined with X-ray diffraction method (XRD) using BRUKER D2PHASER equipment employing Cu Kα radiation and operated at 30 kV and 10 mA. The XRD patterns were collected using scanning step of 0.02° and counting time of 1 s per step. The phase analysis was carried out using DIFFRAC.EVA V4.1 evaluating application from BRUKER.
The results of XRD analysis are in agreement with results previously presented in ref. 1. The samples besides desired phase of NaScSi2O6 contain also small amount of additional phases. It may be due to the high level of doping with Eu2+ and Mn2+. It seems that there is a small amount of hydrated silicas, as well as scandium pyrosilicate (Sc2Si2O7), scandium oxide and in the doubly doped (with Eu2+ and Mn2+) sample – also Eu2O3. There are no impurity phases containing manganese. The amount of various additional phases is difficult to be estimated, although qualitative analysis shows that the phase of clinopyroxene NaScSi2O6 is strongly dominating. The examples of diffractograms with detailed phase analysis are shown in ESI.†
Excitation spectra at ambient pressure were acquired using Fluorolog 3 (Horiba) spectrofluorimeter. Photoluminescence spectra were measured using Shamrock SR750 D1 grating spectrometer equipped with iDus 420 CCD detector (Andor Technology). The IK5352R-D He–Cd continuous wave laser (Kimmon Koha) was used as an excitation source. For high pressure experiments the samples were placed in a Merrill-Bassett type diamond anvil cell (DAC). Polydimethylsiloxane oil was used as a pressure-transmitting medium, and ruby as pressure gauge.
The experimental setup for luminescence kinetics and time resolved emission spectra consisted of a YAG:Nd laser of PL2143A/SS type and a parametric optical generator PG401/SH. The laser generated 30 ps pulses at 355 nm wavelength with repetition frequency of 10 Hz. The laser pumped PG generator could produce light pulses at wavelengths ranging from 220 nm to 2200 nm. The emission signal was analyzed with the 2501S (BrukerOptics) spectrometer and a Hamamatsu Streak Camera model C4334-01. Luminescence decays were collected by the integration of streak camera images over the wavelength intervals.
For temperature dependent measurements the sample was placed in closed-cycle helium cryostat. The system consisted of water cooled helium compressor model ARS-4HW and expander model DE-204SI (Advanced Research System, Inc.) and LakeShore temperature controller Model 336.
The high-pressure Raman spectra at room temperature were taken using MonoVista CRS+ Raman system equipped with 532 nm laser. Powdered samples were placed in the Diacell CryoDAC-LT of Almax easyLab. Argon was used as a pressure transmitting medium and ruby as a pressure gauge.
III. Experimental results
III.1. Ambient pressure studies
The NaScSi2O6 doped with Eu(5%) and doubly doped with Eu(5%) and Mn(15%) exhibit strong luminescence in the green spectral region related to the Eu2+ 5d → 4f transitions (with a peak at 550 nm) and Mn2+ 4T1g → 6A1g transitions (with a maximum around 660 nm), if excited in the UV region. Weaker luminescence is observed from only Mn2+-doped sample, due to the forbidden character of the absorption within the 3d shell of the Mn2+ ions. Normalized luminescence spectra of NaScSi2O6:Eu(5%) and NaScSi2O6:Eu(5%),Mn(15%) taken at room temperature, are presented in Fig. 1.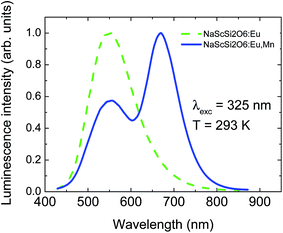 | ||
| Fig. 1 Normalized luminescence spectra of NaScSi2O6:Eu(5%) and NaScSi2O6:Eu(5%),Mn(15%) samples at room temperature under 325 nm excitation. | ||
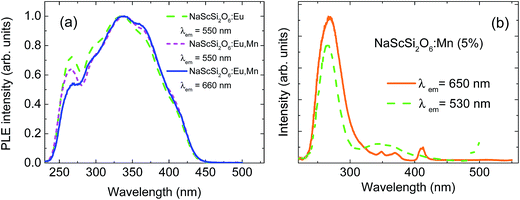
The peak of the Mn2+ band is located in the red region, which means that the Mn2+ ions experience quite strong crystal field. Normalized excitation spectra of both samples, monitored at the peaks of their luminescence bands, are presented in Fig. 2a.
The excitation spectra exhibit very good concurrence and they are in agreement with excitation of both dopants through the Eu2+ ions. Mn2+ ions are mainly excited by the efficient energy transfer from Eu2+ ions due to the Forster–Dexter energy transfer mechanism, which will be discussed later. No excitation bands associated with the transitions from the ground 6A1g state to the 4T1g and 4T2g states are visible in the excitation spectra of Mn2+ ions, in agreement with spin-forbidden character of these transitions. Fig. 2a shows unambiguously that the nonradiative energy transfer mechanism is the most efficient way of excitation of Mn2+ ions in this system. Only some traces of the 4A1g + 4Eg band are visible in the Mn2+ excitation spectra around 415 nm. This band is usually one of the strongest in the absorption and PLE spectra of Mn2+ ions.
Much weaker Mn2+ luminescence is observed in the sample doped only with Mn2+. Its excitation spectra monitored at 530 nm and 650 nm are presented in Fig. 2b. Some traces of the Eu2+ dopant can be found in this sample, which gives a very weak green luminescence with a peak at about 530 nm. The bands associated with transitions to the 4T1g and 4T2g states are not detected in the excitation spectrum of Mn2+ ions recorded at 650 nm, however some weak bands related to transitions to the 4Eg + 4A1g states can be observed at the wavelength around 415 nm, as well as some higher energy states of Mn2+ at shorter wavelengths. The strong excitation band, with a maximum at about 270 nm is the most likely related to band-gap excitation mechanism of both Mn2+ and Eu2+ dopants in this compound. It is also visible in the excitation spectra of two other samples, presented in Fig. 2, however on the high-energy side of the very strong band associated with the 4f → 5d excitation of Eu2+. Decrease of the excitation efficiency observed at higher energy side of this band is related to the smaller penetration depth of the excitation light due to the very strong band-to-band absorption of the host. The spectral position of this band implies that the band-gap of jervisite is larger than previously estimated1 and it is equal to about 4.0 eV (310 nm).
The temperature dependence of the luminescence spectra of the NaScSi2O6:Eu(5%),Mn(15%) sample are shown in Fig. 3.
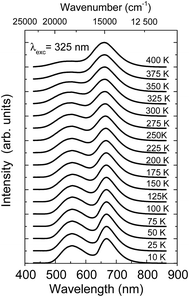 | ||
| Fig. 3 Temperature dependence luminescence spectra of NaScSi2O6:Eu(5%),Mn(15%) sample, excited by the 325 nm laser line. The spectra were normalized to the peak of Mn2+ luminescence band. | ||
The temperature dependent decay kinetics of Eu2+ and Mn2+ for NaScSi2O6:Eu(5%),Mn(15%) sample are shown in Fig. 4a and b, respectively.
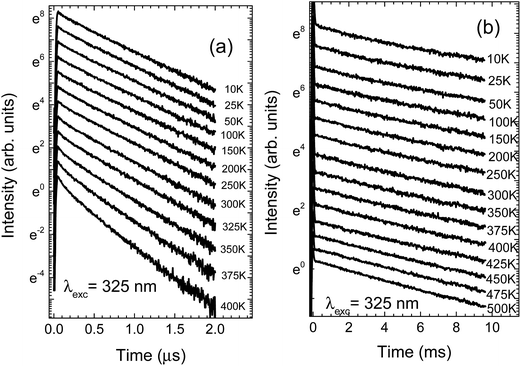 | ||
| Fig. 4 Temperature dependence of the luminescence decay kinetics of NaScSi2O6:Eu(5%),Mn(15%) sample, excited by the 325 laser line: (a) decays of Eu2+ luminescence; (b) decays of Mn2+ luminescence. | ||
The spectra and decay kinetics presented on the last graphs show that this sample does not exhibit temperature quenching of Mn2+ luminescence up to at least 500 K. Some temperature quenching is observed for Eu2+ especially above 350 K.
The decay times of Eu2+ are in the sub-microsecond range. Decay kinetics are nonexponential, due to the energy transfer processes between the Eu2+ and Mn2+ ions. The Mn2+ decay times are in the ms range, typical for forbidden type of these optical transitions.
The decay kinetics of Eu2+ in the sample not doped with Mn2+ exhibit much less non-exponential behavior than observed in doubly doped sample. This is another sign of the excitation energy transfer from Eu2+ to Mn2+ ions. The comparison of the europium ions decay kinetics in samples doped only with Eu2+ and doubly doped with Eu2+ and Mn2+ is presented in Fig. 5.
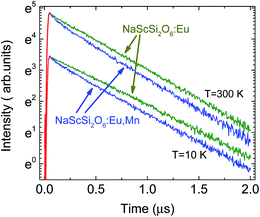 | ||
| Fig. 5 Comparison of the decay kinetics of Eu2+ NaScSi2O6 in samples doped only with Eu(5%) and doubly doped with Eu (5%) and Mn(15%), excited by the 325 laser line, at 10 K and 300 K. | ||
III.2. High pressure studies
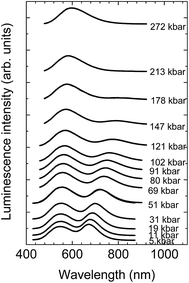
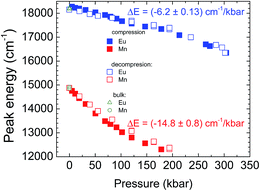
The luminescence spectra of the NaScSi2O6:Eu(5%),Mn(15%) sample as a function of pressure at room temperature are presented in Fig. 6.The spectra exhibit shifts of the luminescence peaks towards longer wavelengths, which is approximately linear with pressure in the energy scale. The pressure coefficients for Eu2+ are equal to −6.2 ± 0.13 cm−1/kbar and for Mn2+ −14.8 ± 0.8 cm−1/kbar, respectively. The shifts reflect the increase of splitting of the 5d level for Eu2+ and the decrease of the energy of the first excited level (4T2g) for Mn2+ (see appropriate Tanabe–Sugano diagram for d5 configuration), together with the appropriate Stokes shifts. The positions of the peaks of luminescence of the Eu2+ and Mn2+ ions as functions of pressure are shown in Fig. 7.
The energy positions of the luminescence peaks during compression and decompression overlap with each other not showing appreciable hysteresis. Eu2+ luminescence does not exhibit quenching with pressure in contrast to the luminescence of Mn2+, which intensity decreases with increased pressure in comparison with luminescence of Eu2+ and it is completely quenched at pressures above 200 kbar. The origin of that quenching will be discussed later.
The examples of the pressure dependence of the decay kinetics of sample doped only with Eu2+ and doubly doped with Eu2+ and Mn2+ are shown in Fig. 8a and b, respectively.
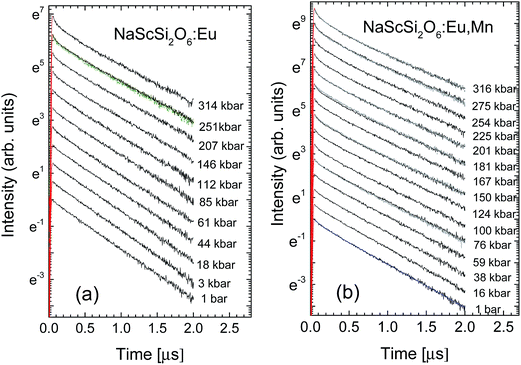 | ||
| Fig. 8 Pressure dependence of the decay kinetics of Eu2+ luminescence at room temperature for: (a) NaScSi2O6:Eu(5%); (b) NaScSi2O6:Eu(5%),Mn(15%) samples. | ||
The decay kinetics of the sample doped only with Eu2+ are almost single-exponential at low pressures, the nonexponential behavior appears in this sample at high pressures above 100 kbar. In contrast to these results nonexponential decays are observed even at low pressures for sample doubly doped with Eu2+ and Mn2+. The decays are faster for this material. For both samples tails of decays (longer components of decays) became exponential. Pressure dependencies of decay times of long components of decays are presented in Fig. 9.
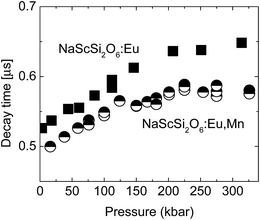 | ||
| Fig. 9 Pressure dependencies of decay times of longer components of decays for NaScSi2O6 doped only with Eu(5%) (squares) and doubly doped with Eu(5%) and Mn(15%) (circles). | ||
Eu2+ decay times of the sample doubly doped are shorter than those for the sample doped only with Eu2+, which is another fingerprint of energy transfer processes occurring in this material. The decay times rise with increasing pressure until the pressure reaches about 200 kbar, and at higher pressures there is no appreciable, consequent increase of decay times.
Decay kinetics of the Mn2+ ions present quite different properties. Although with increasing pressure their values also slightly increase, at pressures above 140 kbar a very strong decrease of the decay time is observed, accompanied also by nonexponential decays. The decrease of intensity causes decrease of signal to noise ratio, observed for higher pressures on the decay kinetics. The pressure dependence of the Mn2+ decay kinetics is presented in Fig. 10.
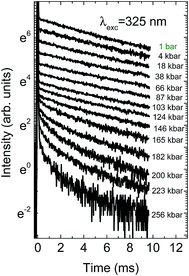 | ||
| Fig. 10 Pressure dependence of the decay kinetics of Mn2+ for NaScSi2O6:Eu(5%),Mn(15%) sample at room temperature. | ||
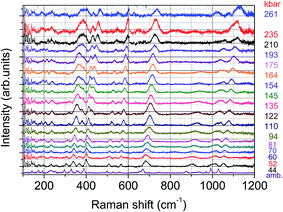
Although clinopyroxenes are supposed to be stable with pressure 1, the pressure dependence of the Raman spectra was measured in order to check the crystallographic stability of the measured samples. An example of these results is presented below (Fig. 11).
Similar spectra and pressure relations exhibit both samples doped with Eu2+ only and Eu2+/Mn2+. Despite the high level of doping the spectra show the same peaks at ambient pressure, however with different intensities. The low energy lines observed in the spectra below 150 cm−1 are related to argon, which serves as a pressure transmitting medium. Positions of the lines observed in the spectra shift towards higher energies with increasing pressure, however with slightly different pressure coefficients. The lines broaden at higher pressures, which is the most likely associated with certain nonhydrostaticity typical for diamond anvil cells at pressures exceeding 100 kbar. Perhaps the most striking feature observed in the presented spectra is the splitting of the line around 400 cm−1 (and above at higher pressures), observed for pressures above 100 kbar. Also some lines change their relative intensities or even disappear at certain pressures. Changes are reversible, i.e. after pressure release spectra the same as those before the compression. The more detailed analysis of the Raman spectra will be presented in a separate publication.
IV. Discussion of results
IV.1. Results of high pressure Raman measurements
Similarity of the Raman spectra for the samples doped only with Eu2+ and doubly doped with Eu2+ and Mn2+ is another proof that both types of samples crystallize in the same crystallographic structure. On the other hand it is known that some clinopyroxenes change their structure upon changing content of some constituent ions.11 The influence of temperature and high pressure on the crystallographic stability of clinopyroxenes was studied in several publications.12 Although some of them turned out to be stable under influence of these factors, the other showed apparent phase transitions from the C2/c structure to P21/c one, and even at higher pressures to the high pressure C2/c.13–17 For these clinopyroxenes P21/c is an intermediate phase between both C2/c structures. Some other clinopyroxenes crystallize in the P21/c structure at ambient conditions and at higher pressures transform into C2/c phase.12 One of phase transitions fingerprints is a splitting of some Raman lines. Such a splitting has been observed for example in LiAlSi2O6 (spodumene) and LiScSi2O6.18,19 The both structures are similar and show similar elastic properties, i.e. the bulk moduli are not very much different. The phase transition between C2/c and P21/c phases is associated with certain reorientation of the structure forming polyhedra and affects the most so called M2 site, i.e. the site occupied by Na ions, which may be substituted by Eu2+ in case of doping. Therefore both structures do not differ significantly and their changes are reversible upon pressure release.20 The splitting of the line around 400 cm−1 observed at pressure of 122 kbar and above can be also associated with the change of crystallographic structure, most probably similar to those observed in the other clinopyroxenes, i.e. from C2/c structure to P21/c. There is no splitting of the other Raman lines, as it was seen in ref. 18, which is the most probable effect of inhomogeneous broadening associated with high doping level of the examined sample and non-hydrostaticity of the pressure-transmitting medium. The change is reversible, i.e. after releasing the pressure the sample exhibit the same spectra like before compression, which testifies that most likely it is a displacive type of the phase transition, similar to observed in the other clinopyroxenes.Bulk moduli for several clinopyroxenes were measured, however the experimental value for NaScSi2O6 is not known.20 Only theoretically predicted value has been given in ref. 20, equal to 109.4 GPa. Also values of pressure derivatives of bulk moduli B′0 for clinopyroxenes are very often spurious (sometimes even negative).20 Lack of good knowledge on the nature of phase transitions and poor data quality are often blamed for these discrepancies. Therefore a typical value of B′0 = 4 has been used in further calculations.
IV.2. Pressure dependence of the energy transfer
It has been established in ref. 1 that the dipole–dipole energy mechanism is responsible for the energy transfer between Eu2+ and Mn2+ ions. The probability PddET of such transfer is then described by the formula:21
 | (1) |
 | (2) |
Since the decay kinetics of the sample doped only with Eu2+ exhibit certain nonexponentiality, especially at higher pressure, we propose to treat that nonexponential part as radiative decay. This way the expression given below should yield the value:
 | (3) |
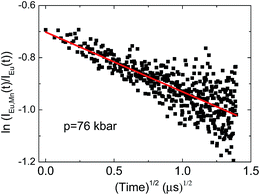 | ||
| Fig. 12 The correlation plot for NaScSi2O6:Eu(5%),Mn(5%) sample. The straight line is a fit of eqn (3) to the data. | ||
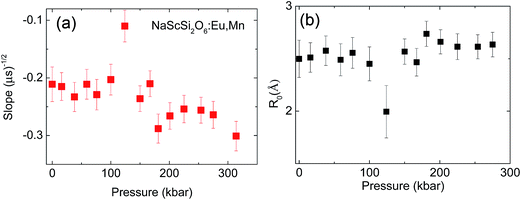
Relatively large spread of the data is associated with the important noise of decay kinetics. Its elimination would require considerably longer measurement time. However possibility of fitting the data with the straight line as shown on correlation plots of the type shown in Fig. 12 confirm that the dipole–dipole mechanism of energy transfer is dominating in our material. The pressure dependence of the slopes, S, established from the eqn (3) is shown on Fig. 13a.
We assume now that the parameters of the slope, S, are pressure-dependent, i.e.:
 | (4) |
 | (5) |
Assuming that the concentration of energy acceptors (Mn2+ ions) is equal to nominal concentration of Cn = 0.15 in Sc sites, and the volume of the elementary cell is equal to Vel (0 kbar) = 456 Å3 from ref. 1, it is possible to calculate absolute values of the critical distances Rdd0 as function of pressure and also temperature from the following formula:
 | (6) |
Substituting Murnaghan eqn (5) as a value of Vel(p) and using B0 = 109.4 GPa and B′0 = 4 from ref. 20 the changes of critical distance for dipole–dipole mechanism of energy transfer can be calculated as a function of pressure, which is presented in Fig. 13b.
The value of the (Rdd0(p))6 is proportional to the overlap integral between the emission spectrum of the energy donor and absorption spectrum of the energy acceptor (Eu2+ and Mn2+, respectively, for our case) through the formula:21
 | (7) |
The observed changes are very small, except a strong decrease of the energy transfer efficiency present around pressure at which the phase transition occurs. At higher pressure the efficiency of the energy transfer is restored, and even a small relative increase of this parameter can be detected from Fig. 13b. Large error bars, associated with relatively small accuracy of streak camera and use of DAC does not allow establishing mechanism responsible for this change. Most probably, the overlap integral eqn (7) is changed by pressure application. Nevertheless the increase of the probability of the energy transfer with pressure is not very significant in this material.
Origin of energy transfer suppress at pressure at which the phase transition occurs is not known yet. It might be related to phase-transition induced lattice disorder and reorientations of molecules constituting the crystallographic structure.25 Perhaps overall quenching of the luminescence occurring around this pressure may be caused by the defect formation during phase transition, which contributes to the decrease of the luminescence efficiency. The increased non-exponentiality of the decay kinetics of the sample singly doped with europium, which occurs around 100–120 kbar is the most probably associated with increasing energy transfer to the defects induced by the phase transition. The exact mechanism of the energy transfer suppress at the phase transition region would require additional studies, which is beyond the scope of this paper.
In contrast to observed small changes of the energy transfer probability with pressure, a slight decrease of the critical distance R0 is detected. The dependence of the critical distance for dipole–dipole energy transfer, Rdd0(T), on temperature at ambient pressure is shown in Fig. 14.
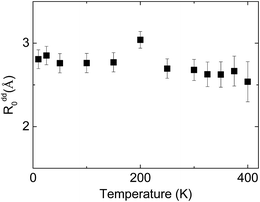 | ||
| Fig. 14 Temperature dependence of the critical radius of the energy transfer between Eu2+ and Mn2+ in NaScSi2O6:Eu(5%),Mn(15%) jervisite at ambient pressure. | ||
Observed changes of R0 with temperature are also small, as well as changing pressure. The obtained values of R0 seems to be reasonable, taking into account the smallest possible distance between Eu2+ and Mn2+ ions in clinopyroxene structure, equal to about 3.22 Å at ambient pressure. Relatively larger distance between interacting ions than the critical radius Rdd0 prefers longer-distance dipole–dipole interaction in contrast to more effective on shorter distances higher order multipole or exchange interactions. The results will be dependent on total amount of Mn2+ ions present in the sample. Our assumption that the total concentration of Mn2+ is equal to nominal concentration of substrates seems to be reasonable, since changes in the Mn2+ excitation efficiency are at least proportional to the Mn substrate content.1 However according to eqn (6), exact results on Rdd0 is proportional to C−1/3, which may change slightly the results if the concentration of Mn2+ is different than those calculated from the amount of substrates used for synthesizing these materials.
IV.3. Pressure-induced quenching of luminescence of Mn2+ in NaScSi2O6:Eu(5%),Mn(15%)
The NaScSi2O6:Eu(5%),Mn(15%) sample exhibits the Mn2+ luminescence with a peak at about 660 nm at ambient pressure, i.e. in the red part of the spectrum. This luminescence is associated with the 4T1g → 6A1g intraconfigurational transitions within 3d5 shell of Mn2+ ions. Application of high pressures shifts that luminescence band towards infrared with a rate of about 15 cm−1/kbar. The decay kinetics of this luminescence are close to single exponential up to about 150 kbar. Above that pressure the quenching of the luminescence occurs, with apparent participation of nonradiative transitions, which is confirmed by the strongly nonexponential luminescence decay kinetics. The weak luminescence form Mn2+ ions is still visible at pressure of about 180 kbar with a peak at about 810 nm. This is the longest wavelength associated with Mn2+ luminescence, ever observed, according to our knowledge. The longest wavelength of Mn2+ emission ever found before in the other compound is at 725 nm at room temperature.26 We associated the Mn2+ luminescence quenching with the crossing between the 4T1g and 2T2g excited states, which occurs at the pressure of about 200 kbar in this compound. The 2T2g state becomes the first excited state at this pressure. Since it is much stronger coupled to the lattice than the 4T2g state (see the Tanabe–Sugano diagram for the 3d5 system, Fig. 15), the excitation energy is nonradiatively transferred to the lattice.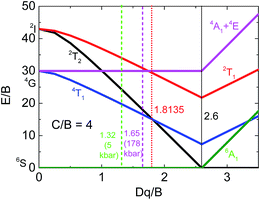 | ||
| Fig. 15 Partial Tanabe–Sugano diagram for the d5 configuration in an octahedral crystal field for C/B = 4.30 Vertical lines mark values of Dd/B for: ambient (green) and 178 kbar (magenta) pressures, crossing point between the 4T1g and 2T2g levels (red), and crossing point between high- and low-spin configurations (solid black). | ||
Partial Tanabe–Sugano diagram, presenting appropriate energy levels of Mn2+ (d5) ions is shown on Fig. 14 for the ratio of C/B Racah parameters equal to 4, which is adequate for our system. Previous studies show that the ratio of C/B can be equal between 3.6 up to almost 6.27–29 The value of Racah parameter B can be estimated from the position of the 4Eg + 4A1g levels, which energy is equal to 10B + 5C. Estimated value of B (for C/B = 4) is equal to about 830 cm−1. Although in the system with large Stokes shift it is impossible to see the position of no-phonon lines even the low temperatures, we use approximated values of the energy of pure 4T1 electronic level as the energy at which the luminescence signal is close to the luminescence background at the high energy side of Mn2+ emission band. Then the respective positions of the energy levels, (in E/B units), as a function of pressure for 5 kbar and 178 kbar (the highest pressure in which the luminescence of Mn2+ is visible) can be calculated. Respective values of crystal field parameter, Dq/B, are established from Tanabe–Sugano diagram. These data are presented in Table 1.
| Pressure (kbar) | Estimated energy of 0-ph line (cm−1) | Energy position of 4T1 level in B units (B = 830 cm−1) | Crystal field parameter Dq in B units |
|---|---|---|---|
| 5 | 16![[thin space (1/6-em)]](https://www.rsc.org/images/entities/char_2009.gif) 340 340 |
19.69 | 1.32 |
| 178 | 13![[thin space (1/6-em)]](https://www.rsc.org/images/entities/char_2009.gif) 643 643 |
16.44 | 1.65 |
The appropriate positions of electronic levels for 5 kbar and 178 kbar are marked at Tanabe–Sugano diagram (Fig. 15). The value of Dq/B obtained for pressure of 178 kbar is very close to the crossing point between the 4T1g and 2T2g levels, which occurs for Dq/B = 1.8135 (for used C/B = 4).
The value of Dq parameter should be approximately dependent on the distance, r, between the central ions and ligands as Dq ∼ r−5. Therefore the ratio (Dq (5 kbar)/D (178 kbar))1/5 equal to 0.956 can be compared with appropriate ratio of the distances obtained from Murnahgan EOS (eqn (5)) (taken as (V/V0)1/3) for an ambient and 178 kbar pressure. This ratio obtained from Murnaghan equation is equal to 0.955, which is in perfect agreement with the value obtained from the crystal field (Tanabe–Sugano diagram) theory. This is also a proof of consistency of our analysis. It should be noticed that larger value of C/B ratio would yield worse agreement between results obtained from the crystal field theory and Murnaghan EOS.
From Tanabe–Sugano diagram the crossing between the 4T2g and 2T2g levels should occur at energy equal to about E/B ∼15, 22 (12![[thin space (1/6-em)]](https://www.rsc.org/images/entities/char_2009.gif) 633 cm−1 for B = 830 cm−1). Although no emission is expected at the crossing point, taking also into account the Stokes shift between the absorption and emission, the maximum of the luminescence should have occurred at wavelength of about 870 nm. This is longer wavelength than the observed peak of luminescence at highest pressure (around 178 kbar), at which the Mn2+ emission is still visible. It is again consisted with presented explanation of the pressure-induced Mn2+ luminescence quenching effect. According to our knowledge it is a first observation of such effect in inorganic compounds.
633 cm−1 for B = 830 cm−1). Although no emission is expected at the crossing point, taking also into account the Stokes shift between the absorption and emission, the maximum of the luminescence should have occurred at wavelength of about 870 nm. This is longer wavelength than the observed peak of luminescence at highest pressure (around 178 kbar), at which the Mn2+ emission is still visible. It is again consisted with presented explanation of the pressure-induced Mn2+ luminescence quenching effect. According to our knowledge it is a first observation of such effect in inorganic compounds.
IV.4. CIE chromaticity diagram as a function of pressure
The pressure dependence of luminescence color of jervisite phosphor doped with 5% Eu2+ and 15% Mn on CIE chromaticity diagram is presented in Fig. 16.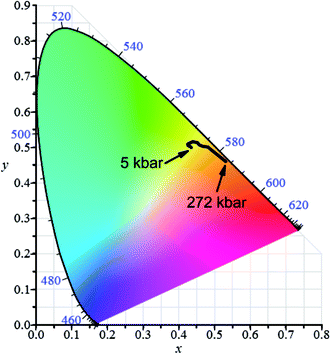 | ||
| Fig. 16 Chromaticity diagram of NaScSi2O6:Eu(5%),Mn(15%) jervisite luminescence induced by 325 nm as a function of pressure at room temperature. | ||
The pressure induced changes of coordinates on CIE diagram of NaScSi2O6:Eu(5%),Mn(15%) under 325 nm excitation are related to pressure shifts of the luminescence of Eu2+ and Mn2+. Actually the pressure shift of Mn2+ luminescence towards infrared remove this luminescence component from the visible spectrum at relatively low pressure. This is a reason that at low pressures a slight shift of color towards yellow is observed. At higher pressures a change of color in the direction of red is associated with the pressure-induced shift of the Eu2+ luminescence. The quenching of Mn2+ luminescence observed at higher pressures does not have important influence on the color of luminescence since the spectrum of Mn2+ emission is shifted to the infrared region, not well visible for human eye.
V. Conclusions
The high-pressure measurements of NaScSi2O6 doped with Eu(5%) and Mn(15%) show that the efficiency of nonradiative energy transfer from Eu2+ to Mn2+ ions is weakly dependent on pressure. The pressure-induced phase transition, detected by Raman spectroscopy under pressure, which occurs in this type of clinopyroxenes strongly decrease the efficiency of energy transfer, however only at pressures close to the phase transition. This suggest that decrease of the lattice constant in this type of compounds by so called “chemical pressure” will not significantly increase the efficiency of Mn2+ excitation in this type of phosphors. Although the thermal stability of these materials is high, i.e. there is practically no thermal quenching of Mn2+ up to 500 K. On the other hand high pressure measurements show that the Mn2+ luminescence can be quenched by the nonradiative processes associated with the crossing of the 2T2g and 4T1g states of the Mn2+ ions. This effect is observed for the first time, according to our knowledge. Also we observed the Mn2+ luminescence with a peak at about 810 nm, which is the longest wavelength known for this type of emission.The excitation spectra of the Mn2+ and Eu2+ luminescence show that the band gap of examined jervisite at room temperature in C2/c phase is around 310 nm (4 eV). The pressure-induced change of color of this phosphor is documented by calculations of CIE chromaticity coordinates. They are dominated by pressure changes of Eu2+ luminescence spectra.
Acknowledgements
This work was partially supported by the Projects DEC-2012/07/B/ST5/02080 and UMO-2014/13/D/ST3/04032 of the National Science Center of Poland, and Chongqing Overseas Talent Recruitment Program for year 2015. M. G. Brik thanks the supports from the Recruitment Program of High-end Foreign Experts (Grant No. GDW20145200225), the Programme for the Foreign Experts offered by Chongqing University of Posts and Telecommunications, Ministry of Education and Research of Estonia, Project PUT430, and European Regional Development Fund (TK141).References
- Z. Xia, Y. Zhang, M. S. Molokeev and V. V. Atuchin, J. Phys. Chem. C, 2013, 117, 20847 CAS.
- S. Y. Wass, Lithos, 1979, 12, 115 CrossRef CAS.
- https://wwwf.imperial.ac.uk/earthscienceandengineering/rocklibrary/viewminrecord.php?mineral=clinopyroxene.
- D. Hugh-Jones, T. Sharp, R. Angel and A. Woodland, Eur. J. Mineral., 1996, 8, 1337 CAS.
- A. B. Woodland, Geophys. Res. Lett., 1998, 25, 1241 CrossRef CAS.
- Z. Xia, Y. Y. Zhang, M. S. Molokeev, V. V. Atuchin and Y. Luo, Sci. Rep., 2013, 3, 3310 Search PubMed.
- Z. Xia, G. Liu, J. We, Z. Mei, M. Balasubramian, M. S. Molokeev, L. Peng, D. J. Miller, Q. Liu and K. R. Poeppelmeier, J. Am. Chem. Soc., 2016, 138, 1158 CrossRef CAS PubMed.
- A. Kamińska, A. Duzynska, M. Berkowski, S. Trushkin and A. Suchocki, Phys. Rev. B: Condens. Matter Mater. Phys., 2012, 85, 155111 CrossRef.
- J. Barzowska, K. Szczodrowski, M. Krośnicki, B. Kukliński and M. Grinberg, Opt. Mater., 2012, 34, 2095 CrossRef CAS.
- R. Zhong, X. Meng, M. Li, X. Wang, X. Wen and X. Zhang, Chem. Phys. Lett., 2012, 536, 55 CrossRef CAS.
- H. Yang, J. Konzett, D. J. Frost and R. T. Downs, Am. Mineral., 2009, 94, 942 CrossRef CAS.
- T. Arlt, M. Kunz, J. Stolz, T. Armbruster and R. J. Angel, Contrib. Mineral. Petrol., 2000, 138, 35 CrossRef CAS.
- A. Ullrich, R. Miletich, T. Balic-Zunic, L. Olsen, F. Nestola, M. Wildner and H. Ohashi, Phys. Chem. Miner., 2010, 37, 25 CrossRef CAS.
- F. Nestola, T. B. Ballaran, M. Tribaudino and H. Ohashi, Phys. Chem. Miner., 2005, 32, 222 CrossRef CAS.
- N. L. Ross and A. Navrotsky, Am. Mineral., 1988, 73, 1355 CAS.
- P. Comodi, F. Princivalle, M. Tirone and P. F. Zanazzi, Eur. J. Mineral., 1995, 7, 141 CrossRef CAS.
- T. Arlt, R. J. Angel, R. Miletich, T. Armbruster and T. Peters, Am. Mineral., 1998, 83, 1176 CrossRef CAS.
- M. Tribaudino, L. Mantovani, D. Bersani and P. P. Lottici, Am. Mineral., 2012, 97, 1339 CrossRef CAS.
- T. Arlt and R. J. Angel, Phys. Chem. Miner., 2000, 27, 719 CrossRef CAS.
- A. C. McCarthy, R. T. Downs and R. M. Thompson, Am. Mineral., 2008, 93, 198 CrossRef CAS.
- D. L. Dexter, J. Chem. Phys., 1953, 21, 836 CrossRef CAS.
- M. Inokuti and H. Hirayama, J. Chem. Phys., 1965, 43, 1978 CrossRef CAS.
- A. Suchocki and J. M. Langer, Phys. Rev. B: Condens. Matter Mater. Phys., 1989, 39, 7916 CrossRef.
- F. D. Murnaghan, Proc. Natl. Acad. Sci. U. S. A., 1944, 30, 244 CrossRef CAS.
- M. D. Wisser, M. Chea, Y. Lin, D. M. Wu, W. L. Mao, A. Salleo and J. A. Dionne, Nano Lett., 2015, 15, 1891 CrossRef CAS PubMed.
- M. Muller, S. Fischer and T. Justel, RSC Adv., 2015, 5, 67979 RSC.
- D. T. Palumbo and J. J. Brown Jr, J. Electrochem. Soc., 1970, 117, 1184 CrossRef CAS.
- M.-g. Zhao, G.-r. Bai and H.-c. Jin, J. Phys. C: Solid State Phys., 1982, 15, 5959 CrossRef CAS.
- M. C. M. de Lucas, F. Rodiguez and M. Moreno, J. Phys.: Condens. Matter, 1993, 5, 1437 CrossRef.
- S. Sugano, Y. Tanabe and H. Kamimura, Multiplets of transition-metal ions in crystals, Academic Press, 1970 Search PubMed.
Footnote |
| † Electronic supplementary information (ESI) available. See DOI: 10.1039/c6ra24854c |
| This journal is © The Royal Society of Chemistry 2017 |

