 Open Access Article
Dithizone-etched CdTe nanoparticles-based fluorescence sensor for the off–on detection of cadmium ion in aqueous media
Li Li*,
Lanfeng Liao,
Yaping Ding * and
Hongyan Zeng
Department of Chemistry, Shanghai University, Shanghai, 200444, P. R. China. E-mail: lilidu@shu.edu.cn; wdingyp@sina.com; Fax: +86-21-66132797; Tel: +86-21-66134734
First published on 7th February 2017
Abstract
In the present study, a new fluorescence probe based on dithizone-etched CdTe nanoparticles was designed for the sensitive and selective detection of cadmium ions in environmental samples via a reversible off–on fluorescence mode. At first, the initial bright fluorescence of L-cysteine-capped CdTe NPs could be effectively quenched in the presence of dithizone (DZ) due to the chemical etching effect, which results from the breaking of Cd–thiol layers by DZ, thus leading to a decrease in the NPs surface passivation. Then, upon the addition of Cd2+, the weak fluorescence of the CdTe NPs–DZ system gradually recovered, owing to the occurrence of Cd–thiol passivation layers on the surface of the NPs. Under optimal conditions, a good linear relationship was obtained in the range from 0.4 μM to 15.4 μM for Cd2+, with a detection limit of 0.13 μM. In addition, this CdTe NPs-based nanosensor presents remarkable selectivity for Cd2+ over other metal ions and was successfully applied for the detection of Cd2+ in real water samples with satisfactory results, demonstrating its potential application for the determination of Cd2+ in the environment.
1. Introduction
Owing to their non-biodegradability, heavy metals are one of the most hazardous classes of pollutants in water sources, which have caused widespread water pollution, fish contamination, and serious health problems.1,2 As one of the most prevalent toxic metals in the environment, cadmium ion (Cd2+) is widely present in air, soil, sediment, and water and can accumulate in the kidney, lung, liver, and bones of human beings with a long biological half-life of 20–30 years.3,4 Moreover, even at very low concentrations, Cd2+ can induce a wide variety of health issues including the major killer diseases such as heart disease, cancer, and diabetes.5–10 Inevitably, it is highly important to explore efficient methods for monitoring cadmium both in environment and in vivo.Several analytical techniques, including atomic adsorption spectrometry (AFS),11,12 inductively coupled plasma mass spectroscopy (ICP-MS),13,14 and electrochemical methods, have been established for the determination of Cd2+.15–17 Although these techniques generally provide high selectivity and sensitivity, they always require expensive and sophisticated instruments, complicated sample preparation, trained personnel, and high-cost, which limit their wide application. Therefore, there is a need to develop selective, sensitive, facile, rapid, and inexpensive approaches for the determination of cadmium ions. The use of a fluorescence probe is an alternative detection method that has the appealing advantages of high sensitivity, operational simplicity, and cost-effectiveness for the trace metal analysis. To date, a large number of fluorescent probes based on synthetic organic dyes for the determination of Cd2+ have been designed.18,19 Sil et al.18 developed a phenylene-vinylene-functionalized terpyridine conjugate-based turn-on fluorescent probe for the detection of Cd2+ in the submicromolar level. Visscher et al.19 reported a new fluorescence sensor for Cd2+ and Zn2+ based on a new acridine derivative. However, some shortcomings, such as relatively complicated synthesis and purification processes, low-fluorescence quantum yields, poor water solubility, use of biologically toxic solvents (MeCN, DMSO, and DMF), and weak resistance to photobleaching, still exist among these probes.
Compared to traditional organic dyes, colloidal semiconductor nanoparticles (also referred to as quantum dots, QDs) possess a series of merits such as broad excitation and size-tunable emission spectra, low-cost, simple synthetic routes, relatively high quantum yields (QYs), and photochemical stability. Due to these properties, semiconductor nanoparticles are widely used as fluorescent nanosensors for the detection of metal ions (such as Cd2+, Cu2+, Pb2+, Hg2+, and Fe3+),20–24 small molecular substances (for example, AA, melamine, and biothiol),25–27 protein/DNA,28,29 pH,30,31 anions (for instance, PO43−, NO2−, and CN−),32–34 etc. by monitoring the changes in their fluorescence intensity. Recently, quantitative detection of heavy metal ions with semiconductor nanoparticles via spectral changes in photoluminescence has been extensively reported. The fluorescent chemosensors are based on some sensing mechanism such as photoinduced electron transfer (PET), fluorescence resonance energy transfer (FRET), and electronic energy transfer (EET). In general, they work only when they meet certain requirements such as when they have a complementary geometry or are at a particular distance. As a result, methods based on the abovementioned mechanisms are complicated and restrict practical applications. An alternative approach to design fluorescent sensors is based on the chemical etching effect, which originates from an etching reagent generating specific recognition sites on the surface of NPs for the selective turn-on detection of an absorber in the detection system.35 This method can achieve enhanced sensitivity compared to other methods. However, CdTe NPs-based fluorescent sensors using dithizone as the etching reagent for the simple detection of cadmium ion by turning the fluorescence on have not been developed.
Herein, we propose a new and facile fluorescent sensor based on a CdTe NPs–dithizone (DZ) system for the highly selective detection of Cd2+ in environmental samples. First, CdTe NPs were applied to detect DZ based on the chemical etching effect by a remarkable fluorescence quenching phenomenon. Then, the CdTe NPs–DZ mixture could behave as a turn-on fluorescent sensor for the determination of Cd2+. Moreover, this method presented high selectivity and sensitivity for Cd2+ over other common metal ions.
2. Experimental
2.1 Reagents
All chemicals were of analytical reagent grade and were directly used as received without further purification. Cadmium chloride (CdCl2·2.5H2O, 99%), sodium borohydride (NaBH4, 98%), tellurium powder (Te, 99.999%, ∼100 mesh), L-cysteine (99%), dithizone (DZ), ethanol, and other routine chemicals were purchased from Shanghai Sinopharm Chemical Reagent Co. Ltd. (China). Unless otherwise stated, ultrapure water was used for the preparation of all the solutions throughout the experiments. Lake water was obtained from Pan-chi in our university, and tap water was obtained from our lab.2.2 Apparatus
Transmission electron microscopy (TEM) images of the L-cysteine-capped CdTe nanoparticles were acquired using a JEOL-200 CX transmission electron microscope (Japan). Size distribution of the particles was measured using a Zetasizer 3000HS Zeta potential/particle sizer (Malvern, UK). X-ray powder diffraction (XRD) spectra were obtained using a Rigaku D/max 2550 X-ray diffractometer equipped with Cu Kα radiation (λ = 0.15418 nm). Fourier transform infrared spectra (FT-IR) were obtained using an AVATAR 370 Fourier transform infrared spectrometer (America). A UV-2501PC spectrometer (Shimadzu, Japan) was used to acquire the ultraviolet visible (UV-vis) absorption spectrum. Lifetime measurements were carried out using a steady state and transient state fluorescence spectrometer (America). All fluorescence measurements were carried out using an RF-5301PC spectrofluorophotometer (Shimadzu, Japan) equipped with a 1 cm path-length quartz cell and a xenon lamp with right-angle geometry.2.3 Synthesis of water-soluble L-cysteine-capped CdTe NPs
Herein, based on the previous study, a modified method developed by our group was adopted to synthesize L-cysteine-capped CdTe NPs.36 Typically, 151.2 mg (4 mmol) of NaBH4 and 25.5 mg (0.2 mmol) of Te powder were added to a small flask, followed by the addition of 5 mL ultrapure water, where the air was pumped off and replaced with N2. The reaction mixture was heated at 26 °C to obtain a clear colourless solution. The obtained NaHTe solution was used as a Te precursor for further use.Cd precursor solutions were prepared according to the following steps. First, CdCl2·2.5H2O (91.3 mg, 0.4 mmol) and L-cysteine (121.2 mg, 1.0 mmol) were placed in a three-necked flask to form 95 mL homogeneous aqueous solution. Second, the pH value of the solution was adjusted to 9 by the dropwise addition of a 1.0 mol L−1 NaOH solution. Under the protection of N2, a freshly prepared NaHTe solution was quickly poured into the abovementioned mixture (final molar ratio: Cd2+/Te2−/L-cys = 1![[thin space (1/6-em)]](https://www.rsc.org/images/entities/char_2009.gif) :
:![[thin space (1/6-em)]](https://www.rsc.org/images/entities/char_2009.gif) 0.5
0.5![[thin space (1/6-em)]](https://www.rsc.org/images/entities/char_2009.gif) :
:![[thin space (1/6-em)]](https://www.rsc.org/images/entities/char_2009.gif) 2.5). Then, the mixture solution was boiled for 7–8 min in an oil bath and refluxed in a water bath at 60 °C for 1 h. The molar concentration of the CdTe NPs solution was estimated to be around 25 μM using the empirical mathematical functions reported by Yu et al.37 The solution was stored in the dark for further experiments after was cooled down.
2.5). Then, the mixture solution was boiled for 7–8 min in an oil bath and refluxed in a water bath at 60 °C for 1 h. The molar concentration of the CdTe NPs solution was estimated to be around 25 μM using the empirical mathematical functions reported by Yu et al.37 The solution was stored in the dark for further experiments after was cooled down.
2.4 Sample preparation for the PL quenching and enhancement
For dithizone detection, a series of solutions were prepared as follows. First, we successively added 200 μL of the as-prepared L-cysteine-capped CdTe NPs solution and different concentrations of dithizone (DZ) ethanol solution (from 0 to 62 μM) to a set of dry 25 mL calibrated flasks, diluted them to the calibration mark by adding ultrapure water, and then completely mixed them under gentle stirring to obtain their fluorescence spectra after incubation for 40 min. Eventually, we determined the optimal amount of dithizone (DZ) ethanol solution, which served as the fluorescence off reagent for further experiments.To detect Cd2+, 200 μL L-cysteine-capped CdTe NPs stock solution and a certain volume of dithizone (DZ) ethanol solution were respectively added to a set of dry 25 mL calibrated flasks, and left to react for 40 min to finish the quenching process. Then, we added different concentrations of Cd2+ stock solution to the flasks, and thoroughly mixed them. All fluorescence measurements were performed under ambient conditions. The excitation and emission slit widths were 5 nm, and the excitation wavelength was set at 328 nm.
3. Results and discussion
3.1 Characterization of the synthesized L-cysteine-capped CdTe NPs
The morphology and structure of the L-cysteine-capped CdTe NPs were characterized via TEM and XRD. The TEM image (Fig. 1A) indicates that the CdTe NPs are close to regular spherical and dispersed well in the aqueous solution with an average size of around 80 nm. Moreover, there are some linkages between the NPs, which visually reveal that L-cysteine was modified onto the NPs surface. Furthermore, we carried out the particle size measurement of the NPs using DLS equipment. As presented in Fig. 1B, the average size of the NPs is 137.4 nm, which is observably larger than that predicted from TEM. This is because the DLS technique provides the mean hydrodynamic diameter of the NPs core surrounded by solvation layers, which can be influenced by the concentration and viscosity of the solution.38 The XRD pattern is depicted in Fig. 1B, which was scanned over the 2 theta (θ) range of 10–80°. There are three broad and distinct diffraction peaks at 23.76°, 39.31°, and 46.43°, which correspond to the crystal planes of (111), (220), and (311), respectively. Furthermore, the position of the XRD peaks of the CdTe NPs matches well with that of a cubic zinc blend crystalline structure, according to the standard JCPDS data (card 15-0770). In addition, the EDS analysis shows strong atomic peaks corresponding to Cd and Te of the NPs and peaks from the L-cysteine ligand (C, S, and O) were also observed, which confirm the elemental composition of the L-cysteine-capped CdTe NPs. Moreover, the average atomic percentage ratio of Cd/Te is 1.87, which indicates that the as-prepared NPs are enriched in cadmium.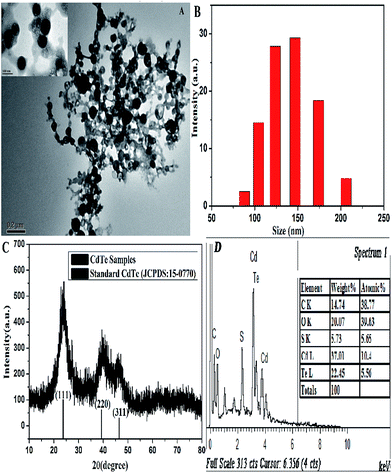 | ||
| Fig. 1 (A) TEM image, (B) dynamic light scattering, (C) XRD pattern, and (D) EDS spectrum of the CdTe NPs. | ||
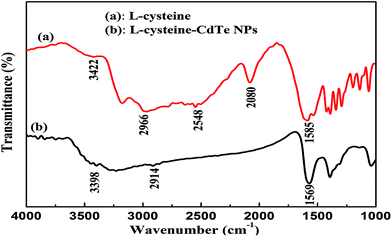
The bonding between the stabilizer L-cysteine molecules and CdTe NPs was confirmed by the FT-IR measurement (Fig. 2). In the FT-IR pattern of the L-cysteine-capped CdTe NPs, the three well-resolved peaks at 3402 cm−1, 2914 cm−1, and 1569 cm−1 are assigned to the stretching vibration of O–H, anti-symmetric stretching of –CH2, and asymmetric stretching vibration of COO−, respectively. Compared to the FTIR absorption spectrum of pure L-cysteine, the characteristic peak at 2548 cm−1 (the stretching vibrations of S–H) completely disappeared, which is attributed to the cleavage of S–H bonds and formation of Cd–S bonds. This is because L-cysteine, which is a bifunctional ligand, can afford thiol groups to form a chemical bond with Cd2+ on the NPs surface.39 Furthermore, the absorption peak at 2080 cm−1 (the stretching vibrations of the N–H of the –NH3+ group of L-cysteine) also disappeared due to the basification of the –NH3+ group of L-cysteine during the synthesis. The abovementioned results reveal that L-cysteine was successfully modified on the CdTe NPs surface. The UV-visible absorption and fluorescence emission spectra were applied to describe the optical properties of the L-cysteine-capped CdTe NPs. As depicted in Fig. 3, the excitonic peak of the CdTe NPs appears at 547 nm. Upon excitation at 328 nm, the NPs display a narrow and symmetrical fluorescence emission peak at 570 nm.
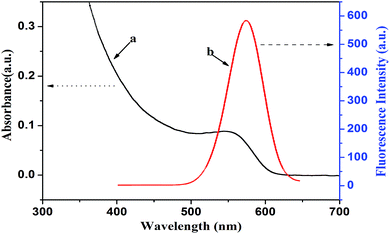 | ||
| Fig. 3 (a) UV-vis absorption and (b) fluorescence emission spectra of L-cysteine-capped CdTe nanoparticles. | ||
3.2 Optimization of the detection conditions
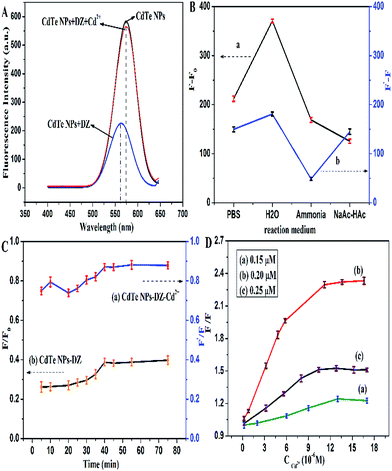
The fluorescence of the CdTe NPs was quenched by the addition of dithizone, and then recovered by the sequential addition of Cd2+ (Fig. 4A). To obtain the optimal detection conditions, we investigated various possible influences on the detection. In this study, we first studied the effect of the reaction medium. Phosphate buffer, ammonium chloride–ammonia buffer, sodium acetate–acetic acid buffer with the same pH values, and ultrapure water were all investigated and the results are shown in Fig. 4B. It can be seen that whether the fluorescence is quenched by dithizone or restored by Cd2+, the fluorescence intensity is the best in ultrapure water, which may be attributed to the ionic strength effect.40 Therefore, ultrapure water was chosen throughout the experiment.Reaction time also has an important influence on the fluorescence intensity as well as sensitivity of the system. As illustrated in Fig. 4C, the fluorescence of the CdTe NPs quickly decreased in the presence of dithizone and stabilized in 40 min. Furthermore, the fluorescence recovery of the DZ–CdTe NPs system was accomplished in 40 min. Thus, we chose 40 min as the optimal incubation time for further experiments. The effect of the concentration of CdTe NPs on the fluorescence response towards Cd2+ was also investigated and is displayed in Fig. 4D. It was found that the concentration of 0.20 μM CdTe NPs generates the best enhancement results.
3.3 The quenching of CdTe NPs by DZ
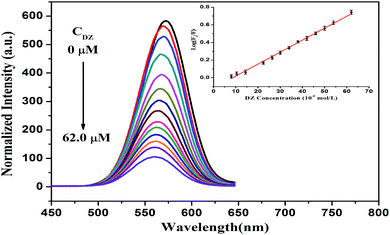
L-Cysteine, which is a thiol-capping reagent, could dramatically improve the stability and water-solubility of the CdTe NPs by forming a Cd–thiol complex around the surface of the NPs. Typically, this Cd–thiol complex surface layer occupies the surface sites and passivates the NPs to maintain high luminescence. However, dithizone (DZ), as a bidentate chelator, partly breaks these complex layers and removes Cd2+ on the surface of NPs. Then, the newly released Cd2+ combines with DZ, forming a new Cd–DZ complex. Hence, this partial loss of the Cd–thiol complex induced remarkable fluorescence quenching. As displayed in Fig. 5, with an increase in the DZ concentration, the fluorescence of the L-cysteine-capped CdTe NPs gradually decreases, and the quenching extent is dependent on the concentration of DZ. Moreover, a slight blue-shift (up to 11 nm) is observed in the fluorescence spectrum after the addition of 62 μM of DZ, which indirectly confirms the occurrence of a reduced diameter because of the absence of the Cd thiol complex around the surface of the NPs, which is in accordance with the size tuning fluorescence spectra of the NPs.37,39Furthermore, there is a good linear relationship between log(F0/F) and DZ concentration in the range of 8–62 μM. The regression equation is log(F0/F) = −0.1171 + 0.01359 [DZ] (μM) with a correlation coefficient of 0.998 (Fig. 5, inset), where F0 and F are the fluorescence intensities of the L-cysteine-capped CdTe NPs in the absence and presence of DZ, respectively. The limit of detection (LOD) for DZ was found to be 2.7 μM using the criterion of three times the standard deviation of the blank signal. In addition, we chose 38 μM DZ for the fluorescence restoration of the L-cysteine-capped CdTe NPs–DZ system induced by Cd2+.
3.4 The fluorescence recovery of the CdTe NPs–DZ by Cd2+
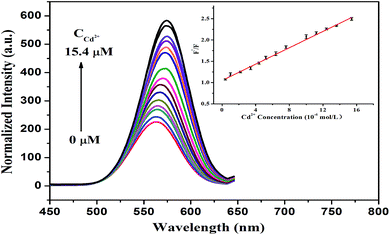
Accordingly, the addition of Cd2+ can result in the restoration of the fluorescence of the DZ-etched NPs since the introduction of Cd2+ can repair the destroyed surface of the NPs by again forming the Cd–thiol complex. As demonstrated in Fig. 6, the fluorescence intensity recovery of the CdTe NPs–DZ system is proportional to the concentration of Cd2+ in the range from 0.4 μM to 15.4 μM. The linear regression equation (inset of Fig. 6) is F′/F = 1.0495 + 0.0960 [Cd2+] (μM), where F is the fluorescence intensity of the CdTe NPs–DZ system and F′ presents the fluorescence intensity of the CdTe NPs–DZ system in the presence of Cd2+. The correlation coefficient was 0.999 and a low average relative standard deviation of 2.2% (ten repeats) was obtained. The limit of detection for Cd2+ is 0.13 μM based on 3S/K (S is the standard deviation of the blank signal of the CdTe NPs–DZ system (n = 10) and K is the slope of the calibration line). Furthermore, we also compared this method with other reported methods for the detection of Cd2+. As listed in Table 1, it can be seen that the present method has a comparable detection limit and linear range.3.5 Mechanism of the CdTe NPs fluorescence switch
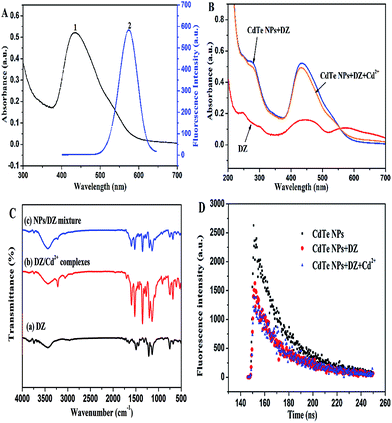
To the best of our knowledge, it has been reported that DZ could efficiently quench the fluorescence of CdTe NPs by a FRET process because of the spectral overlap between the emission of the CdTe QDs and the absorption of the surface DZ–Cd complex.45–47 However, poor spectral overlap between the emission spectrum of the CdTe NPs and the absorption spectrum of DZ–CdTe NPs system can be observed, as shown in Fig. 7A. Therefore, the fluorescence quenching of the CdTe NPs by DZ is not caused by FRET in this system. Herein, we propose a hypothesis according to previous studies.35,48 Upon the addition of DZ, the fluorescence of the NPs is apparently quenched probably due to the broken Cd–thiol complex surface layers. At the same time, Cd2+ on the surface of the NPs is removed, which accordingly creates specific Cd2+ recognition sites on the surface. The reaction here could be described as follows:35| CdTe@Cd–L-cys + DZ ↔ CdTe + L-cys + Cd(DZ) + Te− |
Since the specific Cd2+ recognition sites on the surface of the NPs could selectively bind Cd2+, upon the addition of Cd2+ into the DZ-etched NPs solution, the fluorescence of the DZ–NPs system is notably enhanced due to the re-passivation of the NPs on the surface. This is because some of the added Cd2+ could quickly relocate at the Cd2+ sites and the rest bond with the detached L-cys and remount on the surface of the NPs. The working principle of the designed sensor is shown in Scheme 1.
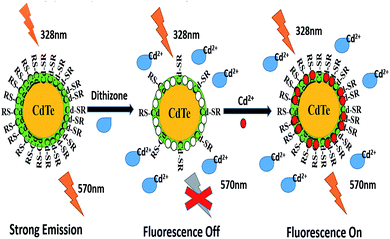 | ||
| Scheme 1 Schematic of the selective fluorescence turn off–on detection of Cd2+ with dithizone-etched CdTe nanoparticles. | ||
To further prove this hypothesis, we obtained the UV-vis absorption spectra and fluorescence spectra in the absence and presence of Cd2+. As illustrated in Fig. 7B, dithizone solution in ultrapure water shows three strong absorptions at 245 nm, 440 nm, and 574 nm. Upon mixing with CdTe NPs, the absorption peak of DZ at 574 nm disappears, whereas the intensity of the peak at 440 nm is enhanced with a blue-shift (about 5 nm) (Fig. 7B), which indicates the formation of a (Cd–DZ)n chelate in the solution. Since the coordination between DZ and Cd2+ can reduce the atom number of the conjugated system, it leads to an increase in the electronic transition energy.49 Similar spectral blue shifts (up to 11 nm) were also found in the corresponding fluorescence spectra of NPs–DZ (in Fig. 5). These variations show that DZ etched the surface of the NPs to release cadmium ions. However, upon the addition of Cd2+, the position of the peaks does not change, whereas the fluorescence of the DZ-etched NPs is recovered in conjunction with a red-shift in the emission spectra (Fig. 6). Note that the introduction of Cd2+ does not change the fluorescence of the unetched CdTe NPs (Fig. 4A). The above observed spectroscopic variations show a surface defect generation and repair process.50
Moreover, to further confirm the etching effect of DZ on the surface of the NPs, we obtained the FT-IR spectra and performed the PL lifetime measurements. FT-IR was mainly used to prove the formation of dithizone–Cd complexes in the mixture by comparing the FT-IR spectra of DZ, NPs/DZ mixture, and DZ/Cd2+ complexes (see Fig. 7C curve a–c). As shown in curve a, the IR peaks of DZ at 3437.2, 2961.1, 1645.1, 1495.0, 1445.8, 1316.0–1000, and 751.3–677.8 cm−1 correspond to N–H, C–H (benzene ring), C–C, N![[double bond, length as m-dash]](https://www.rsc.org/images/entities/char_e001.gif) N, N–C (the C of benzene ring), N–C (the C attached to S), and the vibration of the aromatic C–H bending, respectively. For the DZ/Cd2+ complexes, the consistent frequencies of the N–H (adjacent to the aromatic ring), N–H (adjacent to the C
N, N–C (the C of benzene ring), N–C (the C attached to S), and the vibration of the aromatic C–H bending, respectively. For the DZ/Cd2+ complexes, the consistent frequencies of the N–H (adjacent to the aromatic ring), N–H (adjacent to the C![[double bond, length as m-dash]](https://www.rsc.org/images/entities/char_e001.gif) S functional group), C–H, N–N, C–C, N
S functional group), C–H, N–N, C–C, N![[double bond, length as m-dash]](https://www.rsc.org/images/entities/char_e001.gif) N, N–C, and C–H bending vibrations appearing in the experimental IR spectra are 3435.04, 3219.37, 3057.18, 1702.19, 1595.36, 1523.41, 1352.08–1000, and 914.38–690 cm−1, respectively. The shift in the absorption and existence of new absorption bands suggest the formation of DZ/Cd2+ complexes. Furthermore, the FT-IR spectra of the NPs/DZ mixture is similar to the FT-IR spectra of the DZ/Cd2+ complexes, thus indicating the formation of DZ–Cd complexes in the mixture, which also demonstrate that DZ etches the surface of the NPs to leak cadmium ions. In addition, the PL lifetime measurement was also performed to demonstrate the etching effect of DZ on the NPs and the formation of passivation layers around the CdTe NPs. As presented in Fig. 7D, the fluorescence intensity signals of the NPs mono-exponentially decayed and the fluorescence lifetime of the NPs reduced from 24.3 ns to 20.3 ns after the addition of 14 μM of DZ, which can be ascribed to the surface chemical etching of DZ around the NPs.51 However, the fluorescence lifetime of this NPs–DZ system increased from 20.3 ns to 22.7 ns because of the introduction of 4 μM of Cd2+, as shown in Fig. 7D. In previous reports, the surface passivation of nanocrystals with high bandgap materials (e.g. QDs) has been confirmed to be a perfect route to improve the PL efficiency and stability of the nanocrystals.52
N, N–C, and C–H bending vibrations appearing in the experimental IR spectra are 3435.04, 3219.37, 3057.18, 1702.19, 1595.36, 1523.41, 1352.08–1000, and 914.38–690 cm−1, respectively. The shift in the absorption and existence of new absorption bands suggest the formation of DZ/Cd2+ complexes. Furthermore, the FT-IR spectra of the NPs/DZ mixture is similar to the FT-IR spectra of the DZ/Cd2+ complexes, thus indicating the formation of DZ–Cd complexes in the mixture, which also demonstrate that DZ etches the surface of the NPs to leak cadmium ions. In addition, the PL lifetime measurement was also performed to demonstrate the etching effect of DZ on the NPs and the formation of passivation layers around the CdTe NPs. As presented in Fig. 7D, the fluorescence intensity signals of the NPs mono-exponentially decayed and the fluorescence lifetime of the NPs reduced from 24.3 ns to 20.3 ns after the addition of 14 μM of DZ, which can be ascribed to the surface chemical etching of DZ around the NPs.51 However, the fluorescence lifetime of this NPs–DZ system increased from 20.3 ns to 22.7 ns because of the introduction of 4 μM of Cd2+, as shown in Fig. 7D. In previous reports, the surface passivation of nanocrystals with high bandgap materials (e.g. QDs) has been confirmed to be a perfect route to improve the PL efficiency and stability of the nanocrystals.52
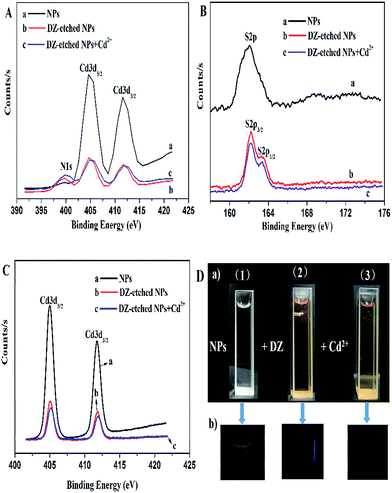
Moreover, the etching effect of DZ on the NPs was also demonstrated by XPS characterization. As presented in Fig. 8A(a and b), a new peak at 399.4 eV (N1s), appears in the XPS spectrum of the DZ-etched NPs, which is assigned to the nitrogen atoms in DZ, indicating that DZ is either bound to the surface or forms the DZ–Cd complexes in the solution. However, if DZ was bound to the surface of the material, the binding energy of S2p should have been shifted to a lower binding energy due to the lower binding energy of the S![[double bond, length as m-dash]](https://www.rsc.org/images/entities/char_e001.gif) C bond of DZ according to previous reports.47,53 On the contrary, as shown in Fig. 8B(a and b), the peak shape of S2p of the DZ-etched NPs appears asymmetric and the major peak shifts to a high binding energy in our study, confirming that DZ is not bound to the surface of the NPs. Thus, DZ forms the DZ–Cd complexes in the solution. Furthermore, the Cd3d spectrum of the NPs, as shown in Fig. 8C(a and b), shows the binding energy of Cd 3d5/2 and Cd 3d3/2 at 405.0 eV and 411.7 eV, respectively. After the addition of DZ, the binding energy of Cd 3d5/2 remains unchanged, whereas the binding energy of Cd 3d3/2 shifts from 411.7 eV to 411.9 eV, which also demonstrates that DZ etches the surface of the NPs to destroy the Cd–thiol layers. To investigate the response mechanism of Cd2+ on the DZ-etched NPs, we also performed XPS measurements on the DZ-etched NPs before and after the reaction with Cd2+. After the introduction of Cd2+, the peak of N1s, as shown in Fig. 8A(b and c), corresponding to nitrogen atoms in DZ, has no change and the high resolution spectrum of S2p (Fig. 8B(b and c)) slightly shifts to a high binding energy. Furthermore, the Cd3d spectra (Fig. 8C(b and c)) reveal that the binding energy of Cd 3d5/2 shifts to 405.2 eV from 405.0 eV, whereas the binding energy of Cd 3d3/2 has no change. These data clearly show the formation of Cd–thiol layers, which is in agreement with the previous reports.54 Moreover, as could be seen in Fig. 8D, the color of the solution changed from colorless to light red, which also demonstrates the formation of coordination bond between DZ and Cd ions. Thus, the result of the XPS analysis is consistent with those of other analyses including UV absorption, FT-IR, and PL lifetime spectra.
C bond of DZ according to previous reports.47,53 On the contrary, as shown in Fig. 8B(a and b), the peak shape of S2p of the DZ-etched NPs appears asymmetric and the major peak shifts to a high binding energy in our study, confirming that DZ is not bound to the surface of the NPs. Thus, DZ forms the DZ–Cd complexes in the solution. Furthermore, the Cd3d spectrum of the NPs, as shown in Fig. 8C(a and b), shows the binding energy of Cd 3d5/2 and Cd 3d3/2 at 405.0 eV and 411.7 eV, respectively. After the addition of DZ, the binding energy of Cd 3d5/2 remains unchanged, whereas the binding energy of Cd 3d3/2 shifts from 411.7 eV to 411.9 eV, which also demonstrates that DZ etches the surface of the NPs to destroy the Cd–thiol layers. To investigate the response mechanism of Cd2+ on the DZ-etched NPs, we also performed XPS measurements on the DZ-etched NPs before and after the reaction with Cd2+. After the introduction of Cd2+, the peak of N1s, as shown in Fig. 8A(b and c), corresponding to nitrogen atoms in DZ, has no change and the high resolution spectrum of S2p (Fig. 8B(b and c)) slightly shifts to a high binding energy. Furthermore, the Cd3d spectra (Fig. 8C(b and c)) reveal that the binding energy of Cd 3d5/2 shifts to 405.2 eV from 405.0 eV, whereas the binding energy of Cd 3d3/2 has no change. These data clearly show the formation of Cd–thiol layers, which is in agreement with the previous reports.54 Moreover, as could be seen in Fig. 8D, the color of the solution changed from colorless to light red, which also demonstrates the formation of coordination bond between DZ and Cd ions. Thus, the result of the XPS analysis is consistent with those of other analyses including UV absorption, FT-IR, and PL lifetime spectra.
3.6 Interference study
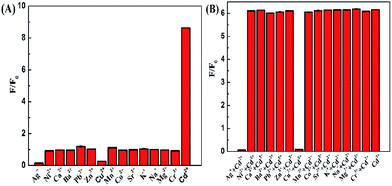
To evaluate the selectivity of the DZ-etched NPs as a turn-on fluorescent probe for Cd2+, we studied the fluorescence response of the CdTe NPs–DZ system in an environment with various relevant metal ions. As shown in Fig. 9, Ni2+, Ca2+, Ba2+, Pb2+, Zn2+, Mn2+, Co2+, Sr2+, K+, Na+, Mg2+, and Cr3+ did not produce any noticeable interference except Ag+ and Cu2+. A 10.4 μM Ag+ and Cu2+ almost completely quenched the fluorescence of the unetched and DZ-etched NPs, which is probably due to the formation of non-radiative recombination pathways.55 However, thiourea might be an efficient masking agent to eliminate the interference of Ag+ and Cu2+.563.7 Real sample detection
The viability of the as-fabricated L-cysteine-capped CdTe NPs-based fluorescent sensor was evaluated in the determination of Cd2+ in lake and tap water samples. From the results presented in Table 2, it could be seen that the average recoveries in the real samples vary from 97.21% to 107.60%, and the relative standard deviation (RSD) is lower than 5%, which suggest the validity of this method. Thus, the proposed sensor has good reliability for potential practical application.| Sample | Added (μM) | Found (μM) | % RSD (n = 3) | % recovery |
|---|---|---|---|---|
| a All values are reported as mean of three measurements. | ||||
| Lake water 1 | 8.0 | 8.013 | 3.16 | 100.2 |
| Lake water 2 | 8.0 | 7.842 | 3.02 | 98.0 |
| Lake water 3 | 12.0 | 11.551 | 2.24 | 96.3 |
| Tap water 1 | 6.0 | 6.021 | 1.44 | 100.4 |
| Tap water 2 | 10.0 | 9.965 | 1.80 | 99.7 |
| Tap water 3 | 12.0 | 11.658 | 3.03 | 97.2 |
4. Conclusions
In summary, we developed a novel and convenient method based on DZ-etched CdTe NPs for the determination of Cd2+ in aqueous media. Benefiting from simple, sensitive, and selective features, the as-prepared DZ-etched CdTe NPs work as an effective fluorescence sensor, showing a wide linear response range (0.4–15.4 μM), low detection limit (0.13 μM), good biocompatibility, and high selectivity for the quantitative determination of Cd2+. We believe that our findings present a possible approach for the future research on the design of highly sensitive biosensors.Acknowledgements
This work was financially supported by the National Natural Science Foundation of China (NSFC) (No. 21271127, 61171033), the National Natural Science Foundation of China (No. 21271127, 21671132), and the Natural Science Foundation of Shanghai Municipality (No. 13ZR1415600).Notes and references
- J. P. Vernet, Heavy Metals in the Environment, Elsevier, New York, 1991 Search PubMed.
- J. Fu, L. Wang, H. Q. Chen, L. Bo, C. L. Zhou and J. G. Chen, Spectrochim. Acta, Part A, 2010, 77, 625 CrossRef PubMed.
- D. M. Templeton and Y. Liu, Chem.-Biol. Interact., 2010, 188, 267 CrossRef CAS PubMed.
- X. Y. Xu and B. Yan, Sens. Actuators, B, 2016, 222, 347 CrossRef CAS.
- Y. Xue, H. Zhao, Z. J. Wu, X. J. Li, Y. J. He and Z. B. Yuan, Analyst, 2011, 136, 3725 RSC.
- H. Xu, R. Miao, Z. Fang and X. H. Zhong, Anal. Chim. Acta, 2011, 687, 82 CrossRef CAS PubMed.
- A. Ismail, A. Kawde, O. Muraza, M. A. Sanhoob and A. R. AlBetar, Microporous Mesoporous Mater., 2016, 225, 164 CrossRef CAS.
- S. Banerjee, S. Kar and S. Santra, Chem. Commun., 2008, 26, 3037 RSC.
- A. M. L. Marzo, J. Pons, D. A. Blake and A. Merkoç, Anal. Chem., 2013, 85, 3532 CrossRef PubMed.
- P. C. Huang, S. Li, N. Gao and F. Y. Wu, Analyst, 2015, 140, 7313 RSC.
- B. S. Zhao, M. He, B. B. Chen and B. Hu, Spectrochim. Acta, Part B, 2015, 107, 115 CrossRef CAS.
- A. Islam, N. Zaidi, H. Ahmad and S. Kumar, RSC Adv., 2015, 5, 46662 RSC.
- X. F. Mao, Y. Zhang, J. X. Liu, M. Wang, Y. Z. Qian, Z. W. Zhang, Y. H. Qi and C. L. Gao, RSC Adv., 2016, 6, 48699 RSC.
- A. O. Mehder, E. Yilmaz, A. Sungur, M. Soylak and Z. A. Alothman, At. Spectrosc., 2015, 36, 254 CAS.
- H. X. Dai, N. Wang, D. L. Wang, H. Y. Ma and M. Lin, Chem. Eng. J., 2016, 299, 150 CrossRef CAS.
- M. Roushani, A. Valipour and Z. Saedi, Sens. Actuators, B, 2016, 233, 419 CrossRef CAS.
- N. Ruecha, N. Rodthongkum, D. M. Cate, J. Volckens, O. Chailapakul and C. S. Henry, Anal. Chim. Acta, 2015, 874, 40 CrossRef CAS PubMed.
- A. Sil, A. Maity, D. Giri and S. K. Patra, Sens. Actuators, B, 2016, 226, 403 CrossRef CAS.
- A. Visscher, S. Bachmann, C. Schnegelsberg, T. Teuteberg, R. A. Mata and D. Stalke, Dalton Trans., 2016, 45, 5689 RSC.
- N. B. Brahim, N. B. H. Mohamed, M. Echabaane, M. Haouari, R. B. Chaabane, M. Negrerie and H. B. Ouada, Sens. Actuators, B, 2015, 220, 1346 CrossRef.
- S. Y. Liu, Y. Y. Li and X. G. Su, Anal. Methods, 2012, 4, 1365 RSC.
- Q. Zhao, X. L. Rong, L. Chen, H. B. Ma and G. H. Tao, Talanta, 2013, 114, 110 CrossRef CAS PubMed.
- R. Z. Zhang and W. Chen, Biosens. Bioelectron., 2014, 55, 83 CrossRef CAS PubMed.
- S. Liu, J. Tian, L. Wang, Y. Zhang, X. Qin, Y. Luo, A. M. Asiri, A. O. Al-Youbi and X. Sun, Adv. Mater., 2012, 24, 2037 CrossRef CAS PubMed.
- S. Huang, H. N. Qiu, F. W. Zhu, S. Y. Lu and Q. Xiao, Microchim. Acta, 2015, 182, 1723 CrossRef CAS.
- S. Y. Liu, J. J. Hu, H. Zhang and X. G. Su, Talanta, 2012, 101, 368 CrossRef CAS PubMed.
- L. Zhou, Y. H. Lin, Z. Z. Huang, J. S. Ren and X. G. Qu, Chem. Commun., 2012, 48, 1147 RSC.
- Y. Song, Y. Li, Z. P. Liu, X. Y. Wang, X. G. Su and Q. Ma, Biosens. Bioelectron., 2014, 61, 9 CrossRef CAS PubMed.
- L. L. Wang, J. Song, S. P. Liu, C. X. Hao, N. X. Kuang and Y. Q. He, J. Colloid Interface Sci., 2015, 457, 162 CrossRef CAS PubMed.
- C. F. Zhang, Y. Y. Cui, L. Song and X. F. Liu, Talanta, 2016, 150, 54 CrossRef CAS PubMed.
- M. J. Krysmann, A. Kelarakis, P. Dallas and E. P. Giannelis, J. Am. Chem. Soc., 2012, 134, 747 CrossRef CAS PubMed.
- V. Borse, P. Jain, M. Sadawana and R. Srivastava, Sens. Actuators, B, 2016, 225, 340 CrossRef CAS.
- H. L. Li, Y. W. Zhang, L. Wang, J. Q. Tian and X. P. Sun, Chem. Commun., 2011, 47, 961–963 RSC.
- L. Shang, L. H. Zhang and S. J. Dong, Analyst, 2009, 134, 107 RSC.
- P. Wu and X. P. Yan, Chem. Commun., 2010, 46, 7046 RSC.
- L. Li, Y. Cheng, S. Q. Gu, F. F. Zhang and W. J. Yu, Eur. J. Inorg. Chem., 2013, 14, 2564 CrossRef.
- W. W. Yu, L. Qu, W. Gao and X. Peng, Chem. Mater., 2003, 15, 2854 CrossRef CAS.
- A. H. Gore, D. B. Gunjal, M. R. Kokate, V. Sudarsan, P. V. Anbhule, S. R. Patil and G. B. Kolekar, ACS Appl. Mater. Interfaces, 2012, 4, 5217 CAS.
- R. Kuang, X. Kuang, S. Y. Pan, X. D. Zheng, J. C. Duan and Y. Q. Duan, Microchim. Acta, 2010, 169, 109 CrossRef CAS.
- H. Raghuraman and A. Chattopadhyay, Biopolymers, 2006, 83, 111 CrossRef CAS PubMed.
- Y. Zhang, Z. L. Zhang, D. H. Yin, J. Li, R. G. Xie and W. S. Yang, ACS Appl. Mater. Interfaces, 2013, 5, 9709 CAS.
- R. Khani, E. Ghiamati, R. Boroujerdi, A. Rezaeifard and M. H. Zaryabi, Spectrochim. Acta, Part A, 2016, 163, 120 CrossRef CAS PubMed.
- H. Xu, R. Miao, Z. Fang and X. H. Zhong, Anal. Chim. Acta, 2011, 687, 82 CrossRef CAS PubMed.
- N. B. Brahim, N. B. H. Mohamed, M. Echabaane, M. Haouari, R. B. Chaâbane, M. Negrerie and H. B. Ouada, Sens. Actuators, B, 2015, 220, 1346 CrossRef.
- S. G. Ge, L. Ge, M. Yan, X. R. Song, J. H. Yu and S. S. Liu, Biosens. Bioelectron., 2013, 43, 425 CrossRef CAS PubMed.
- K. Zhang, Q. S. Mei, G. J. Guan, B. H. Liu, S. H. Wang and Z. P. Zhang, Anal. Chem., 2010, 82, 9579 CrossRef CAS PubMed.
- Q. Zhao, X. L. Rong, H. B. Ma and G. H. Tao, J. Hazard. Mater., 2013, 250, 45 CrossRef PubMed.
- R. J. Gui, X. Q. An, H. J. Su, W. G. Shen, Z. Y. Chen and X. Y. Wang, Talanta, 2012, 94, 257 CrossRef CAS PubMed.
- Y. M. Leng, Y. L. Li, A. Gong, Z. Y. Shen, L. Chen and A. G. Wu, Langmuir, 2013, 29, 7591 CrossRef CAS PubMed.
- Y. Zhang, Y. Li and X. P. Yan, Anal. Chem., 2009, 81, 5001 CrossRef CAS PubMed.
- J. Wang, C. X. Jiang, X. Q. Wang, L. G. Wang, A. M. Chen, J. Hua and Z. H. Luo, Analyst, 2016, 141, 5886 RSC.
- B. O. Dabbousi, J. Rodriguez-Viejo, F. V. Mikulec, J. R. Heine, H. Mattoussi, R. Obter, K. F. Jensen and M. G. Bawendi, J. Phys. Chem. B, 1997, 101, 9463 CrossRef CAS.
- M. Stoev and A. Katerski, J. Mater. Chem., 1996, 6, 377 RSC.
- H. Borchert, D. V. Talapin, N. Gaponik, C. McGinley, S. Adam, A. Lobo, T. Moller and H. Weller, J. Phys. Chem. B, 2003, 107, 9662 CrossRef CAS.
- J. M. Costa-Fernández, R. Pereiro and A. Sanz-Medel, Trends Anal. Chem., 2006, 25, 207 CrossRef.
- M. C. Rong, L. P. Lin, X. H. Song, Y. R. Wang, Y. X. Zhong and J. W. Yan, Biosens. Bioelectron., 2015, 68, 210 CrossRef CAS PubMed.
| This journal is © The Royal Society of Chemistry 2017 |

