 Open Access Article
Effect of graphene oxide interlayer electron-phonon coupling on the electro-optical parameters of a ferroelectric liquid crystal
D. P. Singh *ad,
V. Kumarbe,
A. Kumarc,
R. Manohard,
Renu Pasrichae,
B. Duponchela,
Y. Boussoualema,
A. H. Sahraouia and
A. Daoudi*a
aUnité de Dynamique et Structure des Matériaux Moléculaires, EA 4476, Université du Littoral Côte d'Opale, F-59140 Dunkerque, France. E-mail: dpsr4u@gmail.com; daoudi@univ-littoral.fr; Fax: +91-522-2693662; Tel: +91-9451812800
bDepartment of Physics, Indian Institute of Technology, New Delhi, India
cDepartment of Physics, Deshbandhu College, Delhi University, New Delhi, India
dLiquid Crystal Research Lab, Physics Department, University of Lucknow, Lucknow, India
eElectron and Ion Microscopy Division, CSIR-National Physical Laboratory, New Delhi 110012, India
First published on 21st February 2017
Abstract
A small concentration of graphene oxide (GO) was dispersed in ferroelectric liquid crystal (FLC), and the effect of the same on the electro-optical parameters of the FLC–GO composite has been investigated using various techniques, such as Raman spectroscopy, UV-visible absorbance, XRD, and polarizing optical microscopy. The electro-optical parameters were remarkably modified and this effect is found to be strongly dependent on the cell thickness. Interlayer electron-phonon coupling and relative orientation between GO and the director of FLC are responsible for these effects. The presence of GO mainly induces local orientation in the FLC molecules at the interface, which was confirmed by X-ray diffraction results. The change in the UV absorbance of the composite is mainly due to scattering of incident photonic radiation through GO, smectic layers, and multi-domains. This study demonstrates optimization of the cell thickness in case of nanomaterials dispersed in mesogenic systems for their device applicability, such as UV light filters, and for the tailoring of material parameters by varying the cell thickness.
Introduction
During the last decade, coupling of carbon nanoscience and liquid crystal (LC) research has emerged as a means of developing novel materials for application in promising modern technologies.1 Graphene and its counterparts are of practical importance in all fields of basic science and technology, including that of LC research. At the fundamental level, graphene is composed of one single layer of graphite, in which sp2 bonded carbon atoms are arranged in a hexagonal lattice. However, graphene offers some extraordinary properties as compared to graphite. Graphene oxide (GO) is produced from graphite by chemical oxidation and subsequent exfoliation. Graphene oxide is often described as an electrical insulator due to the disruption of its sp2 bonding networks. The easy synthesis of GO and its compatibility with solution processing makes this material suitable for many applications. Graphite nanoplatelets and composites with ultra-high molecular weight polyethylene, polyphenylene sulphide, and epoxy resin, etc. have been recently reported by Gu et al.2–5 to enhance the thermal conductivity and mechanical properties. They have also reported the role of the formation of multidimensional thermally conductive networks and minimization of the interfacial thermal resistance in the determination of the enhanced thermal properties. Graphene field effect transistors (GFET), fabricated on a flexible Kapton substrate using 3-D inkjet printing, have also been presented as biosensors to detect infectious organisms.6Graphene based LC devices with high contrast ratios and better chemical stability were proposed by Blake et al.7 Kim et al.8 have reported a versatile new class of GO-based LCs, whereas Malik et al.9 have studied the effect of GO on electroclinic LC and explained the role of GO in supporting the vertical alignment of the electroclinic LC molecules. High-transmittance LC displays using graphene conducting layers were proposed by Jung et al.,10 whereas Basu11 reported the mechanism of electro-optical switching and polarization behaviour of the ferroelectric LC (FLC, named MX40636) in the presence of graphene. He observed the faster electro-optical switching of the FLC molecules, along with the enhancement of spontaneous polarization in the presence of 1.75 μm circular graphene flakes. We also observed faster electro-optical response without any change in the spontaneous polarization for the FLC–GO composite in 5 μm thick LC cell. In our work, the value of spontaneous polarization for the FLC–GO composite reduced when the interlayer electron-phonon coupling occurred. Using graphene quantum dots, Kumar et al.12 reported an enhanced electro-optical (E-O) response of the FLC material (ZLI 3654); however, phase transitional changes and the role of cell thickness have not been covered within the scope of this study. Electric field induced dynamic reorientation phenomenon of the graphene/graphitic flakes in a homogeneously aligned nematic liquid crystal (NLC) medium has been reported by S. H. Lee;13 they have discussed the relationship between the reorientation time of the flakes and the electric field strength, frequency, flake size, and shape anisotropy.
Dielectric relaxation behavior and phase transition of FLC depends upon the thickness14 of the LC cell; however, the material parameters, such as spontaneous polarization, hardly change with varying cell thickness. It is important to optimize the cell thickness to fabricate devices with optimal E-O response. Recently, Prakash et al. have reported the role of cell thickness in tailoring the dielectric and electro-optical parameters15 for two different FLCs. Strigazzi et al.16 have also reported the quadratic E-O effect and the role of cell thickness and voltage frequency in the FLC materials. The importance of cell thickness in the case of nanomaterial dispersed FLC systems has not been reported to date; therefore, there are plenty of opportunities to investigate such systems.
In this study, we report the synthesis of graphene oxide (GO) and its dispersion in the ferroelectric liquid crystal (FLC) medium with an optimized concentration of 0.1 wt/wt%. The FLC–GO composite has been well characterized using atomic force microscopy (AFM), Raman spectroscopy, differential scanning calorimetry (DSC), polarizing optical microscopy, and X-ray diffraction (XRD). We also investigated the role of cell thickness for the FLC–GO composite and the effect of interlayer electron-phonon coupling on the E-O properties when cell thickness is varied. The absorbance of UV-visible light by the FLC–GO composite was affected by the thickness-dependent scattering of light through the edges of GO, smectic layers, and multi-domains formed in the composite. Therefore, the present study reveals the optimization of sample cell thickness and the associated physical parameters to fabricate high performance E-O devices with faster switching speed. An attempt has been made to discuss the role of interlayer electron-phonon coupling in the GO based FLC composite and its effect on the electro-optical and optical properties with the variation of LC cell thickness. The contribution of the interlayer electron-phonon coupling has been overlooked in previous reports regarding the effects of graphene/graphene oxide on the physical properties of different LC materials.
Experimental
Scheme 1: the chemical structure and phase transition of the investigated FLC material
The chemical structure and phase transition of the investigated FLC material is shown below:Scheme 2: synthesis of graphene oxide (GO)
GO was synthesized from commercially available graphite (Alfa aesar, 99.999%) following Hummers method.17 For a typical reaction, 1 g each of graphite and NaNO3 were simultaneously added to 46 mL of H2SO4 and stirred in an ice bath, with the slow addition of 6 g KMnO4. The mixture was transferred to a water bath, preheated at 35 ± 5 °C, and after 1 h stirring, a thick paste was formed. Next, 90 mL of water was added and the temperature was increased to 90 ± 5 °C. The solution was again stirred for 30 min. Finally, 200 mL of water was added, followed by the slow addition of 3 mL of H2O2 (30%). The warm solution was then filtered and washed with distilled water. The product thus obtained was dispersed in water by mechanical agitation. To separate the non-exfoliated GO, the solution was centrifuged 3/4 times at 6000 rpm for 2 min. The dried GO was stored in a desiccator. The graphene oxide flakes contained multilayer sheets of different sizes.Scheme 3: preparation of the FLC–GO composite and sample cell filling
A suspension of GO (1 mg mL−1) was prepared in dimethylformamide (DMF, Merck chemicals) and sonicated for 3 h to eliminate bundling of the GO flakes. The average size of GO in the suspension was ∼7.5 nm. The doping concentration of GO was first optimized, and then dispersed in FLC to prepare the FLC–GO composite by taking 0.1 wt/wt% of GO in FLC. The main drawback of using graphene or graphene oxide was the agglomeration and restacking of the neighboring GO sheets due to strong van der Waals attraction. This was the main reason to avoid higher concentrations of GO in the FLC. The prepared FLC–GO composite was homogenized by magnetic stirring for 1 h at an isotropic temperature (120 °C), followed by sonication for the next 1 h. The abovementioned process was repeated several times to ensure the uniform distribution of GO in the FLC, which was confirmed by atomic force microscopy (AFM) and polarizing optical micrographs (POMs). The solvent (DMF) was evaporated from the composite at an elevated temperature with a slow evaporation rate. The LC sample cells of 5, 9, and 20 μm (Instec, Inc., USA) were filled with pure FLC and FLC–GO composite by means of the capillary method. The filled sample cells were cooled down to room temperature (RT) with very slow cooling rate to maintain an ordered molecular alignment.Scheme 4: equipments and measurement techniques
Electro-optical (E-O) parameters were calculated in the SmC* phase at 85 °C using the conventional polarization current reversal method by applying a triangular wave signal of 80 Hz by means of a function generator (Agilent 33120A) and oscilloscope (Agilent DSO6032A). The temperature was maintained using a LINKAM TMS 93 hot plate. The detailed measurement technique to calculate the electro-optical parameters has also been reported by our group.18,19 RT Raman spectroscopy was performed using a Raman spectrophotometer (EVA). The XRD measurement was performed at RT using a Rigaku Miniflex 300 instrument having X-ray source Cuα = 1.54 Å. The scan range and scan rate were 20–55° (on 2θ scale) and 1° min−1, respectively. UV-visible absorbance measurements were performed at 85 °C on LC cells using a UV-VIS-NIR spectrophotometer (VARIAN 5000) to observe the scattering effects in the SmC* phase. The topographical and roughness (height) profile characteristics were analyzed using an AFM (Veeco multimode equipped with a nanoscope IIIa controller, power of diode laser = 1 mW, λ = 690 nm, current sensitivity = 1 nA V−1, under ambient conditions) in tapping mode. The force constant between the SCM-PIC Pt–Ir coated conductive tip and substrate material was 0.2 N m−1. For the AFM study, FLC–QDs composite was deposited on a gold-coated quartz substrate by the dip coating method under normal atmospheric pressure. The coated substrate was dried at 80 °C for 3 h to remove the effect of solvent. Differential scanning calorimetry (DSC) measurements were performed on a TA Instrument (DSCQ1000), equipped with a liquid-nitrogen system, for cooling and heating ramps. The heating/cooling scan rate of DSC was 2 °C min−1. Polarizing optical micrographs (POMs) were obtained using a polarizing optical microscope (LEICA DMRXP) under field on/off states. The applied field to record POMs was 80 Hz and 6 V μm−1.Results and discussion
To reveal the distribution of GO in FLC, section analysis (roughness profile) and a 3D topographical image of the FLC–GO composite are shown in Fig. 1(a) and (b), respectively. The average vertical size of the GO flakes, as shown in Fig. 1(a), is =7.5 nm. The image in Fig. 1(b) clearly indicates the presence of uniform GO flakes in the FLC matrix.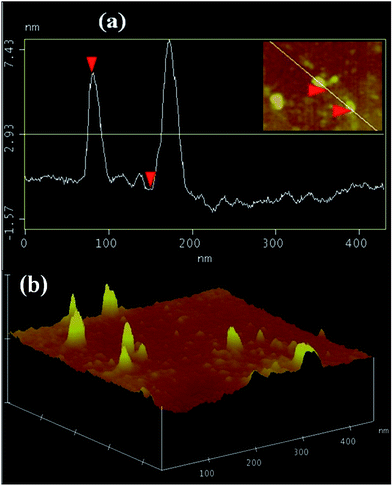 | ||
| Fig. 1 (a) Section analysis (height/roughness profile) and (b) 3-D topographical image of the FLC–GO composites. | ||
DSC analysis was performed to analyze the phase transitional effects on FLC resulting from the addition of GO (Fig. 2). Although the insertion of GO does not produce any observable shift in the Cr–SmC* or SmC*–N* phase transition temperatures, the transition enthalpies are found to be changed. For pure FLC, the enthalpy values during the cooling cycle corresponding to the Cr–SmC* and SmC*–N* phase transitions were −1.138 and −0.1339 J g−1, respectively, whereas for the FLC–GO composite, the values were −1.171 and −0.1703 J g−1, respectively. The change in the enthalpy signifies that the FLC–GO system loses more energy as compared to pure FLC. During phase transitions, the heat flows from GO to FLC molecules and a scattering of electrons takes place at the GO–FLC interface. This scattering of electrons at the GO–FLC interface causes more dissipation of energy in the FLC–GO composite. The DSC results indicate that such a composite can be utilized for converting the lost energy into external mechanical work. Basu et al.11 have also reported that the insertion of graphene does not alter the SmC*–SmA* phase transition temperature; however, the authors did not mention any information about the transition enthalpy. Different FLC materials have been analyzed as graphene/graphene oxide composites, but their phase transitions have not been comprehensively studied.9,11,12
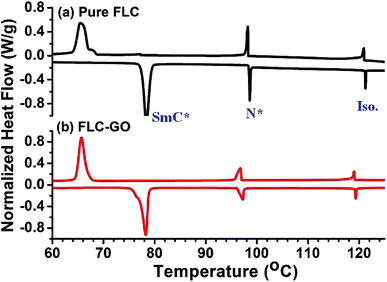 | ||
| Fig. 2 Differential scanning calorimetric (DSC) curves of (a) pure FLC and (b) FLC–GO. The heating/cooling rates were 2 °C min−1. | ||
Raman spectra of pure FLC and FLC–GO composite are shown in Fig. 3(a) and b, respectively. The Raman spectrum of pristine GO includes the D peak located at ∼1319 cm−1 and G peak at ∼1585 cm−1, caused by the disorder induced band and the doubly degenerate phonon mode, respectively. The presence of D and G peaks associated with pristine GO are also observed in the FLC–GO composite; however, they are shifted to 1419 and 1524 cm−1, respectively. In the composite, we focus on the shift of D and G peaks. In general, D peak frequency linearly up-shifts with an increase in the power of laser radiation, but in the present investigation, the up-shift of 100 cm−1 in the D peak is due to the presence of an improper dielectric material, i.e., FLC, which implies that the disorder in GO is greatly influenced by the presence of FLC molecules. Ruoff et al.20 reported that the frequency of the G peak can be shifted by charge doping via electron-phonon coupling. In the present investigation, the shift of 61 cm−1 in the G peak (doubly degenerate optical phonon of E2g symmetry) is attributed to the electron-phonon coupling21 in the FLC–GO composite. The presence of GO also suppresses the Raman band intensities of pure FLC observed at 846, 968, and 1084 cm−1. The relative intensity of the Raman peaks provides information regarding the resultant orientation of the director of FLC and GO, i.e., the molecular direction of the preferred orientation. It is clear from the Raman spectrum for the interval of 800–1100 cm−1 that the orientation of GO flakes and FLC molecules are not in the same direction. The intensity of the Raman peaks significantly changed due to the addition of GO. Kim et al.22 and Pellerin et al.23 have presented analyses of the relative orientation by observing the intensity of Raman peaks of polymers and liquid crystals, respectively. They have observed that the intensity of Raman peaks changes according to the molecular orientation. In the present study, when the cell thickness is 9 μm or larger, electron-phonon coupling in the GO flakes becomes effective. This orients GO away from the director of FLC and leads to a change in the value of spontaneous polarization. The change in the molecular ordering for FLC–GO composites has also been analyzed by the absorbance measurement and polarizing optical micrographs (POMs), both of which are discussed later in the manuscript.
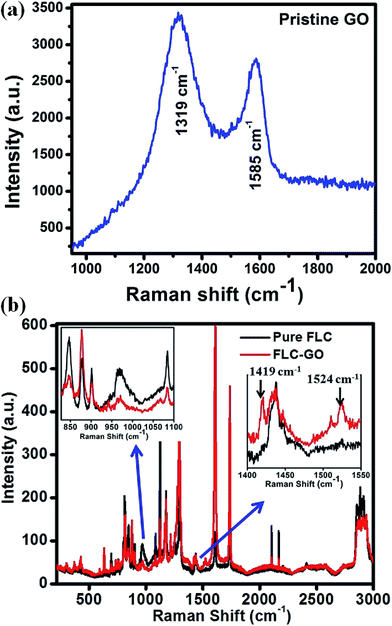 | ||
| Fig. 3 Raman spectra of (a) FLC and (b) FLC–GO composite at RT. The inset of (b) shows an enlarged portion of the Raman spectra between 800–1100 and 1400–1550 cm−1. | ||
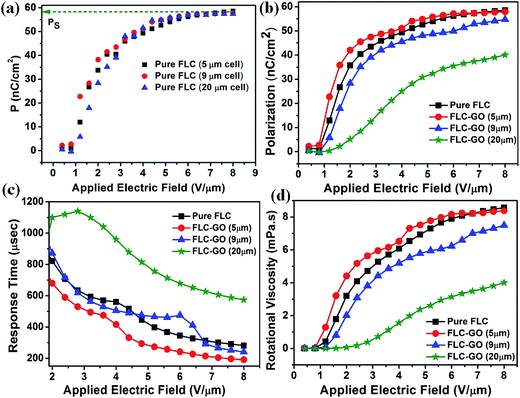
Electro-optical (E-O) parameters, such as spontaneous polarization (Ps), response time (τ), and rotational viscosity (γ), of pure FLC and FLC–GO composite are depicted in Fig. 4. The E-O parameters of FLC and FLC–GO composite were investigated in three different cells having thicknesses of 5, 9, and 20 μm. Fig. 4(a) presents the variation in the polarization of pure FLC with an applied electric field. It is observed that the spontaneous polarization (saturation value of the polarization curve), also known as the secondary order parameter for FLCs, remains invariant with the variation of cell thickness, whereas the E-O properties are cell-thickness dependent for the FLC–GO composite (for cell thickness, d > 5 μm). E-O properties (spontaneous polarization, response time, and rotational viscosity) of the FLC–GO composite are shown in Fig. 4(b), (c) and (d), respectively. The cell-thickness dependent change in the spontaneous polarization (E-O) is attributed to the inter layer electron-phonon coupling in the composite. The inter layer electron-phonon coupling leads to the delocalization of ionic charges in the composite, causing the change in electronic polarizability.24 Relative orientation of GO and director of FLC also contributes to determining the effective electronic polarizability of the FLC–GO composite as the cell thickness increases. This phenomenon results in a decrease in the value of spontaneous polarization (Ps) for the FLC–GO composite. For FLC–GO having d = 5 μm, no change in Ps (saturation value of polarization curve) as compared to pure FLC was observed, i.e., electron-phonon coupling is negligible due to the presence of single GO flakes in FLC. However, at greater cell thickness (d = 9 & 20 μm), the value of Ps is reduced (Fig. 4(b)) due to strong electron-phonon coupling. In this case, more GO flakes are accommodated (concentration of dopant remains the same) within the available space, which act upon electron-phonon coupling. In the case of d = 5 μm, the response of the FLC–GO composite is 34% faster, whereas in case of d = 9 μm, it is 14% faster than that of pure FLC. On further increasing the cell thickness (d = 20 μm), the response becomes even slower. The slower response is due to the deterioration of the molecular alignment of FLC in the presence of GO and formation of multi-domains in the composite. This change is clearly visible in the POM of 20 μm cell thickness (Fig. 7(h)). The GO layers are stacked with rotational disorder. Therefore, the changes in the rotational disorder in GO,20 along with π–π interaction between GO and FLC, are mainly responsible for the change in the rotational viscosity of the FLC–GO composite with the variation of cell thickness.
An X-ray diffraction (XRD) study at RT was performed to discern the local orientation of FLC molecules in the presence of GO. The XRD spectra of pure GO, FLC, and FLC–GO composite, are shown in Fig. 5(a) and (b), respectively. The XRD patterns of pristine GO possesses a sharp diffraction peak at 10.5° on the 2θ scale, which is ascribed to the (002) plane of the graphitic structure. The inter-planar spacing (d002) for GO is 0.84 nm. When various oxide/epoxide groups and intercalated H2O molecules are attached to GO, the diffraction peak is influenced according to the degree of oxidation. The presence of GO mainly induces local orientations in FLC molecules at a small Bragg's angle. The presence of GO perturbs the helical structure of FLC molecules due to guest–host (graphene oxide is treated as guest material in the host FLC) interaction via π–π stacking. This perturbation leads to few specific orientations of the FLC molecules at the GO interface. XRD peaks attributed to specific orientations at small Bragg's angle (5 ≤ 2θ ≤ 15) are clearly observed in the XRD spectra. These specific orientations of the FLC molecules create spontaneously distributed domain structures, which were further observed in POMs. For 5 ≤ 2θ ≤ 15 (inset of Fig. 5(b)), the diffraction peaks associated with the local orientation of FLC molecules are observed at 6.23° and 6.71° (on 2θ scale), having d-spacing of 1.4 and 1.3 nm, respectively. This local orientation of FLC molecules is assisted by GO. In the FLC–GO composite, a diffraction peak at (002), attributed to GO, was also observed at nearly 7° (on 2θ scale) with a d-spacing of 1.2 nm. This d-spacing for GO is larger than that of the previously reported value.25 This observation also indicates that the degree of oxidation in GO is also influenced when the FLC–GO composite is prepared. Few other local orientations (d-spacing = 1 nm) are observed, which suggests that the orientation of FLC molecules between the successive GO layers is not the same. The major FLC molecular orientation, observed at 11.52° (d-spacing = 0.76 nm), is enhanced in the presence of GO, which indicates the existence of stacking GO and FLC due to π–π interaction. Spontaneously distributed multi-domains with specific orientation (in 20 μm cell) are clear in POM (Fig. 7(h)).
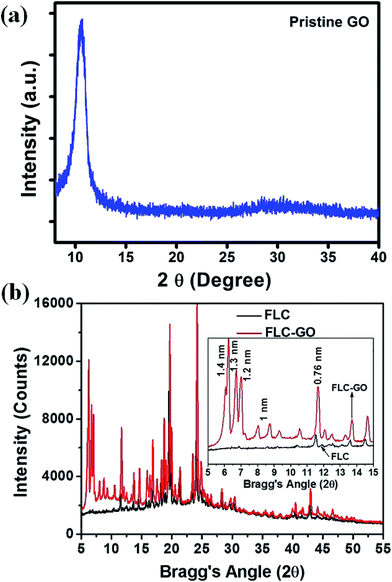 | ||
| Fig. 5 X-ray diffraction (XRD) spectra of (a) FLC and (b) FLC–GO composite at RT. The inset of (b) shows an enlarged portion of XRD spectra between 5–15° on 2θ scale. | ||
Fig. 6 shows the UV-visible absorbance of FLC and FLC–GO composite, whereas the inset shows the absorbance of the pristine GO. Pristine GO shows a principal absorbance peak at 230 nm attributed to π–π* transitions of C![[double bond, length as m-dash]](https://www.rsc.org/images/entities/char_e001.gif) C bonds along with one shoulder peak at 300 nm associated with n–π* transitions of the C
C bonds along with one shoulder peak at 300 nm associated with n–π* transitions of the C![[double bond, length as m-dash]](https://www.rsc.org/images/entities/char_e001.gif) O bonds.26 The π–π* transitions have higher molar absorptivity as compared to the n–π* transitions, which originates a shoulder peak at 300 nm analogous to C
O bonds.26 The π–π* transitions have higher molar absorptivity as compared to the n–π* transitions, which originates a shoulder peak at 300 nm analogous to C![[double bond, length as m-dash]](https://www.rsc.org/images/entities/char_e001.gif) O bonds. The investigated FLC material absorbs UV light at ∼318 and 369 nm, attributed to π–π* (C
O bonds. The investigated FLC material absorbs UV light at ∼318 and 369 nm, attributed to π–π* (C![[double bond, length as m-dash]](https://www.rsc.org/images/entities/char_e001.gif) C bond in the benzene ring) and n–π* transitions (C
C bond in the benzene ring) and n–π* transitions (C![[double bond, length as m-dash]](https://www.rsc.org/images/entities/char_e001.gif) O bond in the linkage group), respectively. Few unwanted noise signals in the absorbance curves are also observed in the low wavelength region. In the FLC–GO composite, the absorbance due to π–π* transition is blue shifted by 14 nm, whereas the position of 369 nm absorbance peak remains unchanged. In the case of FLC–GO composite in the 5 μm cell, the absorbance increases because of the additional absorbance by the GO layers. As we increase the cell thickness, scattering of the incident light through the edges of GO, multi-domains, and smectic layers takes place.
O bond in the linkage group), respectively. Few unwanted noise signals in the absorbance curves are also observed in the low wavelength region. In the FLC–GO composite, the absorbance due to π–π* transition is blue shifted by 14 nm, whereas the position of 369 nm absorbance peak remains unchanged. In the case of FLC–GO composite in the 5 μm cell, the absorbance increases because of the additional absorbance by the GO layers. As we increase the cell thickness, scattering of the incident light through the edges of GO, multi-domains, and smectic layers takes place.
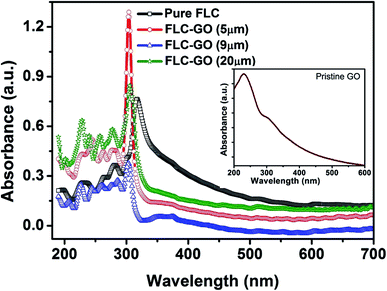 | ||
| Fig. 6 UV-visible absorbance curves of FLC and FLC–GO for different cell thickness at 85 °C. The insets show the UV-visible absorbance curve of pristine GO. | ||
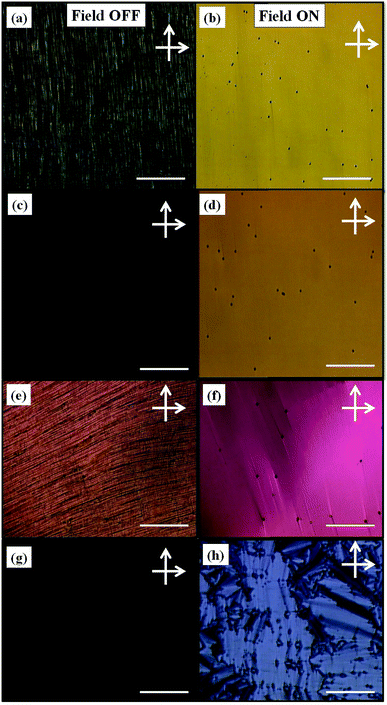
Fig. 7(a) and (b) shows the polarizing optical micrographs (POMs) of pure FLC for field OFF/ON states. The scale bar in all POMs represents 10 μm. Fig. 7(c), (e) and (g) represent the POMs of FLC–GO composite for the field off state, having cell thicknesses of 5, 9, and 20 μm, respectively, whereas Fig. 7(d), (f) and (h) correspond to the POMs of FLC–GO composite for field on state and having cell thicknesses of 5, 9, and 20 μm, respectively. The field on state corresponds to an applied field of 6 V μm−1 on the cells. It is clear from Fig. 7(c) and (d) that FLC–GO composite (in 5 μm sample cell) favors a completely dark state (Fig. 7(c)) as compared to pure FLC (Fig. 7(a) and (b)). This result indicates that the presence of GO enhances the contrast of FLC materials. The enhancement in contrast is also clear from the absorbance study, in which the absorbance of FLC–GO is higher (Fig. 7(c)) as compared to pure FLC (Fig. 7(a)) in a 5 μm sample cell. When we increase the thickness of the sample cell up to 9 μm, the interlayer electron-phonon coupling in GO flakes takes place, which changes the FLC molecular orientation. The changes in POMs (Fig. 7(e) and (f)) are clear consequence of an interlayer electron-phonon coupling in GO, which subsequently changes the FLC molecular orientation. For the FLC–GO composite, the alignment in the sample cells does not degrade up to a cell thickness of 9 μm; however, the change in the color of POMs is associated with the changes in the effective refractive index. At this stage (for 9 μm cell thickness), the absorbance reduces due to the effect of interlayer electron-phonon coupling in GO. Fig. 7(h) reveals that the orientation of GO is not similar to that of FLC molecules; therefore, the resultant orientation of FLC–GO favors the formation of multi-domains in the composite. The deterioration of the FLC molecular ordering and formation of the spontaneously distributed multi-domains are clearly visible in Fig. 7(h) (20 μm cell thickness). In this case, the absorbance increases due to the scattering of light through these multi-domains, smectic layers, and edges of GO. The XRD and Raman results support the scattering of incident light in the FLC–GO composite via local ordering, as observed in the XRD measurement. G band in graphitic materials is the only band coming from the first-order Raman scattering; therefore, the shift in the G band in FLC–GO composite is also analogous to the change in the amount of scattered radiation through GO layers.
Conclusions
In summary, we investigated GO dispersed in FLC with varying cell thickness and observed the existence of an interlayer electron-phonon coupling in the FLC–GO composite. The effect of the inter layer electron-phonon coupling on the electro-optical and optical parameters have been analyzed by the experimental techniques and discussed. The presence of electron-phonon coupling was confirmed by Raman spectroscopy as the G band is found to be shifted by 61 cm−1 in the FLC–GO composite. Taking the same cell thickness for pure FLC and FLC–GO, the secondary order parameter (Ps) remains the same, whereas the electro-optical response is enhanced by 34%. When d > 5 μm, Ps decreases because of the inter layer electron-phonon coupling that leads to the delocalization of ionic charges. This delocalization in ionic charges causes the change in the electronic polarizability and results into a reduced value of Ps. The π–π interaction between GO and FLC along with the rotational disorder in GO is responsible for the change in the rotational viscosity of the composite. FLC molecules acquire a local orientation at the FLC–GO interface, which was confirmed by XRD. The absorbance of light also varies with the variation in cell thickness, which is governed by the scattering of incident photonic radiation by edges of GO layers, multi-domains, and smectic layers. A cell thickness of 5 μm for FLC–GO composite is appropriate for the FLC–GO based UV filters and other device fabrication as it fosters the E-O response by 34% without changing the secondary order parameter of FLC. This feature has practical importance in the fabrication of opto-electronic devices with faster response. The present article evinces the optimized cell thickness and doping concentration of GO in the FLC for device applicability. The observed phenomenon of inter layer electron-phonon coupling in graphene and graphene oxide composites with liquid crystalline materials has been overlooked in the previously reported articles, which has been discussed here in detail.Acknowledgements
DPS is thankful to CEFIPRA and Campus France for Raman-Charpak fellowship in France. RM is thankful to the UGC research award.References
- J. Wu, W. Pisula and K. Mullen, Chem. Rev., 2007, 107, 718 CrossRef CAS PubMed.
- J. Gu, N. Li, L. Tian, Z. Lv and Q. Zhang, RSC Adv., 2015, 5, 36334 RSC.
- J. Gu, J. Du, J. Dang, W. Geng, S. Hu and Q. Zhang, RSC Adv., 2014, 4, 22101 RSC.
- J. Gu, X. Yang, Z. Lv, N. Li, C. Liang and Q. Zhang, Int. J. Heat Mass Transfer, 2016, 92, 15 CrossRef CAS.
- J. Gu, C. Xie, H. Li, J. Dang, W. Geng and Q. Zhang, Polym. Compos., 2014, 35, 1087 CAS.
- L. Xiang, Z. Wang, Z. Liu, S. E. Weigum, Q. Yu and M. Y. Chen, IEEE Sens. J., 2016, 16(23), 8359 Search PubMed.
- P. Blake, P. D. Brimicombe, R. R. Nair, T. J. Booth, D. Jiang, F. Schedin, L. A. Ponomarenko, S. V. Morozov, H. F. Gleeson, E. W. Hill, A. K. Geim and K. S. Novoselov, Nano Lett., 2008, 8(6), 1704 CrossRef PubMed.
- J. E. Kim, T. H. Han, S. H. Lee, J. Y. Kim, C. W. Ahn, J. M. Yun and S. O. Kim, Angew. Chem., Int. Ed., 2011, 50, 3043 CrossRef CAS PubMed.
- A. Malik, A. Choudhary, P. Silotia, A. M. Biradar, V. K. Singh and N. Kumar, J. Appl. Phys., 2010, 108, 124110 CrossRef.
- Y. U. Jung, K. W. Park, S. T. Hur, S. W. Choi and S. J. Kang, Liq. Cryst., 2014, 41(1), 101 CrossRef CAS.
- R. Basu, Appl. Phys. Lett., 2014, 105, 112905 CrossRef.
- V. Kumar, A. Kumar, A. M. Biradar, G. B. Reddy, D. Sachdev and R. Pasricha, Liq. Cryst., 2014, 41(12), 1719 CrossRef CAS.
- W. Tie, S. S. Bhattacharyya, Y. J. Lim, S. W. Lee, T. H. Lee, Y. H. Lee and S. H. Lee, Opt. Express, 2013, 21(17), 19867 CrossRef PubMed.
- S. K. Kundu, K. Suzuki and B. K. Chaudhuri, Jpn. J. Appl. Phys., Part 1, 2004, 43, 4286 CrossRef CAS.
- J. Prakash, A. Chandran, A. Malik and A. M. Biradar, Liq. Cryst., 2015, 42, 1748 CrossRef CAS.
- A. Strigazzi, E. Pozhidaev, S. Torgovac, A. S. Gliozzi and C. A. R. Yednakd, Liq. Cryst., 2016, 43, 49 CrossRef CAS.
- W. S. Hummers and R. E. Offeman, J. Am. Chem. Soc., 1958, 80, 1339 CrossRef CAS.
- D. P. Singh, S. K. Gupta, T. Vimal and R. Manohar, Phys. Rev. E: Stat., Nonlinear, Soft Matter Phys., 2014, 90, 022501 CrossRef PubMed.
- D. P. Singh, S. K. Gupta, S. Pandey, K. Singh and R. Manohar, J. Appl. Phys., 2014, 115, 214103 CrossRef.
- Y. Zhu, S. Murali, W. Cai, X. Li, J. Won Suk, J. R. Potts and R. S. Ruoff, Adv. Mater., 2010, 22, 3906 CrossRef CAS PubMed.
- J. Yan, Y. Zhang, P. Kim and A. Pinczuk, Phys. Rev. Lett., 2007, 98, 166802 CrossRef PubMed.
- K. H. Kim, K. Miyachi, K. Ishikawa, H. Takezoe and A. Fukuda, Jpn. J. Appl. Phys., Part 1, 1994, 33, 5850 CrossRef CAS.
- M. R. Lacroix and C. Pellerin, Macromolecules, 2013, 46, 5561 CrossRef.
- J. J. Licari and R. Evrard, Phys. Rev. B: Solid State, 1977, 15, 2254 CrossRef CAS.
- H. Feng, R. Cheng, X. Zhao, X. Duan and J. Li, Nat. Commun., 2013, 4, 1539 CrossRef PubMed.
- G. Eda and M. Chhowalla, Adv. Mater., 2010, 22, 2392 CrossRef CAS PubMed.
| This journal is © The Royal Society of Chemistry 2017 |


