 Open Access Article
Creative Commons Attribution 3.0 Unported Licence
Carbon metabolism and transcriptional variation in response to salt stress in the genome shuffled Candida versatilis and a wild-type salt tolerant yeast strain†
Wei Qiabc,
Wen-Tao Zhangd and
Fu-Ping Lu*abc
aKey Laboratory of Industrial Fermentation Microbiology, Tianjin University of Science & Technology, Ministry of Education, No. 29, 13th Road, Tianjin Economy-and-Technology Development Area, Tianjin 300457, P. R. China. E-mail: qiweismiling@126.com; Fax: +86-22-60601332; Tel: +86-22-60601428
bNational Engineering Laboratory for Industrial Enzymes, Tianjin University of Science & Technology, Tianjin Economy-and-Technology Development Area, Tianjin 300457, P. R. China
cTianjin Key Laboratory of Industrial Microbiology, Tianjin University of Science & Technology, Tianjin Economy-and-Technology Development Area, Tianjin 300457, P. R. China
dKey Laboratory of Food Nutrition and Safety, Tianjin University of Science & Technology, Ministry of Education, Tianjin 300457, P. R. China
First published on 9th January 2017
Abstract
The carbon metabolism and molecular mechanisms of adaptation response when exposed to conditions causing osmotic stress in strains of a wild-type of Candida versatilis (WT) and S3–5 were investigated. The levels of glucose, glycerol and ethanol, as well as transcriptional variation of eight genes that encoded hexokinase (HXK1), mitogen-activated protein kinase (HOG1), glycerol-3-phosphate dehydrogenase (GPD1), aquaglyceroporin (FPS1), pyruvate kinase (PYK1), pyruvate decarboxylase (PDC1), aldehyde dehydrogenase (ALD6), alcohol dehydrogenase (ADH1) in short-term response to salt stress were determined. The results showed that an increase in salt concentration negatively affected glucose consumption and ethanol production in C. versatilis. In contrast, glycerol produced by C. versatilis was positively affected by salt addition. The results showed that HXK1 contributes to rerouting glycolytic flux towards higher glycolysis. The glycerol production generated by S3–5 was higher as compared to WT, which is ascribed to the up-regulated expression of GPD1 and HOG1 genes and down-regulated expression of the FPS1 gene after the initiation of stress treatment.
Introduction
Candida versatilis, a salt-tolerant yeast, is widely used in the fermentation of soy sauce, soybean paste and miso.1 It could contribute in a positive manner to the flavour development though a series of metabolic activities, such as formation of 4-hydroxy-2(or 5)-ethyl-5(or 2)-methyl-3(2H)-furanone (HEMF) and 4-ethyl guaiacol (4-EG).2 During the fermentation process, yeast is subjected to a high salt osmotic stress which would affect its viability and fermentation efficiency. Dynamic changes occur in the complex biological networks which would provide insight into the link between the genome, gene-expression, proteins and metabolites, etc.Various studies have been performed to investigate salt-tolerant yeast responses and adaptation stress mechanisms by which cells adapt to ‘adverse’ conditions in the fermentation,3–6 including (1) its transport systems for adjusting ion homeostasis and counteracting the toxic effects caused by sodium ions,7 such as plasma membrane H+-ATPase8,9 and Na+/H+ antiporter 9; (2) synthesis and accumulation compatible solutes, such as glycerol,10,11 trehalose,12 mannitol,3,4 which stabilize the activity and structure of diverse proteins and membranes 13; (3) regulation membrane fluidity and permeability by changing lipid components 14; (4) multiple signalling pathways to perceive and to quickly respond to altered osmolarity, such as high osmolarity glycerol (HOG) response pathway.15,16
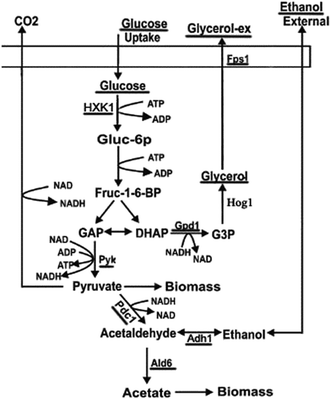
Cells adapt to rapid and drastic environmental changes by turning ‘on’ and ‘off’ specific subsets of genes and proteins. From a molecular point of view, it is important to obtain information of signal transduction and the transcriptional response on the yeast adaptation during stress-responsive phase. The cellular mechanisms of adaptation to salt stress in strains of a wild type of C. versatilis (WT) and S3–5, genome shuffling strains of C. versatilis with improving tolerance to salt, has been well conducted in the previous research.3,4,6 However, there have been very few studies on this topic by rapidly shifting Candida versatilis cells from a medium without salt to stressful conditions.17 C. versatilis growing exponentially on glucose produces glycerol and ethanol, the both compounds can be used as single carbon and energy sources.4 Moreover, glycerol have been implicated as potential stress protectants that accumulate in yeasts during various stress conditions.17 In the present study, glucose, glycerol and ethanol metabolism as well as expression of related genes (underlined in Fig. 1) was analyzed by the treatment of NaCl. The investigation of such molecular responses will help us to understand the molecular mechanisms by which cells adapt to fermentation conditions.
Materials and methods
Chemicals
Analytical grade chemicals and solvents were purchased from Tianjin Chemical Reagent Research Institute (Tianjin, China). Chromatographic grade (HPLC) acetonitrile were obtained from Merck (Darmstadt, Germany). Double-distilled water for the dilution of samples was purified using a Milli-Q system (Millipore, Bedford, MA, USA).Yeast strains
Yeast strains C. versatilis wild-type (WT) and S3–5 used in this work were kept in our laboratory. The genome shuffled strain S3–5 was derived from the WT yeast strain C. versatilis, initially isolated for improved tolerance to salt.18Media and growth conditions
C. versatilis cells were grown in 10 ml YPD at 30 °C with rotary shaking (at 180 rpm). After 24 h incubation, the culture was transferred to 250 ml flask containing 100 ml of YPD (1% yeast extract, 2% peptone, 2% glucose). The yeast was incubated to its early stationary phase (OD 1.0 (600 nm)). Cells in early stationary phase were inoculated at 10% (v/v) in YPD containing 0, 2 M and 4 M NaCl and incubated at 30 °C.Analytical methods and data analysis
5 ml culture was undertaken at 0, 0.5, 1, 2, 4, 6 h and filtered using a 0.45 μm membrane filter (Millipore, France) under a pump-applied vacuum. The clarified supernatant was used for determination of extra-cellular glucose, glycerol and ethanol, and the filtrate was used for dry biomass assay.Dry biomass
The filtrate was oven-dried at 105 °C for 4 h to constant mass.19Intra- and extra-cellular concentrations of glucose and glycerol
Cells (5 ml culture) were collected by centrifugation (5000 rpm, 4 °C, 5 min) and washed twice with double-distilled water and heated in a constant temperature water bath at 95 °C for 15 min. After centrifugation as mentioned previously, the supernatant was used to measure the internal glucose and glycerol.The glucose and glycerol was performed using a Shimadzu 20AB (Shimadzu, Japan), with a refractive index detector after separation in an Aminex HPX-87H column. The column oven and RID were set to 30 °C and 35 °C respectively. The acetonitrile–water (70%, v/v) mix was used as the eluent at a flow rate of 1 ml min−1. The intra-cellular glucose and glycerol content was expressed as a percentage of dry biomass.
The content of external ethanol
The ethanol was analyzed by headspace solid phase micro-extraction (HS-SPME) gas chromatography spectrometry as De Martinis described.20 The GC analysis was performed using a Shimadzu GC with flame ionization detector (GC-FID) and equipped with a DB-5MS fused silica column (30 m × 0.25 mm × 0.25 μm, J&W Scientific, Folsom, CA). The oven temperature was maintained at 60 °C for 10 min and increased to 240 °C at a rate of 5 °C min−1. The injector and transfer-line temperatures were 250 °C and 280 °C, respectively. Helium was used as carrier gas (about 47 ml min−1, 30 kPa) and the compounds were detected via a flame-ionization detector.RNA isolation and real-time PCR analysis
Total RNA prepared using the MiniBEST Universal RNA Extraction Kit (Takara, Dalian, China). Three biological replicates were prepared for each accession and salt combination. RNA was quantified by Nanodrop (ND-2000, NanoDrop Technologies, USA); quality was assessed by agarose gel analyses and 2100 Bioanalyzer (Agilent Technologies, Santa Clara, CA). Ten micrograms of total RNA from each sample was converted to double-stranded cDNA using the PrimeScript™ RT reagent Kit (Perfect Real Time) (TaKaRa, Dalian, China).Primers (Table S1†) were designed using primer premier 5.0 (Premier, Canada) and provided by Sangon Biotech Co., Ltd. (Shangai, China).
Real-time PCR analysis was performed in Eppendorf mastercycler ep realplex4 (Eppendorf, Germany) using SYBR Green. Reactions were performed in a volume of 20 μl containing 2 μl cDNA, 0.8 μl forward and reverse primers, and 10 μl SYBR® Premix Ex Taq™ II (Takara, Dalian, China). Duplicates of each sample and negative controls were included in the analysis. The amplification conditions were as follow: 95 °C for 30 s; 40 cycles of 95 °C for 5 s, 55 °C for 30 s. Each sample was repeated three times. Data were analyzed by the 2−ΔΔCT method.
Statistical analysis
Statistical significance was determined using the SAS statistical analysis program, Version 8.01 (North Carolina State University, USA).Results and discussion
The level of glucose of the salt-tolerant yeast Candida versatilis under stress conditions
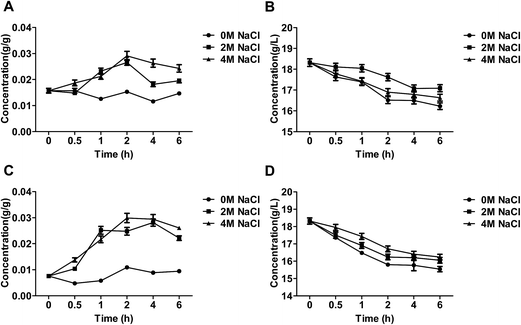
Glucose was transported by facilitated diffusion via carrier protein transporter in Candida versatilis.3 Extra-cellular glucose was absorbed and consumed by C. versatilis to maintain energy metabolism and central carbon metabolism (Fig. 2B and D). The level of intra-cellular glucose of C. versatilis after NaCl treatment was higher than that in cells treated without stressing agent (Fig. 2A and C). Our result also indicated that glucose was uptaked and utilized by S3–5 was higher as compare to WT (Table 1). The transient growth arrest following hyperosmotic shock further adds to redirecting almost all glycolytic flux from biomass towards glycerol production.21| Strains | NaCl (g L−1) | Dry cell mass (g L−1) | Glucose consumption rate (mg L−1 h−1) | Glycerol productivity (g L−1 h−1) | Ethanol productivity (g L−1 h−1) |
|---|---|---|---|---|---|
| WT | 0 | 3.84 | 3.49 | 0.28 | 11.40 |
| 90 | 3.02 | 2.05 | 1.42 | 9.08 | |
| 180 | 1.49 | 2.81 | 2.04 | 1.65 | |
| S3–5 | 0 | 4.46 | 4.63 | 0.59 | 11.75 |
| 90 | 3.20 | 3.77 | 2.26 | 9.21 | |
| 180 | 1.73 | 3.47 | 3.81 | 1.88 |
Prior research pointed out that three genes, SNF3, HXT1 and HXT2, encode three different glucose transporters, and the rate of sugar uptake in yeast cells is controlled by changes in affinity of the corresponding transporters as well as by an irreversible inactivation that affects their Vmax.22 But the mechanisms involved in glucose transport processes of Candida versatilis are unknown at present.
Glycerol accumulation of the salt-tolerant yeast Candida versatilis under stress conditions
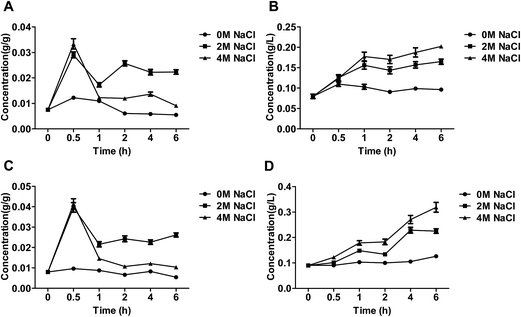
As shown in Fig. 3A and C, intra-cellular glycerol after treatment of NaCl was obviously more than control group, moreover, the intra-cellular glycerol by the treatment of 2 M NaCl was higher than that by 4 M NaCl. The similar phenomenon has also been observed.3 Salt stress was accompanied by an increase in the intracellular level of glycerol,23 which could decrease the intracellular water potential, restore water influx and consequently restore cell volume and turgor pressure.24 Osmoadaptation is robust to loss of individual adaptation pathways because of the existence and upregulation of alternative routes of glycerol accumulation.21 In yeasts, salt-tolerant yeast Debaryomyces hansenii and Saccharomyces cerevisiae, exposed to strong osmotic stress the intracellular glycerol concentration can reach molar levels.25Extra-cellular glycerol level of C. versatilis after treatment of NaCl was significantly higher than salt-free group, and extra-cellular glycerol increased with increasing salt concentration in the medium (Fig. 3B and D). The intra-, extra-cellular glycerol of S3–5 was higher than that of WT. The level of intra-cellular glycerol produced by S3–5 increased 17.2% than WT at 6 h, and extra-cellular glycerol level of S3–5 increased by 57.6% than WT at the same time.
There have two different types of active-transport systems for glycerol transport, Na+/glycerol and H+/glycerol symports,26 and glycerol of Candida versatilis transported by proton symport.3 The previous conclusion that the salt tolerance of S3–5 was higher than WT ascribed to the higher glycerol production, have verified by the experimental results.6
Ethanol accumulation of the salt-tolerant yeast Candida versatilis under stress conditions
The extra-cellular ethanol was affected by the level of salt (Fig. 4). At the beginning process, the level of ethanol was relatively lower under stress cultivated, which because intermediate of glucose metabolism was consumed to yield glycerol. The ethanol became increased until the yeast adapt to the salt stress. The level of ethanol produced by S3–5 increased at 2 h, while in that of WT elevated until 4 h.The results obtained by analysis of glucose, glycerol and ethanol showed that salt pressure contributes to rerouting glycolytic flux towards higher glycolysis and osmoadaptation prioritizes the redox and energy balance in glycolysis while rerouting flux from biomass to glycerol production.21
The glucose metabolic pathway and the stress response
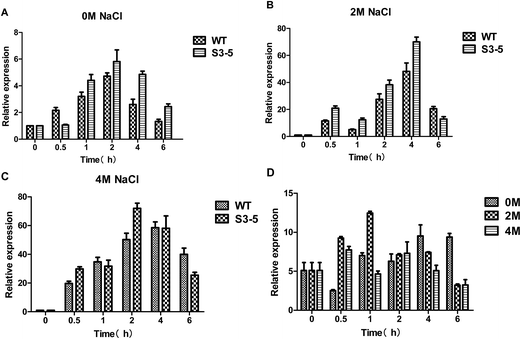
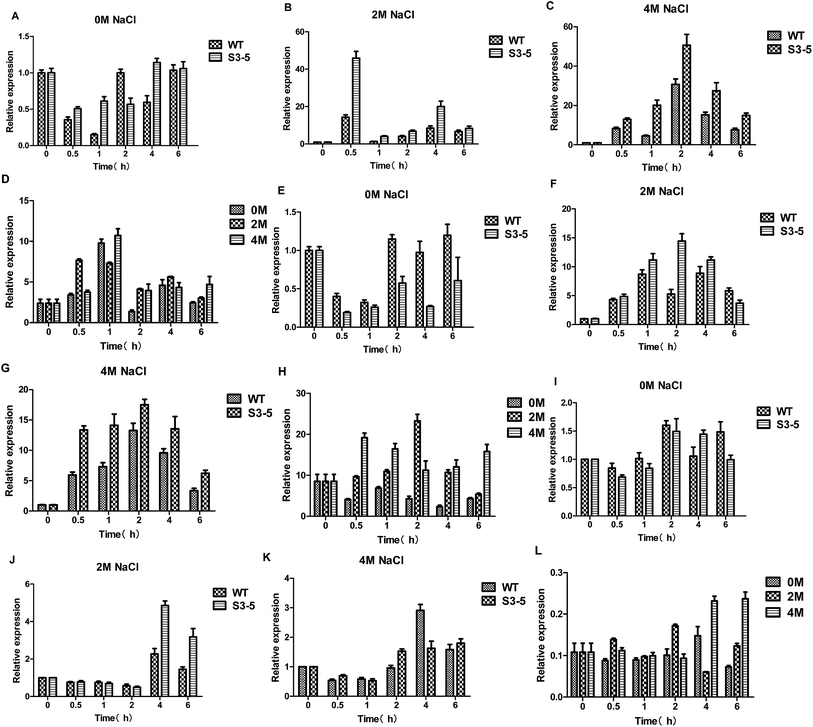
Glucose uptake occurs which is mediated by hexose transporters.27 The main pathway of yeast carbon metabolism is Embden–Meyerhof–Parnas pathway (EMP), in which glucose was catalyzed by hexokinase encoded by HXK1 gene (hexose transporter gene) to glucose-6-phosphate. The expression level of HXK1 gene increased with increasing salt concentration in the medium (Fig. 5A–C), the expression level of the HXK1 gene of S3–5 was higher than that of WT (Fig. 5D).The glycerol metabolic pathway and the stress response
Glycerol, as a primary osmoregulatory solute, is formed from the glycolytic intermediate dihydroxyacetone phosphate in two steps: firstly, dihydroxyacetone phosphate is reduced to glycerol-3-phosphate as catalysed by glycerol-3-phosphate dehydrogenase (GPD) encoded by the GPD1 gene (there is only one C. versatilis GPDH gene5), and glycerol-3-phosphate then yields glycerol. After a hyperosmotic challenge, intracellular glycerol levels are increased, as a combined result of the diminished efflux and the enhanced synthesis,17 an additional Hog1-independent mechanism retains intracellular glycerol for adaptation.The expression of the GPD1 gene (Fig. 6A–D) and HOG1 gene (Fig. 6E–H) were induced by NaCl. The expression levels of GPD1 gene increased rapidly after the initiation of stress treatment, similar to the expression pattern of HOG1. The previous research suggested that the response of yeast to osmotic stress is controlled by HOG pathway, whose important target gene is GPD1,5 and the transcription of GPD1 in C. versatilis cells was stimulated by high concentrations of NaCl.5 Moreover, the result was also observed by Silva-Graca that glycerol-3-phosphate dehydrogenase of Candida versatilis exhibited a very significant increase with increasing salt concentrations.4 Because rapid transcriptional response under osmotic stress is accompanied by a delay in phosphorylation and nuclear translocation of Hog1p,4,28 therefore, extra-glycerol begin to increase at 1 h. The transcription levels of the GPD1 and HOG1 gene of S3–5 were higher than that of WT which is the key reason that S3–5 has higher glycerol production and stronger tolerance to salt stress compare to WT.
Intra-cellular glycerol level are not only affected by yield but also regulated by transmembrane transport through the glycerol facilitator, Fps1p.29 Under hyperosmolarity condition, together with increased glycerol synthesis, yeast cells accumulate intracellular glycerol content via closing Fps1p. Its functions as a turgor valve during cell fusion.28,30 Hyperosmotic stress also leads to rapid closure of the glycerol facilitator Fps1 preventing glycerol outflow.21 Down-regulated expression of FPS1 gene was observed (Fig. 6I–L). The results showed that the expression of FPS1 gene of S3–5 was lower than WT, which might be leading to S3–5 has higher level of glycerol production.
The ethanol metabolic pathway and the stress response
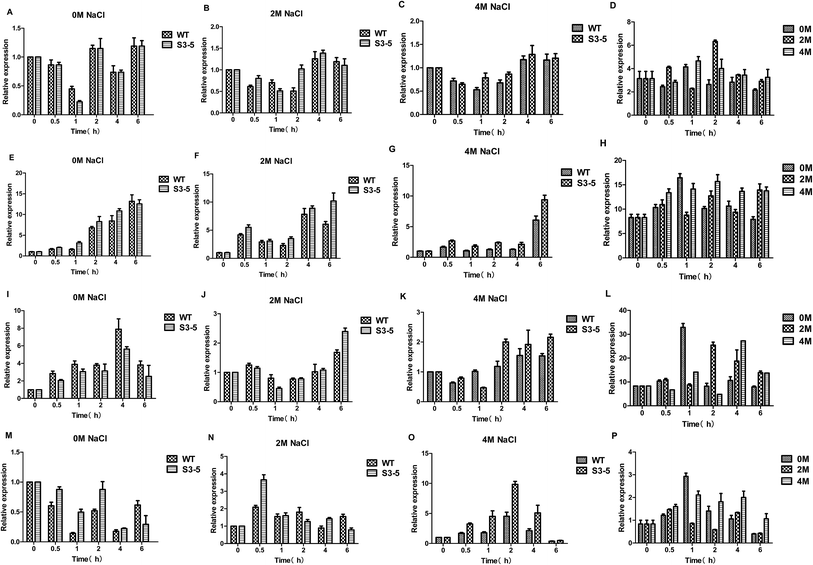
Ethanol is formed from the glycolytic intermediate glyceraldehyde-3-phos-phate in three steps: firstly, glyceraldehyde-3-phos-phate metabolize to pyrvic acid catalysed by pyruvate kinase (PYK) encoded by the PYK1 gene; then pyruvic acid reduced to aldehyde catalysed by pyruvate dehydrogenase complex (PDC) encoded by the PDC1 gene; thirdly, aldehyde reduced to ethanol catalysed by alcohol dehydrogenase (ADHs) encoded by the ADH gene, moreover, acetic acid formed from aldehyde catalysed by acetaldehyde dehydrogenase (ALD) encoded by the ALD6 gene. As for the ethanol production, several ADHs, including but not limited to ADH1, ADH2, ADH3, ADH4, ADH5, ADH6 and ADH7, catalyze the NAD(P)H dependent reduction of acetaldehyde to ethanol.31 Here, ADH1 was chosen the target gene to reveal the flux to ethanol when cultured on glucose.32The expression of PDC1 gene was down-regulated by the treatment of salt stress (Fig. 7A–D).25 On the other hand, the expression levels of PYK1 gene increased with increasing salt concentration (Fig. 7E–H). The expression levels of ADH1 gene decreased after NaCl treatment (Fig. 7I–L), the decreased ADH activity led to enhanced production of glycerol was observed in C. versatilis.31 While expression levels of ALD6 gene was up-regulated by the treatment of salt stress (Fig. 7M–P), which was consistent with the prior work that Ald6p, a protein related to acetate biosynthesis, is induced under conditions of high osmotic pressure.33 Moreover, ALD6 overexpression increases cell growth and ethanol production.34 Several studies pointed out that the activity of alcohol dehydrogenase decreases during high glycerol production under high osmotic pressure conditions, whereas the activity of aldehyde dehydrogenase (and probably acetate formation) increases, taking into account the demand of NADH for glycerol formation.33
Analysis of the data from PYK1, PDC1, ADH1 and ALD6 genes involved in ethanol metabolism of C. versatilis indicated that PDC1 and ADH1 genes were transcribed at low levels after salt stress, and PYK1 and ALD6 genes at high levels by the treatment of NaCl, which is in accordance with the extra-cellular ethanol detected previously.
Kinetic parameters of salt-tolerant yeast Candida versatilis expressing the carbon metabolism enzymes in response to salt stress were summarized in Table 1. For cell growth, final dry cell mass was decreased by 20% and 60% after 2 M and 4 M NaCl treatment as compare to control, respectively.
Glycerol productivity of S3–5 by the treatment of 2 M and 4 M NaCl were 59% and 86% higher than WT. During glucose fermentation, most of the metabolic flux goes to ethanol known as the Crabtree effect, our data showed that improved the concentration of stressing agent could reroute glycolytic flux towards glycerol metabolism.
Conclusions
Analysis of carbon metabolism and transcriptional variation in response to salt stress in the genome shuffled C. versatilis 3–5 and a wild-type salt tolerant yeast strain. The level of glucose consumption, glycerol and ethanol production was affected by salt. The expression level of HXK1 gene of S3–5 was higher than WT, which contributes to rerouting glycolytic flux towards higher glycolysis. Genome shuffling strains C. versatilis 3–5 with improving tolerance to salt might be caused by glycerol accumulation, as the genes involved in glycerol synthesis were found to be highly expressed under these stress conditions, such as up-regulated expression of GPD1 gene and HOG1 gene, and down-regulated expression of FPS1 gene.Acknowledgements
This work was supported by grants from National Natural Science Foundation of China (31501449, 2015IM102).References
- Y. Zhu and J. Tramper, Biotechnol. Adv., 2013, 31, 1448–1457 CrossRef CAS PubMed.
- C. van der Sluis, J. Tramper and R. H. Wijffels, Trends Food Sci. Technol., 2001, 12, 322–327 CrossRef.
- M. Silva-Garca and C. Lucas, FEMS Yeast Res., 2003, 3, 247–260 Search PubMed.
- M. Silva-Graca, L. Neves and U. Lucas, FEMS Yeast Res., 2003, 3, 347–362 CrossRef CAS PubMed.
- Y. Watanabe, K. Nagayama and Y. Tama, Yeast, 2008, 25, 107–116 CrossRef CAS PubMed.
- W. Qi, Z. C. Fan, C. L. Wang, L. H. Hou, X. H. Wang, J. F. Liu and X. H. Cao, Eur. Food Res. Technol., 2014, 238, 675–682 CrossRef CAS.
- A. Rodríguez-Navarro and B. Benito, Biochim. Biophys. Acta, Biomembr., 2010, 1798, 1841–1853 CrossRef PubMed.
- Y. Watanabe, M. Yamaguchi, J. Sakamoto and Y. Tamai, Yeast, 1993, 9, 213–220 CrossRef CAS PubMed.
- Y. Watanabe, H. Akita, Y. Higuchi, R. Tsujimatsu, T. Kaneta and Y. Tamai, Biosci., Biotechnol., Biochem., 2008, 72, 1005–1014 CrossRef CAS PubMed.
- L. Pribylova, J. de Montigny and H. Sychrova, Yeast, 2007, 24, 171–180 CrossRef CAS PubMed.
- M. Lenassi, J. Zajc, C. Gostincar, A. Gorjan, N. Gunde-Cimerman and A. Plemenitas, Fungal Biol., 2011, 115, 959–970 CrossRef CAS PubMed.
- H. B. Kwon, E. T. Yeo, S. E. Hahn, S. C. Bae, D. Y. Kim and M. O. Byun, FEMS Yeast Res., 2003, 3, 433–440 CrossRef CAS PubMed.
- D. Araiza-Olivera, J. G. Sampedro, A. Mujica, A. Pena and S. Uribe-Carvajal, FEMS Yeast Res., 2010, 10, 282–289 CrossRef CAS PubMed.
- T. C. Dakal, L. Solieri and P. Giudici, Int. J. Food Microbiol., 2014, 185, 140–157 CrossRef CAS PubMed.
- J. H. Parmar, S. Bhartiya and K. V. Venkatesh, Mol. BioSyst., 2011, 7, 1138–1148 RSC.
- S. Galafassi, M. Toscano, I. Vigentini, J. Piskur and C. Compagno, Food Microbiol., 2013, 36, 316–319 CrossRef CAS PubMed.
- L. Li, Y. Ye, L. Pan, Y. Zhu, S. Zheng and Y. Lin, Biochem. Biophys. Res. Commun., 2009, 387, 778–783 CrossRef CAS PubMed.
- X. Cao, L. Hou, M. Lu and C. Wang, Int. J. Food Sci. Technol., 2010, 45, 17–22 CrossRef CAS.
- F. Mo, H. Zhao, H. Lei and M. Zhao, Appl. Biochem. Biotechnol., 2013, 171, 1339–1350 CrossRef CAS PubMed.
- B. S. De Martinis and C. C. S. Martin, Forensic Sci. Int., 2002, 128, 115–119 CrossRef PubMed.
- E. Petelenz-Kurdziel, C. Kuehn, B. Nordlander, D. Klein, K. K. Hong, T. Jacobson, P. Dahl, J. Schaber, J. Nielsen, S. Hohmann and E. Klipp, PLoS Comput. Biol., 2013, 9, e1003084 CAS.
- R. Lagunas, FEMS Microbiol. Rev., 1993, 10, 229–242 CrossRef CAS PubMed.
- N. A. Abdel and E. l. Moghaz, Adv. Biomed. Res., 2010, 1, 169–176 Search PubMed.
- T. You, P. Ingram, M. D. Jacobsen, E. Cook, A. McDonagh, T. Thorne, M. D. Lenardon, A. P. de Moura, M. C. Romano, M. Thiel, M. Stumpf, N. A. Gow, K. Haynes, C. Grebogi, J. Stark and A. J. Brown, BMC Res. Notes, 2012, 5, 258 CrossRef CAS PubMed.
- M. J. Taherzadeh, L. Adler and G. Lidén, Enzyme Microb. Technol., 2002, 31, 53–66 CrossRef CAS.
- F. Lages, M. Silva-Graca and C. Lucas, Microbiology, 1999, 145, 2577–2585 CrossRef CAS PubMed.
- E. Vaudano, A. Costantini, O. Noti and E. Garcia-Moruno, Food Microbiol., 2010, 27, 802–808 CrossRef CAS PubMed.
- S. Hohmann, Microbiol. Mol. Biol. Rev., 2002, 66, 300–372 CrossRef CAS PubMed.
- X. M. Tang, G. Kayingo and B. A. Pior, Yeast, 2005, 22, 571–581 CrossRef CAS PubMed.
- J. Philips and I. Herskowitz, J. Cell Biol., 1997, 138, 961–974 CrossRef CAS PubMed.
- O. de Smidt, J. C. du Preez and J. Albertyn, FEMS Yeast Res., 2012, 12, 33–47 CrossRef CAS PubMed.
- J. Lian, T. Si, N. U. Nair and H. Zhao, Metab. Eng., 2014, 24, 139–149 CrossRef CAS PubMed.
- T. Hirasawa, K. Yamada, K. Nagahisa, T. N. Dinh, C. Furusawa, Y. Katakura, S. Shioya and H. Shimizu, Process Biochem., 2009, 44, 647–653 CrossRef CAS.
- S. E. Park, H. M. Koo, Y. K. Park, S. M. Park, J. C. Park, O. K. Lee, Y. C. Park and J. H. Seo, Bioresour. Technol., 2011, 102, 6033–6038 CrossRef CAS PubMed.
Footnote |
| † Electronic supplementary information (ESI) available. See DOI: 10.1039/c6ra25188a |
| This journal is © The Royal Society of Chemistry 2017 |

