 Open Access Article
Creative Commons Attribution 3.0 Unported Licence
Enhanced energy performance from core–shell structured Al@Fe2O3 nanothermite fabricated by atomic layer deposition
Lijun Qinab,
Ning Yanab,
Jianguo Lia,
Haixia Haob,
Fengqi Zhaob and
Hao Feng *ac
*ac
aLaboratory of Material Surface Engineering and Nanofabrication, Xi'an Modern Chemistry Research Institute, 168 E. Zhangba Road, Xi'an, Shaanxi 710065, China. E-mail: fenghao98@hotmail.com
bScience and Technology on Combustion and Explosion Laboratory, Xi'an Modern Chemistry Research Institute, 168 E. Zhangba Road, Xi'an, Shaanxi 710065, China
cState Key Laboratory of Fluorine and Nitrogen Chemicals, Xi'an Modern Chemistry Research Institute, 168 E. Zhangba Road, Xi'an, Shaanxi 710065, China
First published on 23rd January 2017
Abstract
The energy performances of nanothermite materials are dependent on the mass transport, diffusion distance, and interfacial contact area between the fuel and the oxidizer. In this work, we utilize an atomic layer deposition (ALD) technique to deposit Fe2O3 directly onto the surface of Al nanoparticles, producing a core–shell structured nanocomposite (Al@Fe2O3). Quartz crystal microbalance measurement and mass gain analysis reveal that the average Fe2O3 film growth rate is 0.12–0.13 nm per cycle. The thickness of the Fe2O3 layer deposited on the Al nanopowder can be precisely controlled by adjusting the number of ALD cycles. Structural characterization results demonstrate complete encapsulation of Al nanoparticles by conformal γ-Fe2O3 layers and confirm the formation of core–shell nanocomposites. The energy release and combustion properties of the nanothermites are investigated by differential scanning calorimetry and laser ignition tests. Compared to mechanically mixed Al–Fe2O3 nanopowders, the Al@Fe2O3 nanothermite has a lower onset temperature and a higher energy output. Besides, the thermite reaction of Al@Fe2O3 is several times faster than that of a mixture of Al–Fe2O3 nanopowders. The improved energy performance is mostly attributed to the uniform distribution of Al and Fe2O3 on the nanometer scale, which effectively reduces the diffusion distance and maximizes the interfacial contact area between the oxidizer and the fuel.
Introduction
Nanothermites, also known as superthermites or metastable intermolecular composites (MICs), are a class of energetic materials composed of nano-sized metal fuel (usually Al) and some oxidizer nanoparticles such as Fe2O3, CuO, MnO2, NiO, MoO3, PbO, etc.1,2 Compared to conventional thermite materials, nanothermites exhibit higher energy densities, faster energy release rates, shorter ignition times, and improved repeatability of response to ignition.3 Nanothermite materials have faster energy release rates mostly due to the improved mixing of reactants.4,5 In nanothermites, the fuel and the oxidizer make contact with each other in the nanometer scale, thus shortening the diffusion distance and increasing the interfacial contact area between the reactants, which in turn causes an increased burning rate.6–8 The improved energy performances make nanothermites more competitive in real-world applications such as additives to propellants and high explosives, free standing heat sources, power sources for micro electro-mechanical systems (MEMS), airbag ignition materials, hardware destruction devices, welding torches, etc.9,10Many methods, including physical mixing,11–14 sol–gel processing,15–17 self-assembly etc.,18–23 have been introduced to synthesize nanothermites. Each method has its own merits and limitations.3 Theoretical studies have revealed that orderly arranged composition can result in maximum interfacial contact area between the fuel and the oxidizer, and hence provide a higher rate of energy release.19 One attractive method to obtain intimate fuel-oxidizer contact is to deposit the oxidizer directly onto nanometer-sized fuel particles. In this approach, the uniformity of the deposited oxidizer film is the key to maximize the fuel-oxidizer contact. Among established deposition methods, atomic layer deposition (ALD) is an ideal process to deposit ultrathin films with high uniformity and digital thickness control.24–26 In ALD, reactants (precursors) are sequentially pulsed to the substrate and film growth is achieved through self-limiting surface reactions. By alternately exposing the substrate to the metal source and the oxygen source, metal oxide films can be grown layer by layer.27,28 So far ALD has been utilized to deposit many metal oxides that can be used for thermite reactions, including Fe2O3,29,30 NiO,31 WO3,32 Co3O4,33 MnO2 (ref. 34) and SnO2.35 Ferguson et al.36 first employed ALD to deposit SnO2 coatings on nanoparticles of Al. However, due to insufficient reactant exposures, the ALD surface reaction was not saturated, leading to limited film growth and large deviations from the expected oxidizer to fuel (O/F) ratio. By optimizing ALD experiment conditions,37 we successfully prepared core–shell structured Al@SnO2 nanothermites by ALD. With the proper O/F ratio, the reaction rate of the ALD Al@SnO2 nanothermite is several times faster than the mixture of nanopowders. These explorations validate the feasibility of synthesizing nanothermites by ALD and demonstrate the advantages of core–shell structured nanothermite materials.
Among thermite materials, the Al/Fe2O3 system has attracted special attention since it has many unique properties including a high adiabatic temperature (T = 3135 K), a high reaction heat (ΔH = 952 cal g−1), and an energy density of 3.9 kcal cm−3, that is, about 4 times as high as that of 2,4,6-trinitrotoluene (TNT, 1.0 kcal cm−3).3,20 Many methods, including hydrothermal synthesis combined with ultrasonic mixing,38 sputtering,23 and even biologically inspired approaches,39 have been developed to synthesize Al/Fe2O3 nanothermites. To the best of our knowledge, there is no report on the preparation of Al/Fe2O3 nanothermite by ALD, which is a very straightforward method capable of producing core–shell nanocomposites with atomic level precision and excellent reproducibility. In this work we report the method of precisely synthesizing Al-core Fe2O3-shell nanothermites (Al@Fe2O3) by ALD. Structures of the Al@Fe2O3 nanothermites are tailored by adjusting the number of ALD cycle. The optimized O/F is obtained and a significant improvement in overall reaction kinetics and energy output is achieved.
Experimental
Materials
The Al nanopowder was supplied by Jiaozuo Banlu Nanomaterial Engineering CO., Henan, China. The measured specific surface area of this type of Al nanopowder is 15.4 m2 g−1, which corresponds to spherical Al particles with an average diameter of 130 nm. Ferrocene (FeCp2, 98%, Alfa Aesar) and oxygen (O2, 99.99%, Xi'an Weiguang Gas Co., China) were used as the precursors for Fe2O3 ALD. Anodic aluminum oxide (AAO) membranes (60 μm thick, 220 nm pores, Whatman Filters) were used as probe samples during Fe2O3 ALD to measure the average Fe2O3 film growth rate on a porous substrate. Fe2O3 nanopowder (99.9%, d = 50 nm, Alfa Aesar) was mechanically mixed with the Al nanopowder at an O/F of 2.1 (by mass) to make a reference sample for energy release and combustion property tests.ALD synthesis
ALD experiments were carried out with a homemade viscous flow reactor based on the design of Elam and George.40 The ALD reactor was a 2-in OD stainless steel tube heated on the wall by electronic heating tapes. The Al nanopowder (100–300 mg) was held in a shallow copper container covered by stainless steel mesh. The container was inserted into the middle of the reaction chamber. ALD reaction of Fe2O3 was carried out at 350 °C and 1.0 torr with ultra-pure nitrogen (99.999%, Xi'an Weiguang Gas Co., China) continuously purged through the reactor at a flow rate of 120 sccm. The ferrocene container was kept at 90 °C during the ALD experiment. A stream of N2 was pushed through the ferrocene container to carry the precursor vapor to the ALD reactor. The partial pressure of oxygen was controlled at nearly 0.30 torr by keeping the oxygen flow rate at 30 sccm. The ALD process of Fe2O3 includes four consecutive steps: FeCp2 dose, N2 purge, O2 dose, and N2 purge again. These four steps were carried out in a pulse sequence denoted as t1-t2-t3-t4 where “tx” (x = 1 to 4) represents the duration of each step. In this research the optimized ALD pulse sequence for synthesizing the nanothermite was 90-90-90-90 s. The number of ALD cycle employed was determined by the desired O/F of the thermite material. After the ALD experiments the samples were removed from the ALD reactor and were kept in an exsiccator. The masses of the samples were measured after they were cooled down to room temperature. For convenience, in this paper the core–shell structured nanothermites synthesized by ALD are denoted as Al@Fe2O3 while the reference sample prepared by mechanical mixing of the nanopowders is expressed as Al–Fe2O3. For example, “175 cycle Al@Fe2O3” represents the nanothermite sample synthesized by depositing 175 ALD cycles of Fe2O3 on the Al nanopowder.Characterization
Quartz crystal microbalance (QCM) studies were performed during the Fe2O3 film deposition using an Inficon bakeable crystal sensor, 6 MHz goldcoated sensor crystals, and an Inficon Q-pod film thickness monitor. QCM data were recorded at 125 ms intervals. Surface areas of the nanopowders were determined by N2 physisorption using a Micromeritics ASAP 2020 instrument. The samples were degassed at 250 °C for 10 h prior to adsorption experiments. Surface compositions of the nanothermites were measured by a Thermo Fisher K-Alpha X-ray photoelectron spectrometer (XPS) using monochromatized Al Kα radiation (1486.6 eV). Samples were analyzed in a UHV chamber under 10−10 torr. Crystal structures of the nanothermites were measured with a Rigaku D/Max 2400 X-ray diffractometer (XRD) using Cu Kα radiation. Morphologies and structures of the nanothermites were characterized by an FEI Quanta 600 field emission scanning electron microscope (FESEM) and an FEI Tecnai G2 F20 high-resolution transmission electron microscope (HRTEM). Spatial distributions of different elements in the nanothermite sample were measured with a ZEISS Merlin Compact FESEM equipped with energy-dispersive X-ray spectrometer (EDS). Thermal properties of the nanothermites were analyzed by performing differential scanning calorimetry (DSC) using a NETZSCH 204 DSC instrument. During DSC measurements the temperature was varied from 50 to 1200 °C with a heating rate of 10 °C min−1 under Ar flow. Initiation and combustion properties of the nanothermites were measured with a homemade laser ignition device described in ref. 37. CO2 laser with an output wavelength of 10.6 μm (GSI SLC110N) and a power of 30 W was used as the ignition source. In each experiment the powder sample (∼0.03 mL) was packed in a micro ceramic crucible and the laser beam was brought to the sample surface in the perpendicular direction to ignite the sample. Light signals from sample burning were captured by optical devices and were recorded on a digital oscilloscope. Combustion processes were also recorded by a digital video camera at 30 fps.Results and discussion
ALD of Fe2O3 on Al nanopowder
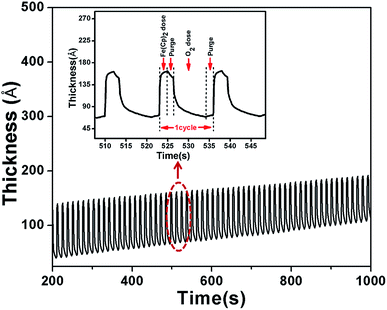
Previous reports of Fe2O3 formation via ALD include sequential exposures to iron(III) tert-butoxide (Fe2(OtBu)6) and water,41 tris-(2,2,6,6-tetramethyl-3,5-heptanedionate) iron(III) (Fe(thd)3) and ozone(O3),42,43 iron bisamidinate and water,44 iron(III) chloride and water,30,45 and ferrocene (Fe(Cp)2) pulsed alternately with ozone(O3)46,47 or molecular oxygen (O2).29,48,49 Among these precursor combinations, the most ubiquitous recipe currently used for depositing iron oxide by ALD involves the use of Fe(Cp)2 and oxygen. As an ALD precursor Fe(Cp)2 is attractive as it is commercially available, remarkably inexpensive, and has high thermal stability (above 500 °C) in the gas phase. In the temperature range of 350–500 °C the reported Fe2O3 film growth rate is 0.06–0.14 nm per cycle on flat or porous substrates.29,48 In this work Fe(Cp)2 and O2 are used as precursors for Fe2O3 ALD. ALD reactions were carried out at 350 °C because this temperature has been proved to be mild enough for processing thermite materials.QCM measurements were performed to study the Fe2O3 film deposition process and to measure the film growth rate during ALD experiments. Fig. 1 presents a film thickness versus time plot obtained by QCM during a typical Fe2O3 ALD experiment with a pulse sequence of 2-2-7-2 s. The film thickness is calculated based on the mass gain measured by QCM and a density of 5.24 g cm−3 is used to convert the mass of Fe2O3 to film thickness. From the QCM data for one complete Fe2O3 ALD cycle, an abrupt increase in the film thickness can be observed immediately after dosing Fe(Cp)2. The initial increase in film thickness is extremely large (∼9 nm), which suggests that multi-layer adsorption (both chemical and physical) must occur during the Fe(Cp)2 pulse. Following the steep increase the mass uptake gradually slows down and the corresponding film thickness becomes stable, indicating that surface adsorption has reached completion. The subsequent N2 purge removes some of the physically adsorbed Fe(Cp)2 molecules. However it appears that the N2 purge is not very sufficient for removing physisorbed precursors in that the mass curve goes down slowly during the purge period. As the pulse of O2 is switched on the film thickness decreases rapidly. During this reaction step the chemisorped *–Fe-Cp species is oxidized to iron oxide and CO2 by molecular oxygen.49 The large mass decrease during the O2 pulse implies that O2 not only converts chemisorped precursors to oxides but also facilitates desorption of physically adsorbed Fe(Cp)2 molecules from the surface. The mass curve becomes almost flat at the end of the O2 pulse. After one complete ALD cycle the net mass increase is quite small compared to the large initial mass uptake at the beginning of the Fe(Cp)2 pulse. This film growth pattern remains stable for hundreds of ALD cycles and the average film growth rate is 0.12 nm per cycle. This value is comparable to previously reported ALD Fe2O3 film growth rates using Fe(Cp)2 and O2 as precursors.29,48
One important premise of an ALD process is the self-limited (or saturated) surface reaction. The saturated surface reaction ensures the layer by layer film growth pattern and thus guarantees excellent uniformity of the coating in a porous system. The reaction time required to achieve saturation of the surface reaction in a high surface area support is much longer than that on a flat substrate. To explore the saturation conditions of Fe2O3 ALD on the Al nanopowder, a series of experiments with pulse sequences of x-x-x-x seconds were carried out, in which x was varied from 20 to 120 s. Fig. 2a presents the mass gain on the Al nanopowder with different precursor dosing times after 20 cycles of Fe2O3 ALD. As the precursor dosing time is increased from 20 to 90 s, the mass gain percentage increases from 4.5 to 17. As the precursor dosing time is further increased to 120 s, the sample mass gain remains almost constant, indicating that all reactive sites are almost saturated with a precursor exposure of 90 s. Finally a pulse sequence of 90-90-90-90 s was determined for applying Fe2O3 ALD on the Al nanopowder.
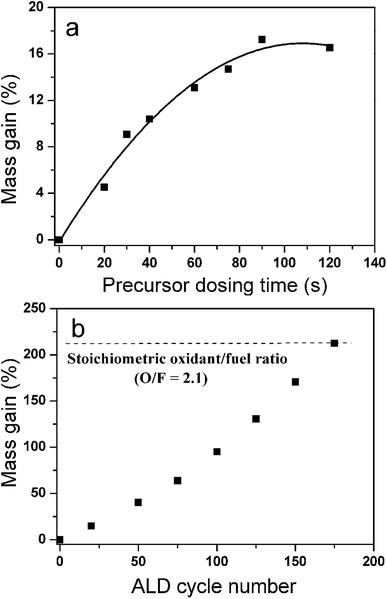 | ||
| Fig. 2 (a) Saturation curve of Fe2O3 ALD on Al nanopowder; (b) mass change of Al nanopowder during Fe2O3 ALD. | ||
Previous TEM studies show that a 3–4 nm thick alumina passivation layer exists on the surfaces of Al nanoparticles, therefore active Al metal accounts for nearly 70 wt% of the Al nanopowder.37 In the thermite reaction between Al and Fe2O3, the stoichiometric molar ratio of Fe2O3 to Al is 0.5. Since ∼70 wt% of the Al powder is active, the optimal mass ratio of the deposited Fe2O3 to Al should be ∼2.1. Therefore Fe2O3 film was continuously deposited on the Al nanopowder with a pulse sequence of 90-90-90-90 s until a relative mass increase of 210% was reached. During ALD experiments weight measurements were taken after every 25 cycles of film deposition. Fig. 2b displays the sample mass gain data versus the number of ALD cycle performed. The constantly increased slope of the mass gain curve suggests that the total surface area of the powder increases as a result of the gradually enlarged particle size. According to the mass gain curve, the optimal O/F can be reached by performing ∼175 cycles of Fe2O3 ALD.
QCM measurements can provide the average Fe2O3 film growth rate on a flat substrate (the quartz crystal). However, the Fe2O3 film growth on a porous substrate may be different from that on a flat one. Therefore we also use AAO as probe samples to estimate the Fe2O3 film growth rate on the Al nanopowder. The AAO probe samples are 60 microns thick membranes with 220 nm regular pores. The measured surface area of the AAO is 5.8 m2 g−1. The AAO probe samples and the Al nanopowder were placed together in the reactor during ALD experiments. Since the AAO has a smaller surface area and lower diffusion resistance than the Al nanopowder bed, under the optimized film growth conditions the surface reaction should be saturated on both the Al nanopowder and the AAO probe sample. After the ALD experiment the mass change of the AAO membrane was measured with an analytical balance. The average thickness of the Fe2O3 film (h) deposited on the AAO can be calculated from the following equations:
 | (1) |
 | (2) |
In above equations, m0 and Δm represent the original mass of the AAO and the mass increase after ALD; D0 and D1 are the average diameters of the AAO pores before and after the film deposition; ρ is the density of the ALD film; and S is the specific surface area of AAO.50 The masses of the AAO probe samples increased by 46% and 62% after performing 125 and 175 cycles of Fe2O3 ALD. Based on mass gains of the probe samples, the average film growth rate on the porous AAO substrate is 0.13 nm per cycle. This film growth rate is very close to the Fe2O3 film growth rate measured with QCM.
Chemical and morphological characterization
Surface compositions of the as-prepared ALD nanothermites are measured by XPS. Fig. 3 presents the XPS spectra of the Al nanopowder coated with 175 cycle ALD Fe2O3 film. In the survey scan spectrum (Fig. 3a), the only detectable surface elements on 175 cy Al@Fe2O3 are Fe, O and C. The C signal is chemically similar to typical surface contamination. Compared to the XPS spectrum of the Al nanopowder, Al signals from the original surface completely disappear and Fe signals from the ALD Fe2O3 surface coating arise, indicating perfect coverage of the Al nanopowder by the ALD Fe2O3 film. Fig. 3b exhibits the XPS spectra in Fe2p region. The maximum Fe2p3 peak is observed at 710.8 eV and a satellite peak is visible at 718.8 eV. Comparing these peak positions as well as the overall shape of the spectrum with those reported in literature, e.g. in ref. 45 and 51, it can be concluded that the iron species in the ALD coating is mainly in the Fe3+ state.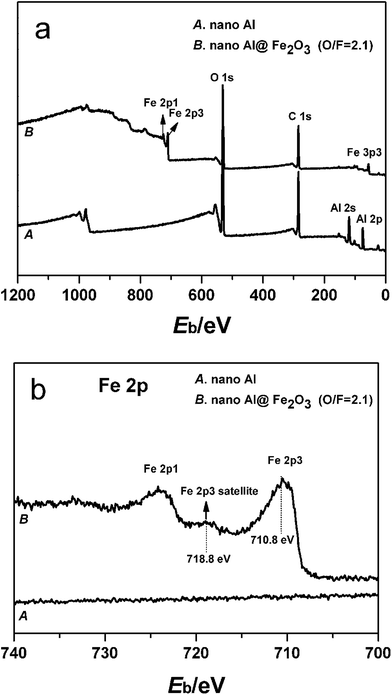 | ||
| Fig. 3 XPS spectra of the unmodified Al nanopowder and the nanopowder fabricated by 175 cycles of Fe2O3 ALD: (a) survey scans; (b) Fe2p scans. | ||
XRD measurements are made to characterize the crystal structure of the ALD Fe2O3 film. Fig. 4 displays XRD patterns of the original Al nanopowder, the commercial γ-Fe2O3 nanopowder, and the 175 cycle Al@Fe2O3 nanothermite sample. Diffraction patterns of the pure substances used in this research match well with the standard diffraction data for Al (PDF card 04-0787) and γ-Fe2O3 (PDF card 39-1346). Both sets of peaks corresponding to Al and γ-Fe2O3 are observed on the Al@Fe2O3 nanothermite sample, indicating that the crystal structure of the ALD Fe2O3 film deposited on the Al nanopowder is actually γ-Fe2O3. On the Al@Fe2O3 nanothermite sample broadening of the peaks corresponding to γ-Fe2O3 can be observed, which implies that the ALD Fe2O3 layer contains small crystallites of γ-Fe2O3. High-resolution TEM studies also provide evidences of γ-Fe2O3 nanocrystals in the ALD Fe2O3 layer; those results will be presented later.
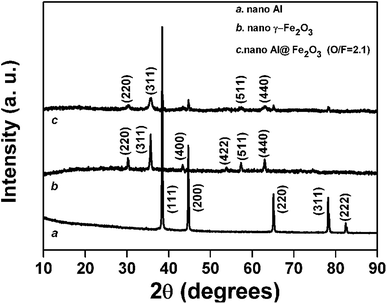 | ||
| Fig. 4 XRD patterns of the Al nanopowder, the commercial γ-Fe2O3 nanopowder, and the Al nanopowder fabricated by 175 cycles of Fe2O3 ALD. | ||
Structures and morphologies of the ALD Fe2O3 coated Al nanoparticles are studied by SEM. Fig. 5 presents SEM images of the original Al nanopowder (Fig. 5a) and the Al nanopowder fabricated by 175 cycles of Fe2O3 ALD (Fig. 5b). The average size of the nanoparticles considerably increases after ALD, which is apparently due to the Fe2O3 layer deposited on the surfaces of the Al nanoparticles. The ALD Fe2O3 film has a rough texture, which implies that the film may be composed of tiny grains of nanocrystals. The unique surface morphology of the ALD Fe2O3 layer makes it easily distinguishable from the smooth surfaces of Al nanoparticles. By comparing the SEM images of the Al nanopowder before and after Fe2O3 ALD (Fig. 5a and b) it can be confirmed that all surfaces of Al nanoparticles are covered by a continuous layer of Fe2O3, which is responsible for disappearances of Al signals in the XPS spectrum.
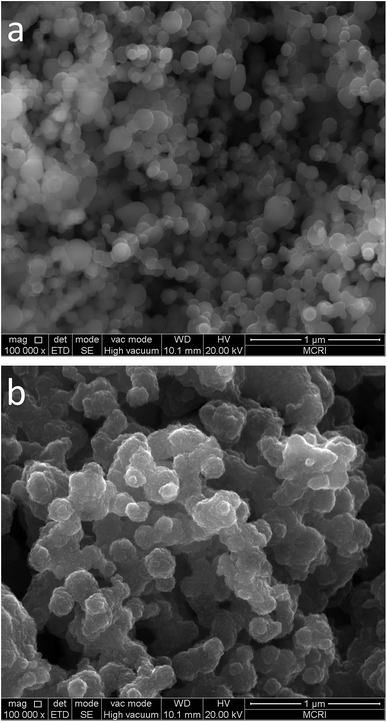 | ||
| Fig. 5 SEM images of the unmodified Al nanopowder (a) and the Al nanopowder coated with 175 cycles of ALD Fe2O3 (b). | ||
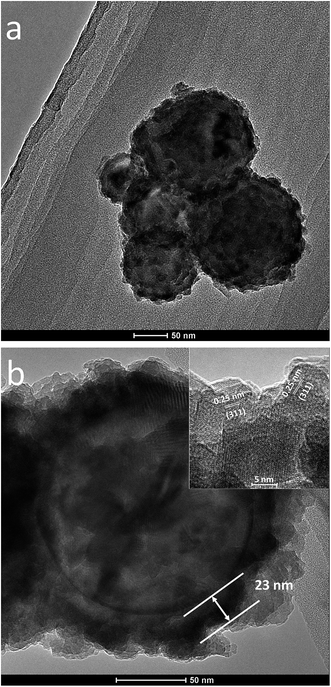
Fig. 6 displays representative TEM micrographs of the 175 cycle Al@Fe2O3 nanothermite sample. A bumpy but continuous layer of Fe2O3 is observed on each individual nanoparticle (Fig. 6a). Despite the presence of the Fe2O3 surface layer, the globular shapes of the Al nanoparticles are maintained, which implies that the thickness of the ALD Fe2O3 layer is mostly conformal. From the magnified image of a single nanoparticle (Fig. 6b) it can be clearly observed that the nanoparticle has an Al core and a Fe2O3 shell. The edge of the Fe2O3 layer is quite rough, which makes is difficult to precisely measure the film thickness. Ignoring the irregular structures on the outmost surface of the oxide layer, the Fe2O3 film thickness is estimated to be 23 nm. This film thickness corresponds to an average film growth rate of 0.13 nm per cycle, which is in excellent agreement with the film growth rate measured with QCM or on AAO probe samples. High resolution TEM characterizations reveal that the bumpy appearance of the ALD Fe2O3 layer is due to existences of closely packed Fe2O3 nanocrystals. The inset of Fig. 6b shows the lattice fringes of Fe2O3 nanocrystals on the shell layer of the nanoparticle. An interplanar distance of 0.25 nm, which corresponds to the lattice spacing of γ-Fe2O3 (311) crystal plane, can be clearly identified.52
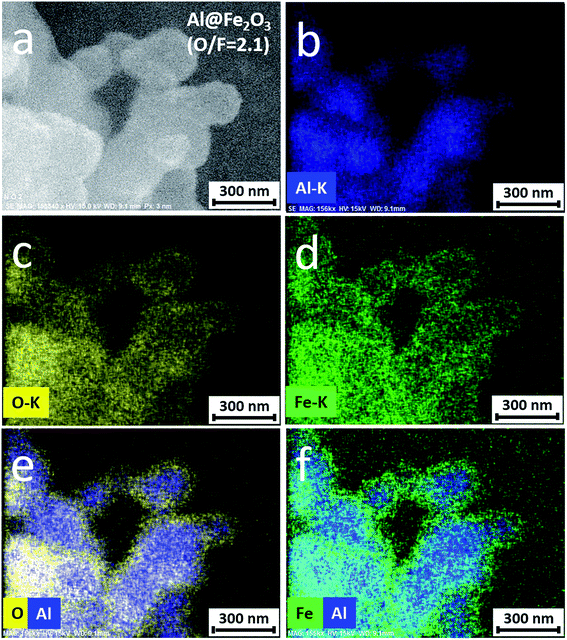
EDS mapping technique is used to measure the spatial distributions of Al, Fe, and O elements in the nanothermite. Fig. 7a is a typical SEM micrograph of the 175 cycle Al@Fe2O3 nanothermite sample. Fig. 7b–d show the distributions of Al, O, and Fe elements in the nanothermite sample. The signal patterns of Fe and O are identical in these images. Fig. 7d and e exhibit superimposed distributions of O and Al, and Fe and O elements, respectively. All particles exhibit core–shell configurations in which the Al nanoparticles are surrounded by an almost conformal layer of iron oxide. From these images it can be re-confirmed that each individual Al nanoparticle is encapsulated by a uniform layer of Fe2O3 and that an Al-core Fe2O3-shell nanocomposite is formed. This core–shell configuration ensures uniform distribution of Al and Fe2O3 on the nanometer scale and maximizes the interfacial contact area between the oxidizer and the fuel.
From above SEM and TEM images some degree of nanoparticle interconnection can be observed. Too much interconnection of particles may cause aggregation of the powder, which will lead to loss of the surface area and inhomogeneous distribution of the oxidizer and the fuel. Particle interconnection is almost inevitable in the process of coating nanopowders with a fixed bed ALD reactor. Normally, the degree of particle interconnection is related to the thickness of the ALD coating with respect to the diameter of the nanoparticle substrate. The degree of particle aggregation can be evaluated by analyzing the change in surface area before and after the film deposition. Herein the surface areas of a few samples at different stages of Fe2O3 ALD are measured by physisorption and the results are as follows: the original Al nanopowder has a specific surface area of 15.4 m2 g−1; the 125 cycle Al@Fe2O3 (with a mass gain of 130%) has a specific surface area of 7.71 m2 g−1; and the 175 cycle Al@Fe2O3 (with a mass gain of 210%) has a specific surface area of 6.52 m2 g−1. The total surface area of the powder is increased by ∼15% after 125 cycles of Fe2O3 ALD; and it is further increased by ∼30% after 175 cycles of Fe2O3 ALD. The successively enlarged surface area of the powder is also reflected by the gradually increasing slope of the mass gain curve as ALD Fe2O3 film is continuously deposited on the Al nanopowder (Fig. 2b). Assuming that all Al nanoparticles have an equal starting diameter of 130 nm and that the Fe2O3 film deposition rate is 0.13 nm per cycle, after 125 and 175 cycles of Fe2O3 ALD the total surface area of the powder should be increased by 56% and 83%, respectively, if no particle interconnection occurs. These expected values are higher than the actual surface areas of the ALD Fe2O3 coated powders due to interconnection of nanoparticles; however, the differences are not that large. That is, the degree of the particle aggregation is not very significant after Fe2O3 ALD. Therefore the homogeneity of fuel-oxidizer mixing is not too much affected by interconnection of nanoparticles during ALD.
Energy release and combustion property tests
To evaluate the energy releases of the nanothermite samples, we characterized the heating processes of the nanothermites in the temperature range from 50 to 1200 °C with DSC, and the results are shown in Fig. 8. The DSC results indicate that the thermal behaviors of nanothermites are markedly different from that of the Al nanopowder. As shown in Fig. 8, the broadened exothermic peak before the melting point of Al (660 °C) is ascribed to the thermite reaction between Fe2O3 and Al.23 Comparing the onset temperatures and positions of the exothermic peaks of the Al–Fe2O3 nanopowder mixture (530 and 598 °C) and the Al@Fe2O3 nanocomposite (430 and 528 °C), the thermite reaction of Al@Fe2O3 occurs at a much lower temperature. By integrating the exothermic peaks, it can be estimated that the amount of energy released during the thermite reaction of Al@Fe2O3 is ∼30% more than that of Al–Fe2O3. These results suggest that the Al@Fe2O3 nanothermite has a better energy performance (lower onset temperature and more energy release) than the physically mixed Al–Fe2O3. The lower onset temperature is probably related to the unique core–shell nanostructure of Al@Fe2O3. In a nanothermite system, the thermite reaction occurs once the Al2O3 shell encapsulating the Al metal is broken so that the active Al metal has the chance to react with the oxidizer. Upon heating, the different thermal expansions of Fe2O3 and Al2O3 layers may cause extra tensile stress on the surface of the nanoparticle, thus facilitating destruction of the oxide shell and initiating the thermite reaction at a lower temperature. Additionally, the shorter average distance between the fuel and the oxidizer may also contribute to the lower onset temperature of the Al@Fe2O3 nanothermite. At a fixed O/F ratio the amount of energy released in the thermite reaction is related to the efficiency or completeness of the reaction. The core–shell nanostructure effectively enhances uniform mixing of solid reactants and greatly reduces the fuel-oxidizer distance, consequently completeness of the thermite reaction is improved and energy release is promoted.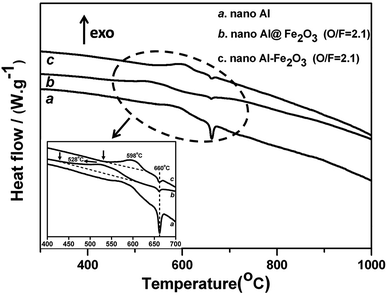 | ||
| Fig. 8 DSC curves of the Al nanopowder, the 175 cycle Al@Fe2O3 nanothermite, and the Al–Fe2O3 nanopowder mixture with an O/F of 2.1. | ||
Initiation and combustion properties of the nanothermites are studied by laser ignition technique. Table 1 summarizes the results of ignition delays and durations of the thermite reactions obtained from laser ignition experiments. Fig. 9 displays selected video frames recorded during ignition and burning of the Al nanopowder (Fig. 9a), 125 cycle and 175 cycle Al@Fe2O3 nanothermites (Fig. 9b and c), and a mixture of Al and Fe2O3 nanopowders with an O/F of 2.1 (Fig. 9d). Ignition delay refers to the time required to initiate the reaction after introducing the laser power. Due to existences of the Fe2O3 shell layers, ignition delays of the nanothermite samples are slightly prolonged. The increase in the ignition delay is dependent on the thickness of the Fe2O3 shell layer, which implies that the energy release patterns of energetic nanomaterials may be tuned by applying ALD coatings on the phase interface.53 Combustion of the Al nanopowder is quiet and slow (Fig. 9a). The energy release is limited by the diffusion and reaction with atmospheric oxygen.39 In contrast, reactions of Al/Fe2O3 thermite materials (Fig. 9b–d) are much faster and more violent. Glaring flashes and erupting sparkles are produced during the reaction. The rate of a thermite reaction is dependent on both the structure of the thermite material and the O/F ratio. When the O/F ratio is lower than the stoichiometric ratio of the thermite reaction, Al metal would react with both the Fe2O3 shell and oxygen in the air, and the reaction time would be extended. Among thermite samples the 175 cycle Al@Fe2O3 nanothermite has the highest reaction rate. With the optimal O/F ratio reaction of the 175 cycle Al@Fe2O3 is three times as fast as that of the Al–Fe2O3 nanopowder mixture. Furthermore, from Fig. 9c it can be noticed that the flame in the first video frame (t = 0.03 s) is much brighter than other video frames, which indicates that most of the energy is actually released in a very limited time. The enhanced reaction rate is attributed to the exquisite core–shell nanostructure as well as the conformity of the oxidizer layer: the core–shell nanostructure maximizes the interfacial contact area between the oxidizer and the fuel and effectively reduces the fuel-oxidizer distance; while the conformal oxidizer shell layer ensures most uniform mixing of the reactants down to the nanometer scale.
| Sample | O/F mass ratio | Ignition delay (ms) | Combustion time (ms) |
|---|---|---|---|
| Al nanopowder | NA | 30 | >2000 |
| 125 cycle Al@Fe2O3 | 1.3 | 32 | 180 |
| 175 cycle Al@Fe2O3 | 2.1 | 34 | 68 |
| Al–Fe2O3 mixture | 2.1 | 33 | 222 |
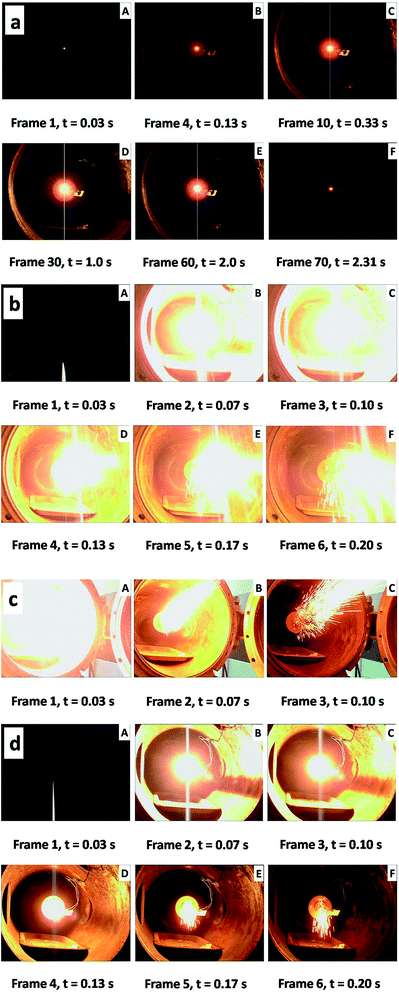 | ||
| Fig. 9 Video frames obtained from laser ignition experiment on: (a) Al nanopowder; (b) 125 cycle Al@Fe2O3; (c) 175 cycle Al@Fe2O3 and (d) Al–Fe2O3 nanopowder mixture. | ||
Previously we have synthesized core–shell structured Al@SnO2 nanothermite using the same ALD technique.37 Laser ignition tests show that for either mixed nanopowders or core–shell structured nanothermites durations of the thermite reactions between Al and Fe2O3 are longer than those between Al and SnO2 (222 vs. 106 ms for nanopowder mixtures and 68 vs. 19 ms for core–shell structured nanothermite). This is probably related to the different melting temperatures of the two oxides. The melting temperature of SnO2 (1127 °C) is much lower than that of Fe2O3 (1565 °C). As a consequence, for the Al–SnO2 system the reaction mixture is easier to be liquefied during the thermite reaction, which will greatly facilitate mass diffusions of reactants and significantly increase the reaction rate. Comparing the Al–Fe2O3 and Al–SnO2 thermite systems, although the Al–SnO2 system has a faster energy release rate, the total amount of energy released in the thermite reaction between Al and Fe2O3 (945.4 cal g−1) is much higher than that of the Al–SnO2 system (686.8 cal g−1). Besides, the ALD film growth rate of Fe2O3 is 4 times faster than that of SnO2; and the ALD process of Fe2O3 does not involve dealing with corrosive reactants/products. These advantages make ALD Al@Fe2O3 an attractive nanothermite material other than ALD Al@SnO2.
Conclusion
Core–shell structured Al@Fe2O3 nanothermites are successfully synthesized by atomic layer deposition through alternately exposing ferrocene and oxygen to a commercial Al nanopowder at 350 °C. As revealed by various characterization techniques, Al nanoparticles are completely encapsulated by conformal layers of γ-Fe2O3. The average film growth rate of ALD Fe2O3 on the Al nanoparticles is 0.12–0.13 nm per cycle. The thickness of the Fe2O3 layer can be precisely controlled by adjusting the number of ALD cycle. By fabricating the core–shell structured nanocomposite, a uniform distribution of Al and Fe2O3 on the nanometer scale is achieved, which effectively reduces the diffusion distance and enhances the interfacial contact area between the oxidizer and the fuel. These core–shell structured nanothermites have demonstrated significantly improved energy performances: compared to a mixture of Al and Fe2O3 nanopowders, the Al@Fe2O3 nanothermite has a lower onset temperature and a higher energy output; besides, the thermite reaction of Al@Fe2O3 is several times faster than the Al–Fe2O3 nanopowder mixture.Acknowledgements
This work is financially supported by Technology Foundation for Selected Overseas Chinese Scholars provided by Ministry of Personnel of the People's Republic of China and by the national youth talent support program of China.References
- E. L. Dreizin, Prog. Energy Combust. Sci., 2009, 35, 141–167 CrossRef CAS.
- X. Zhou, M. Torabi, J. Lu, R. Shen and K. L. Zhang, ACS Appl. Mater. Interfaces, 2014, 6, 3058–3074 CAS.
- C. Rossi, K. Zhang, D. Esteve, P. Alphonse, P. Taihades and C. Vahlas, J. Microelectromech. Syst., 2007, 16, 919–931 CrossRef CAS.
- M. E. Brown, S. J. Taylor and M. J. Tribelhorn, Propellants, Explos., Pyrotech., 1998, 23, 320–327 CrossRef CAS.
- L. L. Wang, Z. A. Munir and Y. M. Maximov, J. Mater. Sci., 1993, 28, 3693–3708 CrossRef CAS.
- C. Farley and M. Pantoya, J. Therm. Anal. Calorim., 2010, 102, 609–613 CrossRef CAS.
- M. L. Pantoya and J. J. Granier, J. Therm. Anal. Calorim., 2006, 85, 37–43 CrossRef CAS.
- J. Sun, M. L. Pantoya and S. L. Simon, Thermochim. Acta, 2006, 444, 117–127 CrossRef CAS.
- P. Britoa, L. Duraes, J. Campos and A. Portugal, Chem. Eng. Sci., 2007, 62, 5078–5083 CrossRef.
- A. Bach, P. Gibot, L. Vidal, R. Gadiou and D. Spitzer, J. Energ. Mater., 2015, 33, 260–276 CrossRef CAS.
- S. Singh, V. L. Mathe, G. Singh, S. V. Bhoraskar and N. Kulkarni, J. Therm. Anal. Calorim., 2015, 119, 309–317 CrossRef CAS.
- B. S. Bockmon, M. L. Pantoya, S. F. Son, B. W. Asay and J. T. Mang, J. Appl. Phys., 2005, 98, 064903 CrossRef.
- C. D. Park, M. Mileham, L. J. Van de Burgt, E. A. Muller and A. E. Stiegman, J. Phys. Chem. C, 2010, 114(6), 2814–2820 CAS.
- R. Li, H. M. Xu, H. L. Hu, G. C. Yang, J. Wang and J. P. Shen, J. Energ. Mater., 2014, 32, 50–59 CrossRef CAS.
- K. B. Plantier, M. L. Pantoya and A. E. Gash, Combust. Flame, 2005, 140, 299–309 CrossRef CAS.
- K. Gao, L. Wang, G. P. Li, L. H. Shen, Y. J. Luo and G. Wang, J. Therm. Anal. Calorim., 2014, 118, 43–49 CrossRef CAS.
- A. Prakash, A. V. McCormick and M. R. Zachariah, Chem. Mater., 2004, 16, 1466–1471 CrossRef CAS.
- S. H. Kim and M. R. Zachariah, Adv. Mater., 2004, 16, 1821–1825 CrossRef CAS.
- J. L. Cheng, H. H. Hng, Y. W. Lee, S. W. Du and N. N. Thadhani, Combust. Flame, 2010, 157, 2241–2249 CrossRef CAS.
- J. L. Cheng, H. H. Hng, H. Y. Ng, P. C. Soon and Y. W. Lee, J. Phys. Chem. Solids, 2010, 71, 90–94 CrossRef CAS.
- F. Séverac, P. Alphonse, A. Estève, A. Bancaud and C. Rossi, Adv. Funct. Mater., 2012, 22, 323–329 CrossRef.
- Y. Yang, Z. C. Zhang, P. P. Wang, J. C. Zhang, F. Nosheen, J. Zhuang and X. Wang, Inorg. Chem., 2013, 52, 9449–9455 CrossRef CAS PubMed.
- W. C. Zhang, B. Q. Yin, R. Q. Shen, J. H. Ye, J. A. Thomas and Y. M. Chao, ACS Appl. Mater. Interfaces, 2013, 5, 239–242 CAS.
- M. Leskelä and M. Ritala, Angew. Chem., Int. Ed., 2003, 42, 5548–5554 CrossRef PubMed.
- S. M. George, Chem. Rev., 2010, 110, 111–131 CrossRef CAS PubMed.
- R. Singh, R. Bapat, L. J. Qin, H. Feng and V. Polshettiwara, ACS Catal., 2016, 6, 2770–2784 CrossRef CAS.
- V. Miikkulainen, M. Leskelä, M. Ritala and R. L. Puurunen, J. Appl. Phys., 2013, 113, 021301 CrossRef.
- C. Marichy, M. Bechelany and N. Pinna, Adv. Mater., 2012, 24, 1017–1032 CrossRef CAS PubMed.
- X. B. Meng, M. Ionescu, M. N. Banis, Y. Zhong, H. Liu, Y. Zhang, S. H. Sun, R. Y. Li and X. L. Sun, J. Nanopart. Res., 2011, 13, 1207–1218 CrossRef CAS.
- J. A. Klug, N. G. Becker, S. C. Riha, A. B. F. Martinson, J. W. Elam, M. J. Pellin and T. Proslier, J. Mater. Chem. A, 2013, 1, 11607–11613 CAS.
- M. Utriainen, M. Kroger-Laukkanen and L. Niinisto, Mater. Sci. Eng., B, 1998, 54, 98–103 CrossRef.
- P. Tagtstrom, P. Martensson, U. Jansson and J. O. Carlsson, J. Electrochem. Soc., 1999, 146, 3139–3143 CrossRef CAS.
- H. Seim, M. Nieminen, L. Niinisto, H. Fjellvag and L. S. Johansson, Appl. Surf. Sci., 1997, 112, 243–250 CrossRef CAS.
- O. Nilsen, M. Peussa, H. Fjellvag, L. Niinisto and A. Kjekshus, J. Mater. Chem., 1999, 9, 1781–1784 RSC.
- J. Lu, J. Sundqvist, M. Ottosson, A. Tarre, A. Rosental, J. Aarik and A. Hårsta, J. Cryst. Growth, 2004, 26, 191–200 CrossRef.
- J. D. Ferguson, K. J. Buechler, A. W. Weimer and S. M. George, Powder Technol., 2005, 156, 154–163 CrossRef CAS.
- L. J. Qin, T. Gong, H. X. Hao, K. Y. Wang and H. Feng, J. Nanopart. Res., 2013, 15, 2150 CrossRef.
- N. N. Zhao, C. C. He, J. B. Liu, H. J. Gong, T. An, H. X. Xu, F. Q. Zhao, R. Z. Hu, H. X. Ma and J. Z. Zhang, J. Solid State Chem., 2014, 219, 67–73 CrossRef CAS.
- J. M. Slocik, C. A. Crouse, J. E. Spowart and R. R. Naik, Nano Lett., 2013, 13, 2535–2540 CrossRef CAS PubMed.
- J. W. Elam, M. D. Groner and S. M. George, Rev. Sci. Instrum., 2002, 73, 2981–2987 CrossRef CAS.
- J. L. Bachmann, J. Jing, M. Knez, S. Barth, H. Shen, S. Mathur, U. Gösele and K. Nielsch, J. Am. Chem. Soc., 2007, 129, 9554–9555 CrossRef CAS PubMed.
- M. Lie, H. Fjellvåg and A. Kjekshus, Thin Solid Films, 2005, 488, 74–81 CrossRef CAS.
- O. Nilsen, M. Lie, S. Foss, H. Fjellvåg and A. Kjekshus, Appl. Surf. Sci., 2004, 227, 40–47 CrossRef CAS.
- J. R. Avila, D. W. Kim, M. Rimoldi, O. K. Farha and J. T. Hupp, ACS Appl. Mater. Interfaces, 2015, 7, 16138–16142 CAS.
- M. Aronniemi, J. Saino and J. Lahtinen, Thin Solid Films, 2008, 516, 6110–6115 CrossRef CAS.
- A. B. F. Martinson, M. J. DeVries, J. A. Libera, S. T. Christensen, J. T. Hupp, M. J. Pellin and J. W. Elam, J. Phys. Chem. C, 2011, 115, 4333–4339 CAS.
- J. D. Emery, C. M. Schlepütz, P. J. Guo, S. C. Riha, R. P. H. Chang and A. B. F. Martinson, ACS Appl. Mater. Interfaces, 2014, 6, 21894–21900 CAS.
- M. Rooth, A. Johansson, K. Kukli, J. Aarik, M. Boman and A. Hårsta, Chem. Vap. Deposition, 2008, 14, 67–70 CrossRef CAS.
- J. R. Scheffe, A. Francés, D. M. King, X. H. Liang, B. A. Branch, A. S. Cavanagh, S. M. George and A. W. Weimer, Thin Solid Films, 2009, 517, 1874–1879 CrossRef CAS.
- T. Gong, L. J. Qin, R. Yan, L. Hu, Y. P. Ji and H. Feng, J. Inorg. Mater., 2014, 29, 869–874 CrossRef CAS.
- M. Aronniemi, J. Lahtinen and P. Hautojärvi, Surf. Interface Anal., 2004, 36, 1004–1006 CrossRef CAS.
- S. C. Zhao, Z. Gao, C. Q. Chen, G. Z. Wang, B. Zhang, Y. Chen, J. Zhang, X. Li and Y. Qin, Carbon, 2016, 98, 196–203 CrossRef CAS.
- J. Kwon, J. M. Ducere, P. Alphonse, M. Bahrami, M. Petrantoni, J. F. Veyan, C. Tenailleau, A. Esteve, C. Rossi and Y. Chabal, ACS Appl. Mater. Interfaces, 2013, 5, 605–613 CAS.
| This journal is © The Royal Society of Chemistry 2017 |

