 Open Access Article
Creative Commons Attribution 3.0 Unported Licence
Electronic structure, magnetism and optical properties of orthorhombic GdFeO3 from first principles
Xu-Hui Zhuab,
Xiang-Bo Xiaoa,
Xiang-Rong Chenb and
Bang-Gui Liu*ac
aBeijing National Laboratory for Condensed Matter Physics, Institute of Physics, Chinese Academy of Sciences, Beijing 100190, China. E-mail: bgliu@iphy.ac.cn
bInstitute of Atomic and Molecular Physics, College of Physical Science and Technology, Sichuan University, Chengdu 610065, China
cSchool of Physical Sciences, University of Chinese Academy of Sciences, Beijing 100190, China
First published on 16th January 2017
Abstract
Orthorhombic GdFeO3 has attracted considerable attention in recent years because its magnetic structure is similar to that of the well-known BiFeO3 material. Here, we investigate the electronic structure, magnetism and optical properties of orthorhombic GdFeO3 in terms of density-functional-theory calculations. The modified Becke-Johnson (mBJ) exchange potential is adopted to improve on the description of the electronic structure. Our calculations show that the G-type antiferromagnetic (G-AFM ordering of Fe spins) phase of orthorhombic GdFeO3 is stable compared to other magnetic phases. The semiconductor gap calculated with mBJ, substantially larger than that with GGA, is in good agreement with recent experimental values. Additionally, we also investigate the effects of spin–orbit coupling on the electronic structure, and calculate the complex dielectric functions and other optical functions of photon energy. The magnetic exchange interactions are also investigated, which gives a Néel temperature close to experimental observation. For confirming these mBJ results, we also study the electronic structure of rhombohedral (R3c) BiFeO3 with mBJ, obtaining good consistency with experiment. These lead to a satisfactory theoretical understanding of the electronic structure, magnetism and optical properties of orthorhombic GdFeO3 and can help elucidate the electronic structures and optical properties of other similar materials.
I. Introduction
Bismuth ferrite (BiFeO3) is a representative of single-phase multiferroic materials, which displays antiferromagnetic order below TN ∼ 643 K and possesses a relatively high spontaneous electric polarization of 59.4 μC cm−2 up to Tc ∼ 1100 K.1–3 Besides, BiFeO3 is a perovskite oxide whose most stable phase is a rhombohedral distorted structure with space group R3c. As a magnetic material similar to BiFeO3, orthorhombic distorted GdFeO3, which has a Néel temperature 661 K and belongs to the perovskite rare-earth orthoferrites, has sparked substantial curiosity and stimulated relatively deep research.4–7The GdFeO3 compound has a complex H–T phase diagram and undergoes a plurality of magnetic phase transitions, accompanying the dramatic changes in electrical properties.8 The orthorhombic distorted GdFeO3 compound (Pbnm), with Gd3+ ions at the center and Fe3+ ions at the corners surrounded by oxygen octahedra, possesses weak ferromagnetism and ferroelectricity.4,5,7 Under electric and magnetic fields, the ferroelectric polarization and magnetization of GdFeO3 has been successfully brought under control for a variety of applications.9 A spontaneous polarization of about 0.12 μC cm−2 was obtained at 2 K,7 which is basically identical with the measured value in the perpendicular magnetic system.10 According to the Bertaut notation, the spin structure of Fe3+ is GxAyFz.11 Below TGdN = 2.5 K, the magnetic order of Gd3+ is antiferromagnetic along the a-axis, showing Gx antiferromagnetic order and ferroelectric polarization characteristics.4,12 The interaction between adjacent Fe3+ and Gd3+ layers induces ferroelectric polarization along the c-axis.12 It was reported that the Fe spins in BiFeO3 form a G-type antiferromagnetic (G-AFM) ordering, with the spins on the Fe3+ ions being aligned antiferromagnetically along the [111] axis.13 Interestingly, GdFeO3 can show a ferromagnetism below 5 K,4,14,15 and at TFeN = 661 K, Fe3+ also forms G-AFM ordering in GdFeO3 and shows a weak ferromagnetism due to the Dzyaloshinskii–Moriya interaction.16–18 On the other hand, first-principles calculations suggested that the antiferromagnetic phase of the orthorhombic GdFeO3 is more stable than the ferromagnetic phase,19 and it was also pointed out that the transition from antiferromagnetic to paramagnetic ordering could occur at 670 K.6,7,9
Despite a large number of experimental studies concerning the electromagnetic behavior of orthorhombic distorted GdFeO3, the theoretical reports are extremely meagre and it is necessary to adopt suitable theoretical approaches to perform further study. Here, we investigate the electronic structure and magnetic and optical properties of orthorhombic GdFeO3 through density functional theory (DFT) calculations. In order to better understand the electronic properties of GdFeO3, we also investigate the electronic structure of BiFeO3 for comparison. The remainder of this paper is organized as follows: computational details are described in the second section, main calculated results and analysis are presented in the third section, and finally, conclusions are presented in the fourth section.
II. Computational details
The full-potential linearized augmented plane wave method within the density-functional theory (DFT),20,21 as implemented in the package Wien2k,22 is utilized in our calculations. First, the popular generalized gradient approximation (GGA-PBE)23 is adopted to optimize crystal structures and investigate electronic structures and magnetism. Because the standard semi-local GGA usually underestimates energy band gaps,24 we use the mBJ approximation25 for the exchange potential, taking the local density approximation (LDA)26 to treat the correlation potential, as usual for improved description of electronic structures and optical properties. For the calculations of electronic structures, mBJ has been shown to significantly improve and accurately produce semiconductor gaps for sp semiconductors, wide-band-gap semiconductors, and transition-metal oxide semiconductors and insulators.25,27–30 The electronic correlation has been effectively taken into account in this powerful mBJ approach.25 Because the theoretical semiconductor gaps are improved, much better computational results can also be obtained for the optical properties. The full relativistic effects are calculated with Dirac equations for core states, and the scalar relativistic approximation is used for valence states.31,32 We also take the spin–orbit coupling (SOC) into consideration. The cut-off energy is set to −6 Ry to separate core states from valance states. The k-mesh size in the first Brillouin zone is 11 × 10 × 7 for GdFeO3, and 10 × 10 × 10 for BiFeO3. We construct harmonic expansion up to lmax = 10, set Rmt × Kmax = 7, and use magnitude of the largest vector Gmax = 12 in charge density Fourier expansions. The radii of Gd, Bi, Fe and O atomic spheres are set to 2.27, 2.12, 1.99 and 1.77 bohr, respectively. The self-consistent calculations are considered to be converged only when the integration of absolute charge-density difference per formula unit between the successive loops is less than 0.0001|e|, where e is the electron charge.III. Results and discussion
A. Crystal structure
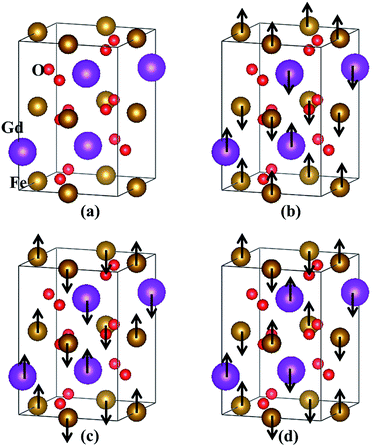
The orthorhombic GdFeO3 system investigated here has space group Pbnm (no. 62)4,19,33,34 at low temperatures. The experimental lattice constants are a = 5.349 Å, b = 5.611 Å and c = 7.669 Å.33 The crystal structure of orthorhombic GdFeO3 is shown in Fig. 1(a). At first, we optimized the lattice parameters and ionic positions with GGA and LDA and the optimized lattice parameters are summarized in Table 1. Existing experimental results33,34 are also presented for comparison. The GGA optimized volume V is 2.0% larger than the experimental volume,33 but the LDA optimized volume V is 5.1% smaller. It can be clearly seen that the lattice constants and volume calculated with GGA are closer to the experimental data33,34 than those with LDA. Therefore, the other properties are investigated on the basis of the GGA optimized results. The GGA-optimized atomic positions are summarized in Table 2. After internal structure optimization, the Gd atom occupies the (0.9911, 0.0639, 0.25) site, the Fe atom the (0, 0.5, 0) site, the O1 atom the (0.7024, 0.3121, 0.0488) site, and the O2 atom the (0.0927, 0.4726, 0.25) site in Wyckoff coordinates. These are consistent with the experimental orthorhombic structure.33,34 Furthermore, the three optimized Gd–O bond lengths are 2.307, 2.347 and 2.399 Å, which are slightly larger than the Fe–O bond lengths of 1.968, 1.974 and 2.124 Å, respectively. These are in line with the relation of ionic radii, Gd3+ > Fe3+, and in accordance with the previously reported values.34 The distances between Gd3+ and Fe3+ ions are 3.136, 3.284 and 3.362 Å. The bond angles of Fe–O–Gd are 85.38° and 87.34°, deviating from the ideal values of 90°. These imply that the orthorhombic GdFeO3 has undergone substantial structural distortion.| Atom | Site | x (exp.33,34) | y (exp.33,34) | z (exp.33,34) |
|---|---|---|---|---|
| Gd | 4c | 0.9911 (0.9844, 0.9846) | 0.0639 (0.0628, 0.0626) | 0.2500 (0.2500, 0.2500) |
| Fe | 4b | 0.0000 (0.0000, 0.0000) | 0.5000 (0.5000, 0.5000) | 0.0000 (0.0000, 0.0000) |
| O1 | 8d | 0.7024 (0.6957, 0.6966) | 0.3121 (0.3016, 0.3011) | 0.0488 (0.0506, 0.0518) |
| O2 | 4c | 0.0927 (0.1005, 0.1009) | 0.4726 (0.4672, 0.4669) | 0.2500 (0.2500, 0.2500) |
In addition, we have calculated the GGA total energies of four different magnetic ordering configurations: the ferromagnetic and three antiferromagnetic (AFM) ones. The three AFM structures are shown in Fig. 1(b–d) and are denoted by A-AFM, C-AFM and G-AFM, respectively. Taking the total energy of the lowest G-AFM structure as a reference, the other three energies are higher, which is consistent with the experimental results.4,8 The ground-state magnetic structure is similar to the magnetic ordering of rhombohedral BiFeO3 where the Fe spins form a G-AFM structure.35 These results are also consistent with LSDA + U calculation.19
B. Electronic structures
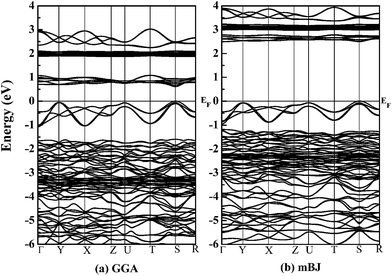
With the optimized crystal structure, we calculate with both GGA and mBJ potentials the spin-dependent energy band structures and the densities of states (DOSs) of orthorhombic GdFeO3 between −6 eV and 4 eV. The two band structures are shown in Fig. 2. The conduction band bottom and the valence band top are located at the same S point in both of the band structures and indicate a direct gap for orthorhombic GdFeO3. It can be seen that the GGA semiconductor gap is 0.61 eV [Fig. 2(a)], a little larger than the earlier first-principles result of 0.54 eV,36 but the mBJ-calculated semiconductor gap, 2.49 eV [Fig. 2(b)], is apparently larger than the GGA value and is in accordance with the experimental results (2.1–2.53 eV).7,9,10,37,38 Very interestingly, there are many similar features between GdFeO3 and BiFeO3 as orthoferrite ABO3 materials. As a typical multiferroic orthoferrite compound, however, BiFeO3 shows the characteristics of an indirect band gap. For BiFeO3, our GGA band gap of 0.965 eV is slightly lower than previous DFT values of 1.06 eV38 and 1.04 eV,39 but they are all too small to accurately describe the experimental values of 2.4 eV,40 2.5 eV,41 and 2.74 eV.42 Our mBJ calculation produces a semiconductor gap of 2.354 eV for BiFeO3 and it is in good agreement with the experimental values. In contrast, a band gap of 2.8 eV, obtained with a screened exchange potential,35 is too large in comparison with the experimental values. These results show that our mBJ gap of 2.49 eV is reasonable and should be accurate for orthorhombic GdFeO3.Fig. 3 shows the spin-resolved densities of states (DOSs) of orthorhombic GdFeO3 calculated with both GGA and mBJ. Through comparing GGA DOS [see Fig. 3(a)] and mBJ DOS [see Fig. 3(b)], we can see that the wide valence bands between −6 eV and 0 eV are originated from O 2p and Fe 3p states with a mixture of some Gd 5p6s, and the conduction bands are mainly from Fe 3d and Gd 4f states. Our analysis shows that the filled O 2p states are located between −6 and 0 eV. The filled Gd 4f states are between −3.4 and −1.2 eV, and the empty ones are between 2.8 and 3.4 eV. The filled Fe eg states are between −0.85 and 0.0 eV, and the empty ones between 2.49 and 2.93 eV. The empty Fe t2g states are between 3.37 and 3.88 eV. In order to understand the electronic properties of orthorhombic GdFeO3, the total and partial density of states of BiFeO3 are also investigated with mBJ (not presented here). The top of the valence bands consist mainly of O 2p states and some Fe 3d and Bi 6p states, and the bottom of the conduction bands are originated from Fe 3d states and O 2p states. Our DOS calculated with mBJ is significantly more accurate than the previous theoretical work with GGA,38,39 and is close to the sX potential result.35 It is interesting that the two materials share main features in the density of states.
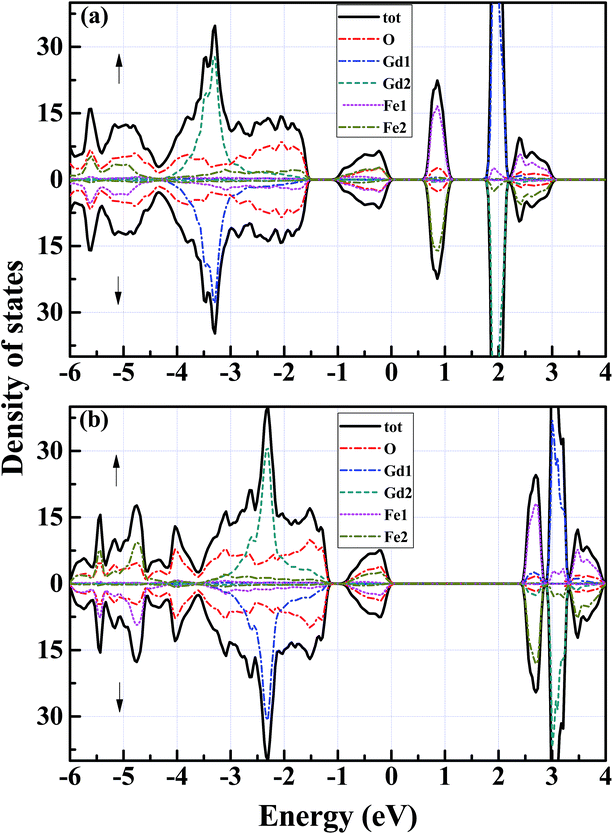 | ||
| Fig. 3 Spin-resolved total density of states of orthorhombic GdFeO3 with (a) GGA and (b) mBJ. The upper part is for the majority-spin channel and the lower for the minority-spin one. | ||
C. Effects of spin–orbits coupling
The spin–orbit coupling (SOC) is important for electronic materials containing heavy atoms such as Gd and can lead to magnetocrystalline anisotropy. With the GGA + SOC method, we can calculate the total energy of orthorhombic GdFeO3 by taking the SOC into account. Setting the magnetization in the [100], [010], [001], [110], [101], [011] and [111] directions, we obtain total energies of 2.6, 3.8, 0, 3.2, 8.7, 1.3 and 1.6 μeV, respectively. It is obvious that the lowest energy is along the [001] direction. These results indicate that the easy magnetization axis (the most stable magnetic orientation) of orthorhombic GdFeO3 is along the [001] axis.In the easy axis, the total spin moment is precisely equivalent to 0 μB per formula unit without SOC for orthorhombic GdFeO3. According to Hund’s rule, the cations Gd3+ and Fe3+ possess high spin values of s = 7/2 and s = 5/2, respectively, and the antiferromagnetic coupling makes the total spin moment equal to 0 μB per formula unit. Since part of the spin moments are located in the interstitial region, the spin moments of the individual Gd3+ and Fe3+ are 6.855 μB and 4.082 μB, smaller than the theoretical 7 μB and 5 μB, respectively. When taking the SOC into account, the spin moments of Gd3+ and Fe3+ are reduced to 6.811 μB and 4.080 μB, respectively. The orbital moment of Fe 3d is 0.183 μB, which has the same sign as the spin moment, and the orbital moment of Gd3+ ion is 0.088 μB.
The semiconductor gap Eg is also investigated by using mBJ. The semiconductor gap becomes smaller (2.40 eV) when the SOC is taken into account. Fig. 4(a) shows the density of states of orthorhombic GdFeO3 obtained with mBJ + SOC. Looking closely at Fig. 4(a), the semiconductor gap is slightly smaller than that without SOC. This should be because the Fe 3d and Gd 4f bands become wider due to SOC. Fig. 4(b) explicitly demonstrates the energy bands with mBJ + SOC. The band structures and density of states show that the energy bands, especially the conduction bands, in both of the spin channels hybridize with each other.
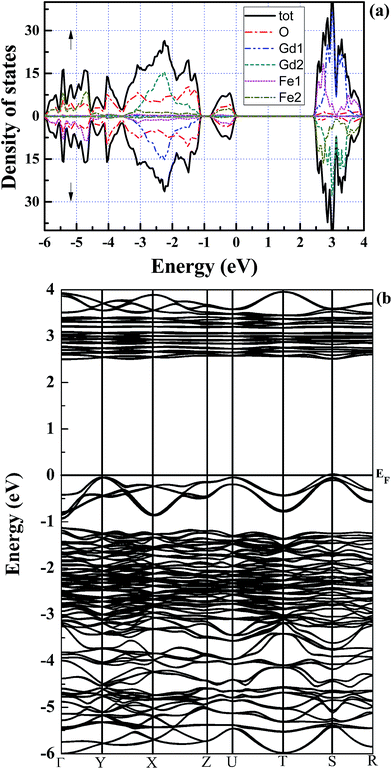 | ||
| Fig. 4 The spin-resolved (a) total density of states and (b) energy bands of orthorhombic GdFeO3 with mBJ + SOC. | ||
D. Exchange interactions
The magnetic exchange interactions on Gd3+ and Fe3+ can be investigated in terms of total energy calculations. We consider four different magnetic configurations, namely antiferromagnetic (ground state) and ferromagnetic ordering, and two other magnetic orderings constructed by changing the Fe and Gd spins of the antiferromagnetic configuration to the ferromagnetic ordering, respectively. With the first principles total energies of the different magnetic configurations, we can determine the coupling constants of the effective Heisenberg model (eqn. (1)):43
 | (1) |
 , where E0 is defined to be independent of spin configuration. We obtain the following equations from the four magnetic structures (eqn (2)).
 | (2) |
From the above equations, we can calculate the eij parameters, and then obtain exchange coupling parameters Jij. The Gd–Gd and Fe–Gd spin exchange energies are much smaller than the Fe–Fe value (26.43 meV). As a result, the spin exchange parameters Jij are 0.03 meV between the nearest Fe–Gd pair, 4.23 meV between Fe–Fe, and 0.05 meV between Gd–Gd. It is clear that the Fe–Fe spin coupling is dominant over the other two.
With the exchange constants Jij given, we can calculate the magnetic phase transition temperature, TN. For this purpose, the quantum Green-function method is a good approach because it can produce accurate transition temperatures and reliable temperature dependence of magnetization or sublattice magnetization for a Heisenberg spin model.44–47 For our spin model, we aim to use this method to estimate the Néel temperature. If neglecting the much smaller Gd–Gd and Gd–Fe interaction energies, we can estimate the Néel temperature, TN = 605 K, in terms of an analytical approach.47 Considering that we have not taken the SOC effect into account, this Néel temperature is very satisfactory compared to experimental values: 670 K7 and 661 K.16,17
E. Optical properties
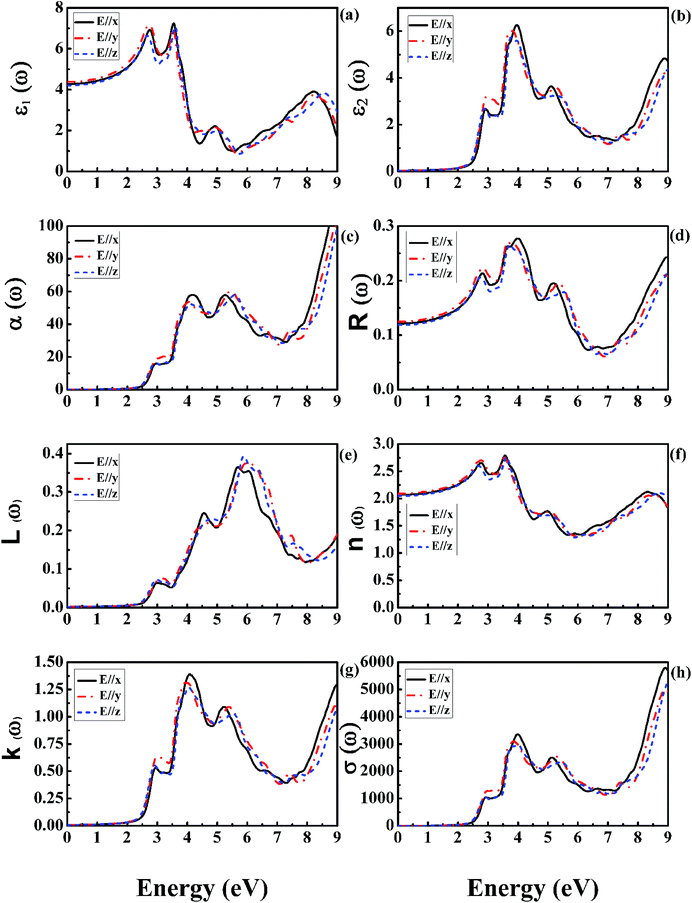
Optical spectroscopy analysis is a powerful tool to determine the energy band structure of a solid material.48,49 The complex dielectric function is directly related to the energy band structure of solids. For orthorhombic GdFeO3, Fig. 5 shows the mBJ calculated curves of the complex dielectric function (the real and imaginary parts), absorption coefficient, reflectivity, energy loss function, refractive index, extinction coefficient, and optical conductivity as functions of the photon energy in the range of 0–9 eV. All the three polarization directions (E//x, y, and z) are considered.The electronic polarizability of a material can be understood from the real part of the dielectric function ε1(ω) [Fig. 5(a)]. The static dielectric constant ε1(0) along the three crystallographic directions is found to be 4.28 for E//x, 4.38 for E//y, and 4.20 for E//z, respectively. The average value of the zero frequency dielectric constant ε1(0) is 4.29. However, there is no experimental polarized zero frequency dielectric constant available for comparison. These results clearly indicate anisotropy in the optical properties of orthorhombic GdFeO3. The ratio ε1yy(0)/ε1zz(0) is equal to 1.043 for estimating the degree of anisotropy. From the zero frequency limit, they start increasing and reach the maximum value of 6.92 at 2.76 eV for E//x, 7.16 at 2.73 eV for E//y, and 6.63 at 2.65 eV for E//z, respectively. The imaginary part ε2(ω) [Fig. 5(b)] gives information of the absorption behavior of GdFeO3. The threshold energy of the dielectric function is at E0 = 2.49 eV, in good accordance with the fundamental gap. The obtained optical gap once again proves that mBJ can provide an accurate band gap for magnetic semiconductors. The imaginary part ε2(ω) [Fig. 5(b)] indicates that GdFeO3 is anisotropic and its maximum absorption peak values are around 3.96, 3.82 and 3.77 eV for E//x, E//y and E//z, respectively. From Fig. 4(a), for the imaginary part ε2(ω), it is clear that there are strong absorption peaks in the energy range of 2.5–9 eV. Because ε2(ω) is related to the DOS, these peaks reflect some transitions between different orbitals. Compared with Fig. 3, it can be recognized that the peaks around 3.5–4.5 eV are mainly due to transitions from Gd-4f valence bands to O-2p conduction bands.
Fig. 5(c–h) show the calculated results of the photon energy dependence of absorption coefficient α(ω), reflectivity coefficient R(ω), energy loss function L(ω), refractive index n(ω), extinction coefficient k(ω) and optical conductivity σ(ω) of orthorhombic GdFeO3. The absorption coefficient α(ω) [Fig. 5(c)] shows a very intense absorption up to 9 eV; it begins to increase sharply from 2.49 eV, corresponding to the band gap value. The reflectivity coefficient R(ω) is shown in Fig. 5(d), the zero-frequency reflectivity values are 12.1% for E//x, 12.5% for E//y, and 11.9% for E//z, respectively. The maximum reflectivity values are about 19.5, 19.5 and 17.9%, which occurs at 5.18 eV for E//x, 5.35 eV for E//y, and 5.51 eV for E//z, respectively. Interestingly, the strong reflectivity maximum between 2.49 and 9 eV originates from the interband transitions. The energy loss function L(ω) [Fig. 5(e)] is related to the energy loss of a fast electron in the material and is usually large at the plasmon energy.50 The most prominent peak in the L(ω) spectra represents the characteristic associated with the plasmon resonance and is situated at 5.86 eV for E//z polarization. The refractive index values n(ω) are shown in Fig. 5(f). The static refractive index n(0) is found to have the value 2.07 for E//x, 2.09 for E//y, and 2.05 for E//z, respectively. The average value of n(0) is equal to 2.07. The value of the static refractive index is obtained from the real part of dielectric function to be  , which is the same as that obtained from Fig. 5(f). A similar trend is observed from the behaviour of the imaginary part of the dielectric function ε2(ω) [Fig. 5(b)] and the extinction coefficient k(ω) [Fig. 5(g)]. The extinction coefficient k(ω) reflects the maximum absorption in the medium at 4.01 eV for E//x, 3.90 eV for E//y, and 4.04 eV for E//z, respectively. The optical conductivity σ(ω) is shown in Fig. 5(h). It starts from 2.49 eV and has similar features with the absorption coefficient α(ω) in Fig. 5(c).
IV. Conclusion
We have used the FP-LAPW method to investigate the structural, electronic, magnetic and optical properties of orthorhombic GdFeO3. The GGA approach has confirmed that the G-type AFM ordering of Fe spins is the ground-state phase, consistent with the experimental results. The mBJ exchange potential is used for improving on the description of the electronic structures of GdFeO3. Our calculated results show that mBJ exchange greatly improves the accuracy of the band gap value. The mBJ result accords well with the experimental value and overcomes the GGA underestimation of the band gap. Besides, the spin–orbit coupling is taken into account to determine the easy magnetic axis and investigate its effects on the electronic structure. We also calculate magnetic exchange constants and thereby achieve a good Néel temperature close to the experimental value. Finally, the optical properties also are investigated with mBJ. In addition, we also calculated the electronic structure of the well-known BiFeO3 to support our mBJ-calculated results in the case of GdFeO3. The magnetic similarity between these two perovskite oxide materials are very interesting. These calculated results should be useful to obtain further insight for GdFeO3 and similar materials.Acknowledgements
This work is supported by the Nature Science Foundation of China (No. 11574366), by the Strategic Priority Research Program of the Chinese Academy of Sciences (Grant No. XDB07000000), and by the Department of Science and Technology of China (Grant No. 2016YFA0300701).References
- R. S. Fishman, J. T. Haraldsen, N. Furukawa and S. Miyahara, Phys. Rev. B: Condens. Matter Mater. Phys., 2013, 87, 134416 CrossRef.
- J. Buhot, C. Toulouse, Y. Gallais, A. Sacuto, R. de Sousa, D. Wang, L. Bellaiche, M. Bibes, A. Barthlmy, A. Forget, D. Colson, M. Cazayous and M.-A. Measson, Phys. Rev. Lett., 2015, 115, 267204 CrossRef CAS PubMed.
- D. Sando, Y. Yang, E. Bousquet, C. Carrtro, V. Garcia, S. Fusil, D. Dolfi, A. Barthlmy, P. Ghosez, L. Bellaiche and M. Bibes, Nat. Commun., 2016, 7, 10718 CrossRef CAS PubMed.
- Y. Tokunaga, N. Rurukawa, H. Sakai, Y. Taguchi, T. Arima and Y. Tokura, Nat. Mater., 2009, 8, 558 CrossRef CAS PubMed.
- M. W. Lufaso and P. M. Woodward, Acta Crystallogr., Sect. B: Struct. Sci., 2001, 57, 725 CrossRef CAS PubMed.
- A. Wu, H. Shen, J. Xu, Z. Wang, L. Jiang, L. Luo, S. Yuan, S. Cao and H. Zhang, Bull. Mater. Sci., 2012, 35, 259 CrossRef CAS.
- P. R. Babu, I. Bhaumik, S. Ganesamoorthy, S. Kalainathan, R. Bhatt, A. K. Karnal and P. K. Gupta, J. Alloys Compd., 2015, 631, 232 CrossRef.
- Z. Y. Zhao, X. M. Wang, C. Fan, W. Tao, X. G. Liu, W. P. Ke, F. B. Zhang, X. Zhao and X. F. Sun, Phys. Rev. B: Condens. Matter Mater. Phys., 2011, 83, 014414 CrossRef.
- A. Wu, Z. L. Wang, B. Wang, X. L. Ban, L. W. Jiang, J. Xu, S. J. Yuan and S. X. Cao, Solid State Commun., 2014, 185, 14 CrossRef CAS.
- Y. Tokunaga, S. Iguchi, T. Arima and Y. Tokura, Phys. Rev. Lett., 2008, 101, 097205 CrossRef CAS PubMed.
- G. T. Rado and H. Suhl, Magnetism: A treatise on modern theory and materials, Academic Press, New York, 1963, vol. III Search PubMed.
- E. F. Bertaut, Magnetism, Academic Press, New York, 1963 Search PubMed.
- L. Bi, A. R. Taussig, H.-S. Kim, L. Wang, G. F. Dionne, D. Bono, K. Persson, G. Ceder and C. A. Ross, Phys. Rev. B: Condens. Matter Mater. Phys., 2008, 78, 104106 CrossRef.
- J. Shah and R. Kotnala, Scr. Mater., 2012, 67, 316 CrossRef CAS.
- K. C. Nowack, F. H. L. Koppens, Y. V. Nazarov and L. M. K. Vandersypen, Science, 2007, 318, 1430 CrossRef CAS PubMed.
- D. Treves, J. Appl. Phys., 1965, 36, 1033 CrossRef CAS.
- R. M. Bozorth, H. J. Williams and D. E. Walsh, Phys. Rev., 1956, 103, 572 CrossRef CAS.
- I. Dzyaloshinskii, J. Phys. Chem. Solids, 1958, 4, 241 CrossRef CAS; T. Moriya, Phys. Rev., 1960, 120, 91 CrossRef.
- N. Singh and J. Y. Rhee, J. Korean Phys. Soc., 2008, 53, 806 CrossRef CAS.
- P. Hohenberg and W. Kohn, Phys. Rev., 1964, 136, B864 CrossRef.
- W. Kohn and L. J. Sham, Phys. Rev., 1965, 140, A1133 CrossRef.
- P. Blaha, K. Schwarz, G. K. H. Madsen, D. Kvasnicka and J. Luitz, WIEN2k, An Augmented Plane Wave + Local Orbitals Program for Calculating Crystal Properties, ed. K. Schwarz, Techn. Universitat Wien, Austria, 2001, ISBN 3-9501031-1-2 Search PubMed.
- J. P. Perdew, K. Burke and M. Ernzerhof, Phys. Rev. Lett., 1996, 77, 3865 CrossRef CAS PubMed.
- H. Fan, A. S. Barnard and M. Zacharias, Appl. Phys. Lett., 2007, 90, 143116 CrossRef.
- F. Tran and P. Blaha, Phys. Rev. Lett., 2009, 102, 226401 CrossRef PubMed.
- J. P. Perdew and Y. Wang, Phys. Rev. B: Condens. Matter, 1992, 45, 13244 CrossRef.
- D. J. Singh, Phys. Rev. B: Condens. Matter Mater. Phys., 2010, 82, 205102 CrossRef.
- D. Koller, F. Tran and P. Blaha, Phys. Rev. B: Condens. Matter Mater. Phys., 2012, 85, 155109 CrossRef.
- S. W. Fan, L. J. Ding, Z. L. Wang and K. L. Yao, Appl. Phys. Lett., 2013, 102, 022404 CrossRef.
- A. Ghosh, R. Thangavel and M. Rajagopalan, J. Mater. Sci., 2015, 50, 1710–1717 CrossRef CAS.
- A. H. MacDonald, W. E. Pickett and D. D. Koelling, J. Phys. C: Solid State Phys., 1980, 13, 2675 CrossRef CAS.
- J. Kunes, P. Novak, R. Schmid, P. Blaha and K. Schwarz, Phys. Rev. B: Condens. Matter, 2001, 64, 153102 CrossRef.
- M. Marezio, J. P. Remeika and P. D. Dernier, The crystal chemistry of the rare earth orthoferrites, Acta Crystallogr., Sect. B: Struct. Crystallogr. Cryst. Chem., 1970, 26, 2008–2022 CrossRef CAS.
- N. L. Ross, J. Zhao, J. B. Burt and T. D. Chaplin, J. Phys.: Condens. Matter, 2004, 16, 5721–5730 CrossRef CAS.
- S. J. Clark and J. Robertson, Appl. Phys. Lett., 2007, 90, 132903 CrossRef.
- B. L. Xing, L. Wu, G. P. Qin, Y. Li, Y. F. Zhang and J. Q. Li, Acta Chim. Sinica, 2007, 65, 17 Search PubMed.
- P. Tang, Y. Y. Hu, T. T. Lin, Z. Jiang and C. W. Tang, Integr. Ferroelectr., 2014, 153, 1 CrossRef.
- H. Wang, Y. Zheng, M. Q. Cai, H. Huang and H. L. W. Chan, Solid State Commun., 2009, 149, 641–644 CrossRef CAS.
- Q. Xu, M. Sobhan, F. Anariba, J. W. C. Ho, Z. Chen and P. Wu, Phys. Chem. Chem. Phys., 2014, 16, 23089 RSC.
- T. P. Gujar, V. R. Shinde and C. D. Lokhande, Mater. Chem. Phys., 2007, 103, 142 CrossRef CAS.
- F. Gao, Y. Yuan, X. Y. Chen, F. Chen, J. M. Liu and F. Z. Ren, Appl. Phys. Lett., 2006, 89, 102506 CrossRef.
- J. F. Ihlefeld, N. J. Podraza, Z. K. Liu, R. C. Rai, X. Xu, T. Heeg, Y. B. Chen, J. Li, R. W. Collins, J. L. Musfeldt, X. Q. Pan, J. Schubert, R. Ramesh and D. G. Schlom, Appl. Phys. Lett., 2008, 92, 142908 CrossRef.
- S. Gong, P. Chen and B. G. Liu, J. Magn. Magn. Mater., 2014, 349, 74–79 CrossRef CAS.
- S. V. Tyablikov, Ukrainian Mathematical Journal, 1959, 11, 287 CrossRef.
- R. A. Tahir-Kheli, Phys. Rev., 1963, 132, 689 CrossRef.
- H. B. Callen, Phys. Rev., 1963, 130, 890 CrossRef.
- R. H. Swendsen, Phys. Rev. B: Solid State, 1975, 11, 1935 CrossRef.
- B. Amin, R. Khenata, A. Bouhemadou, I. Ahmad and M. Maqbool, Phys. B, 2012, 407, 2588–2592 CrossRef CAS.
- M. Maqbool, B. Amin and I. Ahmad, J. Opt. Soc. Am. B, 2009, 26, 2181–2184 CrossRef CAS.
- P. Nozieres, Phys. Rev. Lett., 1959, 8, 1 Search PubMed.
| This journal is © The Royal Society of Chemistry 2017 |

