 Open Access Article
Creative Commons Attribution 3.0 Unported Licence
Cadmium and lead remediation using magnetic and non-magnetic sustainable biosorbents derived from Bauhinia purpurea pods†
Rupa Sharmaa,
Ankur Sarswata,
Charles U. Pittman Jr.b and
Dinesh Mohan *a
*a
aSchool of Environmental Sciences, Jawaharlal Nehru University, New Delhi 110067, India. E-mail: dm_1967@hotmail.com; Fax: +91-11-26704616; Tel: +91-11-26704616
bDepartment of Chemistry, Mississippi State University, Mississippi State MS 39762, USA
First published on 26th January 2017
Abstract
Bauhinia purpurea (Kaniar) pods were dried, powdered, and utilized for cadmium and lead removal. Bauhinia purpurea (Kaniar) pod powders (KPP) were converted into magnetic Bauhinia purpurea (Kaniar) powders (MKPP) by co-precipitation. Iron(II) sulfate and iron(III) sulfate were used as iron precursors. The biosorbents were extensively characterized using zero point charge measurements (pHPZC), ultimate and proximate analyses, Fourier transform infrared (FTIR) and FT-Raman spectroscopy, transmission electron microscopy (TEM), X-ray diffraction (XRD), BET surface area (SBET) measurements, physical properties measurement system (PPMS), scanning electron microscopy (SEM) and energy dispersive X-ray fluorescence (EDXRF) techniques. The SBET of MKPP (52.0 m2 g−1) was higher than KPP (1.8 m2 g−1). Optimum Cd2+ and Pb2+ removal by KPP and MKPP was obtained at pH 5.0 and 4.5, respectively. Metal–ligand chelation, ion-exchange and hydrogen bonding were possible mechanisms for Cd2+ and Pb2+ removal. KPP and MKPP showed maximum Langmuir adsorption capacities of 11.1 and 4.8 mg g−1 for Cd2+ and 16.4 and 14.1 for Pb2+, respectively. Lead and cadmium kinetic data were best described using a pseudo-second-order equation. Cd2+ and Pb2+ removal was affected by the presence of Cu2+ during adsorption from a multicomponent aqueous environment. Cd2+ and Pb2+ remediation from actual groundwater was demonstrated. Fixed-bed studies for Pb2+ removal by KPP were also performed with a column capacity of 18.8 mg g−1 (column dia 2.0 cm; column length 40 cm; bed height 6.0 cm; pH 4.5; flow rate 5.0 mL min−1; Pb2+ conc. 10 mg L−1). Spent KPP was regenerated using 0.1 N HCl. Approximately 85% of total Pb2+ recovery was achieved using 100 mL 0.1 N HCl.
1. Introduction
Clean water is a most valuable natural resource.1 Water pollution due to heavy metals, dyes, pesticides, pharmaceuticals, arsenic, and fluoride contamination is increasing.2 Heavy metals, in particular, are emerging as one of the most common class of water pollutants.3 Heavy metals are capable of inducing toxic effects in organisms when present above their permissible concentrations.4 Cadmium and lead are highly toxic priority pollutants.5 Cadmium contamination in groundwater originates with the manufacturing of alloys, batteries, pigments, plastics, mining and refining processes.6,7 Cadmium causes severe damage to kidneys and bones and is associated with itai-itai disease. Its accumulation in the human body leads to erythrocyte destruction, nausea, salivation, diarrhea, muscular cramps, renal degradation, chronic pulmonary problems, and skeletal deformity.8 Cadmium ions are unlikely to hydrolyze at pH < 8 but tend to exist as hydroxo-complexes at pH > 11.9Mining, smelting, fossil fuels combustion, solid waste incineration, batteries, paints, cables, ceramics and glass manufacturing are common anthropogenic sources of lead contamination in groundwater.10,11 Acute lead poisoning may result to headache, irritability, abdominal pain and various symptoms related to nervous systems. Children are particularly susceptible to lead poisoning due to the high gastro-intestinal barrier and permeable blood–brain barrier.12 The World Health Organization13 and Bureau of Indian Standards14,15 permissible limits for cadmium and lead in drinking water are 0.003 and 0.01 mg L−1, respectively. Common methods deployed for aqueous Cd2+ and Pb2+ removal include filtration, chemical precipitation, ion-exchange, membrane process, electrodeposition and adsorption.16
Adsorption is a simple, effective and economically viable approach,4 widely used to remediate heavy metals and other pollutants.17 Several adsorbents have been used for Pb2+ and Cd2+ remediation, including clays, minerals (goethite, hydroxyapatite and calcite), and calcareous soils.18 Industrial wastes used as Pb2+ and Cd2+ adsorbents include slags, sludges, modified asphaltite ashes, fly ash chitosan, zeolite, humic acid, and sesquioxides (iron, aluminium, or manganese oxides).18 Some bio-materials, such as bark, dead biomass, modified wool, moss, peat and seaweed, were also applied for aqueous Cd2+ and Pb2+ removal.19 Nitrilotriacetic acid anhydride modified ligno-cellulosic material was also used for cadmium and lead removal.20 Reviews of contaminant remediation of water by various biosorbents have appeared.21,22 Activated carbon, the most common adsorbent used to remediate many pollutants23 has high production costs.24 Therefore, heavy metal removal using a low cost adsorbent is essential to encourage remediation.
Biosorption uses the ability of biological materials to accumulate aqueous heavy metals by metabolically mediated or physico-chemical uptake pathways.25 Biosorption can exhibit several advantages including higher sorption capacity, regeneration, and adsorbate recovery.26 Olive stones and sugarcane bagasse,27 marine microphytes,28 Spirulina,29 Camellia sinensis,30 pectin based adsorbent31 and fungal and wood adsorbents32 were tested for aqueous lead and cadmium removal in single and binary systems. Recently, biosorbents used for heavy metals were reviewed.33
Bauhinia purpurea, commonly known as Kaniar or Kachnar, is a small tree. The purple Bauhinia tree (Bauhinia purpurea) is native to lower Himalayan slopes extend up to Assam and throughout the Indian Peninsula. Bauhinia purpurea is also found in Myanmar, Sri Lanka and Southern China.34 Bauhinia purpurea leaves, flowers, flower buds, and young pods are edible35 and have medicinal value, exhibiting antioxidant,36 anti-cancer,37 anti-microbial,38 and nephroprotective39 activities. Bauhinia purpurea can withstand aqueous pollutants.40 Also, biomass from Bauhinia leaves was used for dye removal from wastewater.41 Thus, we selected, dried, and powdered Bauhinia pods for use as a sustainable biosorbent. Bauhinia purpurea pod powder was also magnetized to prepare magnetic biosorbent. Magnetization allows easy recovery of exhausted biosorbent from aqueous systems using a simple magnet.
2. Material and methods
2.1. Reagents and equipment
All the chemicals used in the study were either AR or GR grade. Lead nitrate, Pb(NO3)2 (≥99%), cadmium nitrate, Cd(NO3)2 (≥99%), iron(II) sulfate, FeSO4 (99.5%), and sodium hydroxide, NaOH (98%) were obtained from Merck, India. Iron(III) sulfate, Fe2(SO4)3 (minimum assay 20.50%) was purchased from CDH, India.Cd2+ and Pb2+ stock solutions were prepared in doubly distilled water. Solution pHs were adjusted using 0.1 M nitric acid and sodium hydroxide dilute solutions.
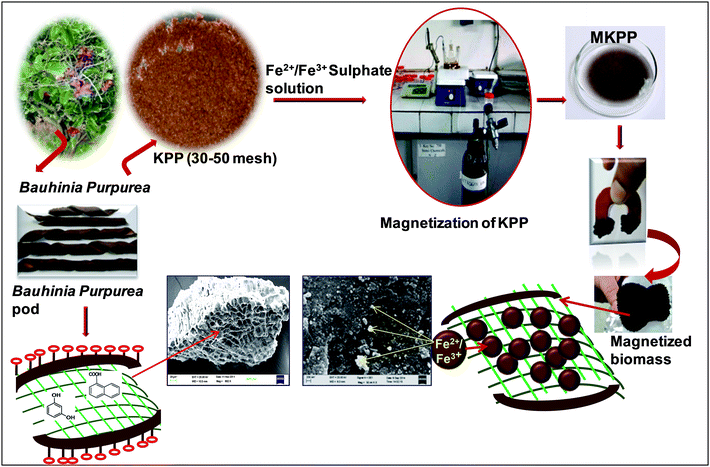
KPP was magnetized using a chemical precipitation method with modifications discussed earlier.5 Briefly, 20 g of KPP was stirred in 200 mL of double distilled water for 1 h. Ferrous sulfate (8 g in 60 mL DW) and ferric sulfate (7.4 g in 20 mL DW) solutions were mixed together. This ferrous–ferric solution was added to the KPP suspension in a three neck round bottom flask. The suspension was agitated for 1 h under nitrogen. Then the pH was raised to pH 10–11 using a freshly prepared 10 M NaOH. The iron oxide nanoparticles started precipitating on KPP surfaces and inner pores during the pH rise. The suspension was aged (24 h), filtered, and washed using distilled water until the pH was constant at ∼7.0. Finally, the magnetic biosorbent was washed using ethanol and dried overnight at 70 °C. The magnetic biosorbent was designated as MKPP. Fig. 1 shows the schematic diagram for MKPP development.
An automated surface area and porosity analyzer (model ASAP 2020, Micromeritics) was used for the surface area, total pore volume and pore size analyses of KPP and MKPP. Biomass samples (0.15 g) were out-gassed at 250 °C for 12 h at <10−3 Torr, prior to nitrogen adsorption measurements.
Dried samples were degassed prior to the analysis. The Brunauer–Emmett–Teller (BET) surface area was calculated from the BET adsorption plot. The Barrett–Joyner–Halenda (BJH)42 adsorption–desorption isotherm was used to determine the pore size distribution. The total micropore volume (W0) was estimated by the Dubinin–Radushkevich (D–R) method.43,44
The biosorbents moisture, volatile and ash content were analyzed by ASTM method.45 The C, H and N were determined using an elemental analyzer (model EURO EA 3000). Ash content was determined by incinerating a 1 g sample in a muffle furnace (Scientech, India) at 750 °C for 6 h.
Surface morphology and elemental composition of KPP and MKPP were examined using a scanning electron microscope (model EVO40, Zeiss) at an accelerating voltage of 10![[thin space (1/6-em)]](https://www.rsc.org/images/entities/char_2009.gif) 000 V, working distance 9900 μm and emission current 13
000 V, working distance 9900 μm and emission current 13![[thin space (1/6-em)]](https://www.rsc.org/images/entities/char_2009.gif) 300 nA equipped with Bruker EDX system. Samples were gold coated to make a conductive layer and mounted on a copper stub using a double stick carbon tape.5
300 nA equipped with Bruker EDX system. Samples were gold coated to make a conductive layer and mounted on a copper stub using a double stick carbon tape.5
KPP and MKPP elemental analyses were carried out on an energy dispersive X-ray fluorescence spectrometer (model Epsilon 5, PANalytical). KPP and MKPP were mixed with boric acid and pressed using an Insmart System (INSMART XRF 40) at an applied pressure of 5 t. The pellet size and exposure area were 34 mm and 8 mm, respectively.
The FTIR spectra of KPP and MKPP were recorded with a FTIR spectrometer (model 7000, Varian) on KBR pellets (1![[thin space (1/6-em)]](https://www.rsc.org/images/entities/char_2009.gif) :
:![[thin space (1/6-em)]](https://www.rsc.org/images/entities/char_2009.gif) 20 ratio) formed at a pressure of 10 t.
20 ratio) formed at a pressure of 10 t.
KPP and MKPP X-ray diffraction (XRD) patterns were obtained on a powder XRD system (model X'Pert PRO, PANalytical) using Cu-Kα radiation (λ = 1.54 Å) at 45 kV and 40 mA. The samples were scanned from 10 to 90° with a scan speed of 2° min−1.
KPP and MKPP morphologies were examined by TEM (model JEM 2100F, JEOL) at 200 kV. Samples were ultrasonicated in ethanol for 10 min, vacuum dried, and loaded on an amorphous carbon-coated copper grid.
The MKPP magnetic hysteresis loop was recorded with a Physical Property Measurement System (PPMS) (model T-415, Cryogenic, USA) at 5 K and 300 K. Powdered samples were filled in gelatinous capsule and sealed with Teflon tape.
The FT-Raman spectra of KPP and MKPP were recorded with FT-Raman spectrometer (model Varian FT-Raman) in the range of 4000–100 cm−1.
2.2. Sorption procedure
Sorption equilibrium and dynamic studies were conducted. Sorption parameters are necessary to design a fixed-bed reactor. Biosorption studies for Pb2+ and Cd2+ removal were performed in batch and column modes (Fig. SM1†).In batch sorption experiments, a fixed adsorbent dose was agitated with 50 mL of adsorbate at a constant temperature and pH, and for specific time intervals (Fig. SM1†). The metal ion concentration was analyzed on an atomic absorption spectrometer (model Aanalyst 400, Perkin Elmer). Adsorption capacities were calculated using eqn (1).
 | (1) |
Kinetic and isotherm experiments were conducted to understand the thermodynamic adsorption behavior. A specific amount of adsorbent was added to 50 mL of adsorbate solution in the concentration range of 2–100 mg L−1 at temperatures 25, 35 and 45 °C. Sorption equilibrium and dynamics data were fitted to various isotherm models and rate equations.
Column experiments provide necessary parameters for scaling up fixed-bed reactors. Flow rate, bed-height, column width, and breakthrough time were obtained through column adsorption (Fig. SM1†).
(a) Pseudo-first-order model. The pseudo-first-order model is given in eqn (2).5,54,55
| qt = qe(1 − e−k1t) | (2) |
(b) Pseudo-second-order model. Pseudo-second-order adsorption (eqn (3)) is greatly influenced by the number of active sites on adsorbent surface.8,55
 | (3) |
2.3. Thermodynamic studies
The thermodynamic studies were performed at various Pb2+ and Cd2+ initial concentrations (10–100 mg L−1) at 25, 35, and 45 °C. The thermodynamic parameters, ΔS° (entropy), ΔG° (Gibbs free energy) and ΔH° (enthalpy), were evaluated using the eqn (4)–(6).56
ΔG° = −RT![[thin space (1/6-em)]](https://www.rsc.org/images/entities/char_2009.gif) ln ln![[thin space (1/6-em)]](https://www.rsc.org/images/entities/char_2009.gif) b b
| (4) |
 | (5) |
 | (6) |
2.4. Fixed-bed studies of Pb2+ removal and desorption
Adsorption isotherms are conventionally used for preliminary investigations and to know the operational parameters. However, it is essential to obtain a factual design model for practical applicability of biosorbents in column operations. A column (40.0 × 2.0 cm) was filled with KPP (30–50 B.S.S. mesh) with glass wool support (Fig. SM1†). The biosorbent (5 g) was slurried with hot water and fed slowly into the column to avoid air entrapment. The column was then loaded with the adsorbate (Pb2+), which percolated downward with a flow rate of 5.0 mL min−1. The bed height was 6.0 cm. The influent lead concentration and the solution pH were 10 mg L−1 and 4.5, respectively. Effluent samples were collected from the outlet of the column at different time intervals until the effluent lead concentration became nearly equal to the influent lead concentration. The adsorbent was regenerated using 0.1 N HCl by elution through the column as during the adsorption step.2.5. Application of KPP and MKPP biosorbents in an actual groundwater sample
Actual wastewater is often a complex system of multiple ions. During Pb2+ and Cd2+ adsorption, these other ions can compete for adsorption sites. The ions may change the adsorption efficiency of an adsorbent. The effect of interfering ions on Pb2+ and Cd2+ adsorption was tested on a groundwater sample collected from Khekra, Baghpat district Uttar Pradesh, India at latitude 28°52′00′′ N, and longitude 77°17′00′′. This groundwater sample was spiked with a concentration of 50 mg L−1 of both Pb2+ and Cd2+ solution. Adsorption studies were conducted at an adsorbent dose of 1 g L−1 (KPP) and 2 g L−1 (MKPP) at 25 °C for 24 h. After 24 h, the samples were filtered and analyzed for the concentrations of Na+, Ca2+, and Mg2+. The sample's conductivity was also measured after adsorption.2.6. Application of magnetic and non-magnetic biosorbents in multicomponent adsorption of Pb2+ and Cd2+
The adsorption capacity of MKPP and KPP for Pb2+ and Cd2+ from a multicomponent system containing more than one metal ion was examined in the batch mode. Adsorption experiments were conducted on equimolar ratios (1![[thin space (1/6-em)]](https://www.rsc.org/images/entities/char_2009.gif) :
:![[thin space (1/6-em)]](https://www.rsc.org/images/entities/char_2009.gif) 1
1![[thin space (1/6-em)]](https://www.rsc.org/images/entities/char_2009.gif) :
:![[thin space (1/6-em)]](https://www.rsc.org/images/entities/char_2009.gif) 1) of Pb2+, Cd2+ and Cu2+. The concentration range used was 2–100 mg L−1. Test solutions were made at pH 4.5 for Pb2+ adsorption. Studies were conducted at 25 °C by adding 1 g L−1 of adsorbent to 50 mL of each test solution. All samples were agitated for 24 h. After that, all the equilibrium pH values were measured. Then the Pb2+ and Cd2+ concentrations were analyzed.
1) of Pb2+, Cd2+ and Cu2+. The concentration range used was 2–100 mg L−1. Test solutions were made at pH 4.5 for Pb2+ adsorption. Studies were conducted at 25 °C by adding 1 g L−1 of adsorbent to 50 mL of each test solution. All samples were agitated for 24 h. After that, all the equilibrium pH values were measured. Then the Pb2+ and Cd2+ concentrations were analyzed.
3. Results and discussion
3.1. Characterization of KPP and MKPP
The BET surface areas of KPP and MKPP were 1.8 m2 g−1 and 52 m2 g−1, respectively, versus cupuassu shell (1.2 m2 g−1) [Fig. SM2(A and B)†].57 The surface area of agricultural residues is usually low.57 There was a sharp increase in surface area upon magnetization due to the presence of small bound iron oxide particles in MKPP [Fig. SM2(B)†]. The average pore diameter (BJH) of KPP and MKPP were 22.6 nm and 15.3 nm, respectively [Fig. SM3(A and B)†]. The average pore diameters of KPP and MKPP are mainly of the mesoporous type. The average pore volumes of KPP and MKPP were 0.01 cm3 g−1 and 0.20 cm3 g−1.KPP and MKPP showed acidic pHPZC values of 4.0 and 5.0, respectively [Fig. 2(a and b)]. Thus, KPP and MKPP have acidic surfaces with many oxygenated functional groups, including carboxylic acids, phenols, catechols, acidic alcohols, and enols on the biomass and surface Fe–OH groups on the iron oxide particles. The oxygen content was 40 and 32% for KPP and MKPP, respectively. Some of these oxygenated functional groups may form chelates with Pb2+ and Cd2+.
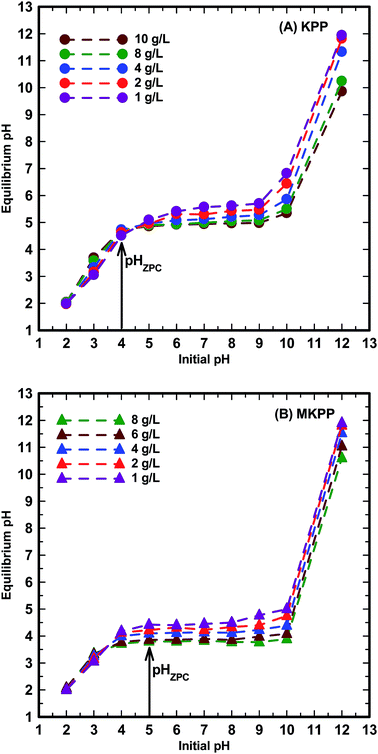 | ||
| Fig. 2 Effect of adsorbent amount on the equilibrium pH of the water with no Pb2+ and Cd2+ concentration onto (A) KPP and (B) MKPP. | ||
Elemental analyses of KPP and MKPP showed the presence of traces of S, P, Cl, K, Ca, Cu, and Zn (Table 1). A small wt% of iron (4%) was estimated in MKPP while none appeared in KPP. This demonstrated successful loading of iron oxide on KPP (Table 1).
| Properties | KPP | MKPP |
|---|---|---|
| Proximate analyses | ||
| Moisture (wt%) | 4.7 | 3.8 |
| Ash (wt%) | 0.06 | 12.5 |
| Volatile (wt%) | 49.6 | 44.6 |
| Fixed carbon (wt%) | 45.7 | 39.1 |
| Water holding capacity (%) | 44.5 | 52.9 |
![[thin space (1/6-em)]](https://www.rsc.org/images/entities/char_2009.gif) |
||
| Ultimate analyses | ||
| C (wt%) | 47.0 | 42.0 |
| H (wt%) | 6.3 | 5.5 |
| N (wt%) | 6.1 | 7.8 |
| O (wt%) | 40.6 | 32.3 |
![[thin space (1/6-em)]](https://www.rsc.org/images/entities/char_2009.gif) |
||
| Elemental analyses | ||
| S (ppm) | 181.4 | 1638 |
| P (ppm) | 108.1 | 838 |
| Cl (ppm) | 26.2 | 25.8 |
| K (ppm) | 37.7 | 5.9 |
| Ca (ppm) | 1961 | 1026 |
| Cu (ppm) | 10.6 | 18.4 |
| Zn (ppm) | 6.6 | 16.9 |
| Fe (%) | — | 4.02 |
![[thin space (1/6-em)]](https://www.rsc.org/images/entities/char_2009.gif) |
||
| Surface area characterization | ||
| SBET (m2 g−1) | 1.8 | 52.0 |
| VT (cm3 g−1) | 0.01 | 0.2 |
| Bulk density (cm3 g−1) | 0.18 | — |
| pHPZC | ∼4.0 | ∼5.0 |
XRD was employed to identify crystalline phases in KPP and MKPP. The degree of crystallinity for biomass has been reported in the range of 13–17% and 20–23% is due to cellulosic polymorphs.58,59 The 20–23% degree of crystallinity occurs as a broad diffusion peak attributed to two cellulosic polymorphs, waxes and the complex nature of bonding between these structures.58 X-ray diffraction of non-magnetic Kaniar pod powder (KPP) shows a broad peak (2θ = 22) due to the cellulose(II) crystalline form [Fig. 3(a)]. The width of this peak may be ascribed to the presence of other organic matter such as lignin and hemicellulosic.58,60 The other peaks at 2θ = 43.5°, 51.06°, 72.63° observed for this powder are assigned to cristobolite, quartz, and cristobolite quartz, respectively. The silica may be present both as cristobolite, and quartz. Other than silica, an intense calcite peak is also present at 2θ = 72.63°.60,61 Most silicate mineral components of biomass contribute to the plant's rigidness and posture. Mineral introduction into the plants can take place through both natural and anthropogenic routes. Majority of transport in plants is routed from soil, where minerals are in abundance.58 The iron oxide phase in MKPP, identified as magnetite (Fe3O4), has some intense iron oxide XRD peaks [Fig. 3(b)]. These characteristic magnetite peaks (2θ = 30.1, 35.4, 43.0, 57.0, and 62.5) and their indices [(220), (311), (400), (511), (440)] are observed in Fig. 3(b).
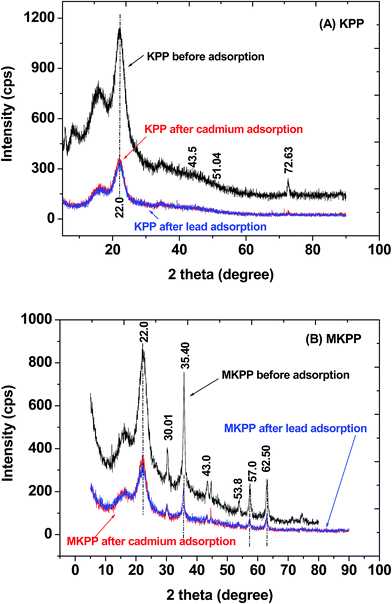 | ||
| Fig. 3 XRD spectra of (A) Kaniar pod powder (KPP) and (B) magnetized Kaniar pods powder (MKPP) before and after Pb2+ and Cd2+ adsorption. | ||
The other diffraction peak in KPP and MKPP near 30° is due to the presence of sulfate minerals. Another less intense peak, observed at 53.8°, corresponds to hematite.62 Hematite is also deposited in addition to magnetite in the magnetic biomass during the magnetization process. Use of iron sulfate during MKPP synthesis accounts for some hematite formation.58 XRD confirms iron oxide deposition occurs on the KPP surfaces.63
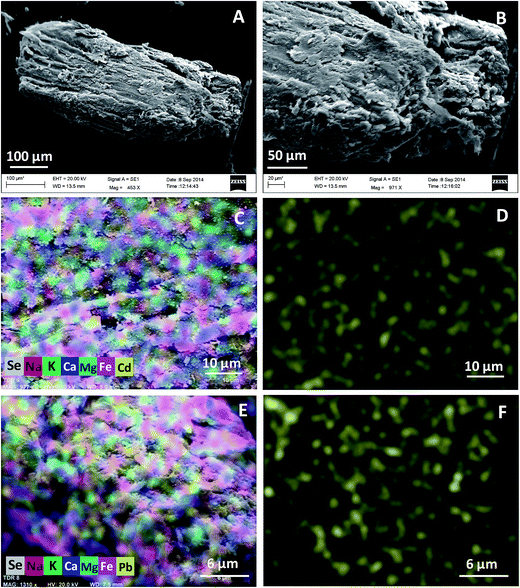
SEM micrographs of KPP and MKPP, before and after Pb2+ and Cd2+ adsorption, are shown in Fig. 4(A and B) and 5(A and B). KPP surfaces are rough, shiny and heterogeneous, with a rugged morphology [Fig. 4(A and B)]. This suggests potential for their Pb2+ and Cd2+ sorption within pores.64 The morphology of MKPP was entirely different from KPP [Fig. 5(A and B)]. MKPP appeared brighter than KPP.65 The cavernous openings seen for KPP in Fig. 4(B) appear to be smoothed over in MKPP (Fig. 5(B) and (C)). Nevertheless MKPP has the greater BET surface area.
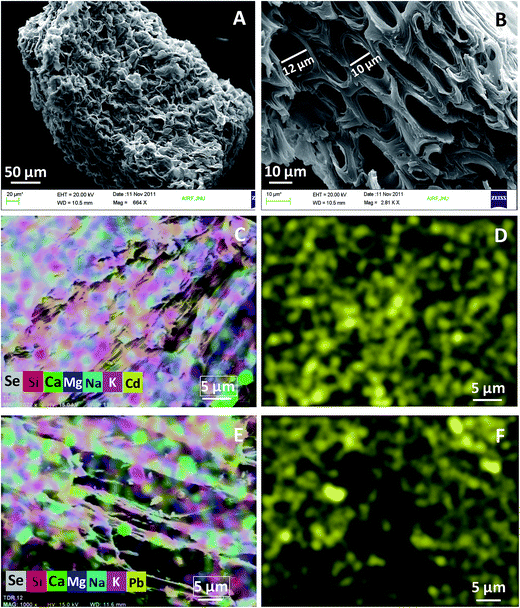 | ||
| Fig. 4 SEM micrographs of Kaniar pod powder (KPP) at (A) 664× (B) 2.81k× and SEM-mapping images of (C) multielements with Cd2+ and (D) Cd2+ (E) multielements with Pb2+ and (F) Pb2+ distribution. | ||
Fig. [4(C–F) and 5(C–F)] shows the spatial distribution of elements on KPP and MKPP, respectively, using SEM-EDX mapping. As seen in Fig. [4(D and F) and 5(D and F)], Cd2+ and Pb2+ are uniformly distributed over KPP and MKPP surfaces after their adsorption. However, surface Cd2+ and Pb2+ concentrations are greater on KPP than MKPP. This is evident by more dense yellow spots of Cd2+ and Pb2+ present on KPP than MKPP surfaces [Fig. 4(D and F) and 5(D and F)]. However, MKPP had more than 28 times as much BET measured surface area where adsorbed metal ions could be spread out on.
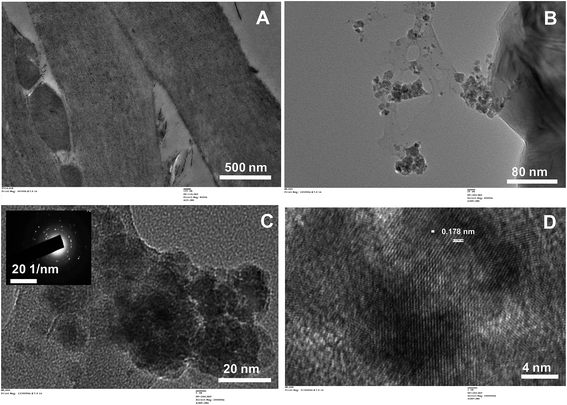
TEM micrographs of KPP are shown in Fig. 6(A). TEM and electron diffraction (ED) micrographs of MKPP are shown in Fig. 6(B–D). Fig. 6(C) inset shows the diffraction pattern obtained for MKPP. The lattice fringes of magnetite are also obtained [Fig. 6(D)]. The aggregation of MKPP primary particles may be due to the agglomerating tendency of the KPP portions of the exposed surfaces.66 The high-resolution TEM (HRTEM) image of the selected area shows a highly crystalline character with a well ordered lattice. This lattice structure observed by HRTEM is consistent with the iron oxide peak position in the XRD pattern [Fig. 6(D)]. The corresponding selected area electron diffraction (SAED) pattern [inset of Fig. 6(C)] displays aggregated semispherical particles indicating this hybrid biocomposite's polycrystalline nature.67
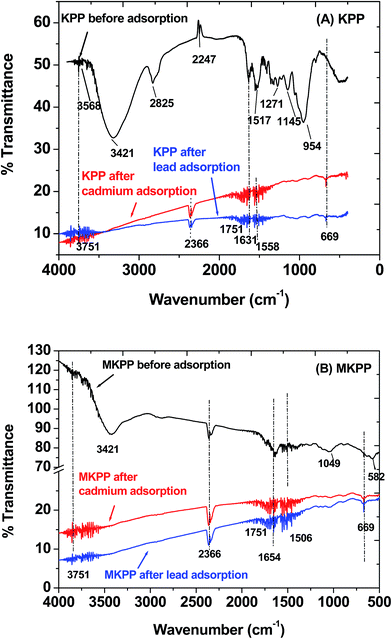
Fig. 7(A and B) shows FTIR spectra of KPP and MKPP before and after both Pb2+ and Cd2+ adsorption. KPP exhibited an intense broad band from about 3500–2700 cm−1 maximizing at 3421 cm−1. This is due to the combination of isolated and hydrogen-bonded aliphatic, phenolic, and carboxylic acid O–H stretching bands.68,69 Both sp2 C–H and sp3 C–H stretching are buried in this envelop in the 3100–2800 cm−1 region.70 Other bands were observed at 2247, 1751, 1517, 1271, 1145, 954 and 669 cm−1. These correspond, respectively, to CO2 at 2247 cm−1, carbonyl stretching at 1751 cm−1,65 sp2 C–O stretching of carboxylic acids and esters (1271 cm−1), ether and free alcohol sp3 C–O stretching (1000–1280 cm−1),58 and out-of-plane H-deformations on substituted phenyl rings (669 cm−1).71
Major FTIR peak shifts and disappearances were observed in the post-adsorption biosorbent samples. Peaks at 3568, 3500–2800, 2247, 1517, 1271, 1145, and 954 cm−1 disappeared and the quality of the spectra became very poor. New peaks at 2366, 1631, and 1558 cm−1 appeared after metal adsorption on KPP [Fig. 7(A and B)]. The decrease in free hydroxyl group intensity corresponds to Cd2+ coordination to carboxylic acid, phenolic and other possible sites. Smaller changes are observed in Fig. 7 after Pb2+ biosorption. The FTIR spectrum is consistent with Pb2+ coordination or chelation to carbonyl and other hydroxyl sites on the surface. The FTIR spectra of MKPP (pristine and loaded) exhibit the same before-to-after type changes upon sorption of Pb2+ and Cd2+ [Fig. 7(B)]. Iron oxide deposition alone on lowers the quality of the spectrum of the biostructure portion of the adsorbent. Coordination of Pb2+ and Cd2+ with carboxylic acids lowers the carbonyl stretching frequency and broadens this 1800–1700 cm−1 region. The fact these bands largely disappear in both Fig. 7(A and B) may correspond to this coordination.
The Raman spectra of pristine and loaded KPP and MKPP are shown in Fig. SM4(A and B).† KPP's Raman bands at 3174, 3005, and 2677 cm−1 are C–H stretching vibrations.72 sp2 C–H (aromatic and olefin) stretching were observed at 3025 and 3006 cm−1.73 Peaks at 3174 and 3005 cm−1 in both KPP and MKPP were observed. The deformation vibration (scissoring mode) of the CH2 group appears in the 1450–1480 cm−1 region.74 The band at 1465 cm−1 in KPP and MKPP may be due to the CH2 group. The bands observed from 950 to 1150 cm−1 are assigned to stretches of skeletal rings of cellulosic, hemicellulosic, lignin and glycosidic C–O and alcoholic C–O bonds.58,74
After adsorption of Pb2+ and Cd2+ by KPP and MKPP, the FT-Raman spectra looked very similar to the spectra before adsorption. These spectra are not useful in trying to understand any specifics about the adsorption process at the surface.
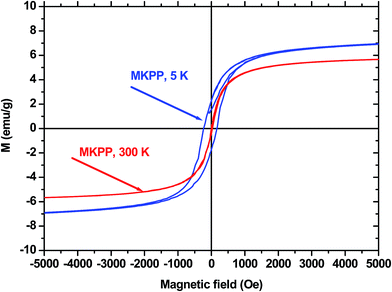
The saturation magnetization (Ms) of the composite was investigated at 5 K and 300 K using a using a physical property measurement system (PPMS) with an applied field range of −8000 Oe ≤ H ≤ 8000 Oe for quantitative confirmation of the adsorbent's magnetization. The magnetic hysteresis loop of MKPP is shown in Fig. 8. The MKPP sample is ferromagnetic. The Ms values were 5.98 emu g−1 and 8.38 emu g−1 at 300 K and 5 K, respectively. MKPP responded well when removed by a laboratory magnet from batch slurry adsorption experiments. The Ms values confirm convenient magnetic separations of exhausted adsorbent are possible from many media.
3.2. Effect of initial pH
The effect of pH on Pb2+ and Cd2+ adsorption onto KPP and MKPP is shown in Fig. 9(A and B). Adsorption of metals is a pH-dependent process as the surface charge and the metal speciation are both affected by the solution pH. The solution pH affects the degree of dissociation of the carboxyl and hydroxyl functional groups of the adsorbent and the solubility of metal ions.75,76 Sorption of Pb2+ and Cd2+ on MKPP and KPP were restricted to the pH range from 2.0 to 6.0 to avoid metal ion precipitation. Lead and cadmium exist as Pb2+ and Cd2+ ions at pH 4.5 and 5.0, respectively.76 Pb2+ and Cd2+ sorption increased significantly as pH increased from 2 to 4 and then modestly increased from 4.0 to 6.0. The Pb2+ and Cd2+ ions may undergo solvation, hydrolysis and polymerization to insoluble hydroxide/oxide species at pH 7.0, where precipitation can ensue (eqn (7)–(9)).5
M2+ + nH2O ⇄ ![[thin space (1/6-em)]](https://www.rsc.org/images/entities/char_2009.gif) M(H2O)n2+ M(H2O)n2+
| (7) |
M(H2O)n2+ ⇄ ![[thin space (1/6-em)]](https://www.rsc.org/images/entities/char_2009.gif) M(H2O)n−1(OH+) + H+ M(H2O)n−1(OH+) + H+
| (8) |
| nM2+ + mH2O ⇄ Mn(OH)m(2n−m) + mH+ | (9) |
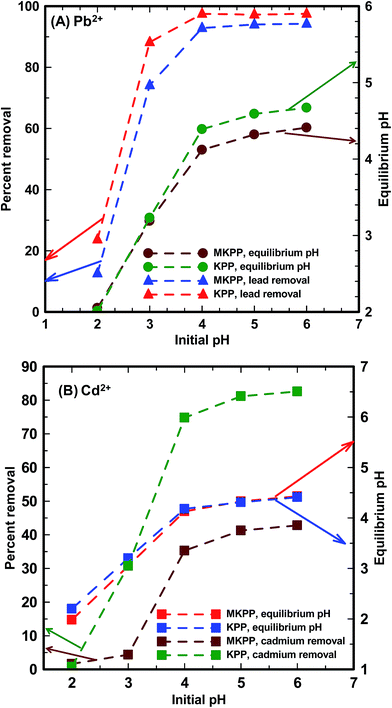 | ||
| Fig. 9 Effect of pH on (A) Pb2+ and (B) Cd2+ removal by KPP and MKPP [initial Pb2+ and Cd2+ concentration = 10 mg L−1; adsorbent dose = 2 g L−1; particle size = 30–50 B.S.S. mesh; T = 25 °C]. | ||
The pH dependent adsorption of Pb2+ and Cd2+ between 2 to 6 occurs due to progressive deprotonation of KPP and MKPP surfaces. At pH 2.0, the biomass surface is positively charged and repels Pb2+ and Cd2+, resulting in low metal uptake.77 As pH raises, carboxylic acids, enols, and acidic alcohols on the adsorbent loose protons, and the surface becomes more negatively charged. This attracts and binds Pb2+ and Cd2+. As negative charge density increases at the surface, more Pb2+ and Cd2+ are adsorbed. Carboxylic acids are most acidic and lose protons first, followed by acidic alcohol sites. At higher pH, phenols are increasing converted to phenoxide sites, but this effect will occur most strongly from pH 7.5–10.0, beyond the pH range studied. In MKPP, magnetite surfaces contain Fe–OH groups. These groups also deprotonate progressively as pH rises or increasingly protonate at low pH. Thus, varying solution pH biases both surface charging and attraction or repulsion of Pb2+ and Cd2+ of the magnetic surface similar to the biological cell walls of KPP. The individual functional group protonation/deprotonation equilibria are all occurring as a function of solution pH and within the surface-wide context of the pHZPC, which have values of 5.0 for KPP and 4.0 for MKPP [Fig. 2(A and B)].
Maximum Pb2+ and Cd2+ removal occurred at pH 4.5 and 5.0 for KPP and MKPP, respectively [Fig. 9(A and B)]. At a metal concentration of 10 mg L−1 and a 2 g L−1 adsorbent dose, Pb2+ removal increased from 24 to 98% for KPP and 13 to 83% for MKPP when pH rose from 2.0 to 6.0. Similarly, Cd2+ removal went up from 1 to 83% using KPP and 2 to 43% using MKPP upon increasing the initial pH from 2.0 to 6.0. Above the adsorbents' pHPZC the surface is negatively charged. Here, much more metal adsorption was observed. When KPP and MKPP was used to adsorb Pb2+ and Cd2+ at pH > pHZPC, the solution equilibrium pH dropped. This occurs because deprotonation of the adsorbent's acidic functional groups releases H3O+ as metal cations are adsorbed.5,8 Therefore, all the kinetic and equilibrium sorption experiments of were carried out at pH 4.5 and 5.0.
3.3. Cd2+ and Pb2+ sorption mechanism
Agricultural crop residues contain cellulose, lignin, lipids, proteins, simple sugars, starches, functional group-rich compounds that can bind heavy metals.78 Specifically, seed pods constituting KPP and MKPP contain a rich variety of secondary metabolite compounds including glycosides, flavenoids, phenolic compounds, oxepins, fatty acids and phytosterols.79 We thought these would uniquely contribute to metal chelation and sorption. Previously, mechanisms have been proposed for aqueous Pb2+ and Cd2+ remediation,4,5,80 which included electrostatic attraction–repulsion interactions, ion exchange, functional group–metal complex formation, H-bonding, and chelation.81 The presence of so many components in Bauhinia purpurea which can chelate metals has focused our attention on the compounds which have been identified in this species as example adsorbents.79 Fig. 10 shows two of these more unique specific compounds from Bauhinia purpurea and a surface carboxylic acid as sample adsorption site for either Pb2+ or Cd2+. Of course many other specific adsorption sites exist.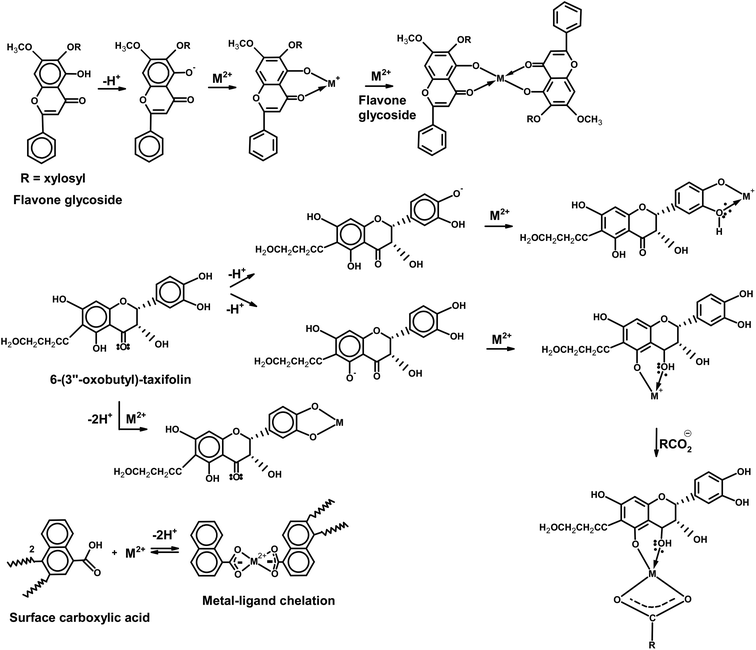 | ||
| Fig. 10 Example Pb2+ and Cd2+ sorption complexes possible to representative chelating compounds present in KPP and MKPP. | ||
Chelation of M2+ ions are shown by several functions in Fig. 10. o-Keto phenol functions in both the xylosyl flavone and taxifolin can singly or doubly chelate M2+ ions with the release of protons to solution. Likewise, the catechol function (shown here in taxifolin) can chelate to bind either M2+ to generate M+ or further to neutral complexes. Alternatively, a single carboxylate can combine with another chelating function to immobilize to metal. Metal–ligand chelation by oxygens is the major interaction in the 4.5–5.0 pH range.81 A possible mechanism for M2+ on the magnetite portion of MKPP is shown in Fig. 11, where surface Fe–OH or Fe–O– sites actively bind Cd2+ and Pb2+ ions.
3.4. Pb2+ and Cd2+ sorption dynamics
The Pb2+ and Cd2+ sorption efficiency as a function of biomass dosage was investigated. Fig. SM5 and SM6† show the effect of sorbent dose on Pb2+ and Cd2+ removal. Both Pb2+ and Cd2+ uptake increased at higher adsorbent dose, because more adsorption sites were available. A significant jump in Cd2+ removal was observed on increasing KPP dose from 0.5 to 1.0 g L−1. No further uptake occurred on introducing an additional 1.0 g L−1 of KPP (Fig. SM6†). Similar behavior was observed for MKPP (Fig. SM6†). The maximum sorption percentage achieved by KPP and MKPP reached 96% and 79%, respectively for Cd(II) at a biomass concentration of 0.5 g L−1. Therefore, 1.0 and 2.0 g L−1 dosage amounts were selected for KPP and MKPP, respectively in all subsequent equilibrium and dynamic experiments. Pb2+ sorption studies were carried out at 0.1, 1.0 and 4.0 g L−1 dosages for KPP and MKPP. Dosage of 1.0 and 2.0 g L−1 resulted in 96% and 97% Pb2+ removal by KPP and MKPP, respectively. Further dose increments did not show any further significant uptake. Thus, all dynamic and equilibrium studies were performed at 1.0 and 2.0 g L−1 dosage for KPP and MKPP, respectively. The effect of initial Cd2+ and Pb2+ concentrations were investigated (Cd2+: 10, 20 and 50 mg L−1; Pb2+: 10, 30 and 60 mg L−1). Cd2+ and Pb2+ removal increased on increasing initial adsorbate concentrations, due to the availability of more adsorbate ions and their higher concentrations [Fig. SM7 and SM8†]. The effect of temperature was also investigated [Fig. SM9 and SM10†].Sorption dynamics data were fitted to pseudo-first-order54 and second-order55 equations (Fig. SM11–SM14† and Table 2). The pseudo-second-order equation best fit the dynamics data at various adsorbent dosages and initial metal concentrations. Higher correlation coefficients (>0.99) were obtained using the second-order equation (Table 2). Experimental ‘qe’ values were similar to theoretical ‘qe’ values obtained using pseudo-first-order equation (Table 2). Similar results were reported for Pb(II)82 and Zn(II) biosorption.83 Therefore, chemisorption was the rate determining step for Cd2+ and Pb2+ removal by KPP and MKPP.
| Values | First order rate constant, k1 (h−1) | R2 | First order rate constant, k1 (h−1) | R2 | Second order rate constant, k2 (mg g−1 h−1) | R2 | Second order rate constant, k2 (mg g−1 h−1) | R2 | qe experimental (mg g−1) | qe calculated using first order kinetic model (mg g−1) | qe calculated using second order kinetic model (mg g−1) | ||||
|---|---|---|---|---|---|---|---|---|---|---|---|---|---|---|---|
| KPP | MKPP | KPP | MKPP | KPP | MKPP | KPP | MKPP | KPP | MKPP | KPP | MKPP | ||||
| At different adsorbent dose (g L−1), Pb2+ | |||||||||||||||
| 0.5 | 0.5 | 0.18 | 0.52 | 0.078 | 0.85 | 0.12 | 0.99 | 0.064 | 0.99 | 17.24 | 15.56 | 3.39 | 4.84 | 17.54 | 15.65 |
| 1 | 2 | 0.24 | 0.62 | 0.140 | 0.93 | 0.35 | 0.99 | 0.17 | 0.99 | 9.08 | 4.46 | 1.74 | 2.13 | 9.17 | 4.58 |
| 4 | 4 | 0.15 | 0.45 | 0.108 | 0.43 | 4.45 | 1 | 1.38 | 0.99 | 2.32 | 2.07 | 0.11 | 0.270 | 2.33 | 2.08 |
![[thin space (1/6-em)]](https://www.rsc.org/images/entities/char_2009.gif) |
|||||||||||||||
| At different adsorbent dose (g L−1), Cd2+ | |||||||||||||||
| 0.5 | 1 | 0.047 | 0.04 | 0.009 | 0.00 | 0.2 | 0.98 | 0.903 | 0.99 | 14.84 | 3.12 | 1.52 | 0.71 | 14.49 | 3.25 |
| 1 | 2 | 0.085 | 0.09 | 0.067 | 0.29 | 0.45 | 0.99 | 0.282 | 0.99 | 10.70 | 4.47 | 1.36 | 0.65 | 10.31 | 3.80 |
| 2 | 4 | 0.023 | 0.02 | 0.157 | 0.52 | 0.85 | 0.99 | 0.238 | 0.98 | 7.28 | 3.70 | 0.62 | 1.23 | 2.33 | 4.52 |
![[thin space (1/6-em)]](https://www.rsc.org/images/entities/char_2009.gif) |
|||||||||||||||
| At different Pb2+ concentrations (mg L−1) | |||||||||||||||
| 10 | 0.140 | 0.31 | 0.099 | 0.23 | 0.48 | 0.99 | 0.48 | 0.99 | 8.82 | 4.09 | 0.90 | 0.67 | 8.92 | 4.20 | |
| 20 | 0.898 | 0.61 | 0.075 | 0.34 | 0.12 | 0.99 | 0.22 | 0.99 | 16.94 | 7.42 | 3.40 | 1.70 | 17.24 | 7.52 | |
| 50 | 0.108 | 0.49 | 0.085 | 0.51 | 0.09 | 0.99 | 0.14 | 0.99 | 27.89 | 14.54 | 4.18 | 2.97 | 28.57 | 14.92 | |
![[thin space (1/6-em)]](https://www.rsc.org/images/entities/char_2009.gif) |
|||||||||||||||
| At different Cd2+ concentrations (mg L−1) | |||||||||||||||
| 10 | 0.122 | 0.74 | −0.087 | 0.11 | 0.213 | 0.99 | 0.35 | 0.92 | 7.47 | 4.22 | 2.17 | 0.71 | 7.51 | 4.01 | |
| 30 | 0.163 | 0.78 | −0.030 | 0.11 | 0.094 | 0.99 | 0.85 | 0.98 | 16.18 | 7.38 | 4.42 | 0.64 | 16.66 | 7.30 | |
| 60 | 0.057 | 0.28 | −0.009 | 0.03 | — | 0.99 | 0.72 | 0.99 | 22.59 | 9.74 | 1.97 | 1.24 | 22.22 | 9.61 | |
3.5. Pb2+ and Cd2+ sorption equilibrium
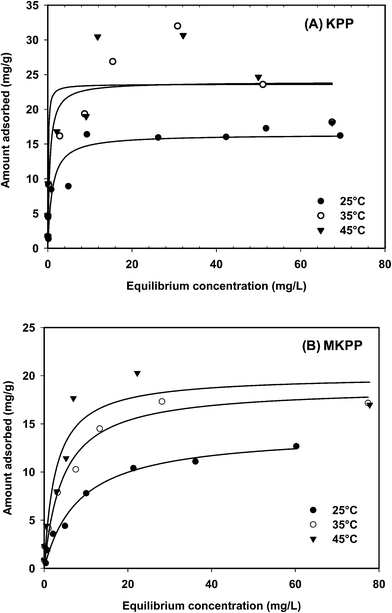
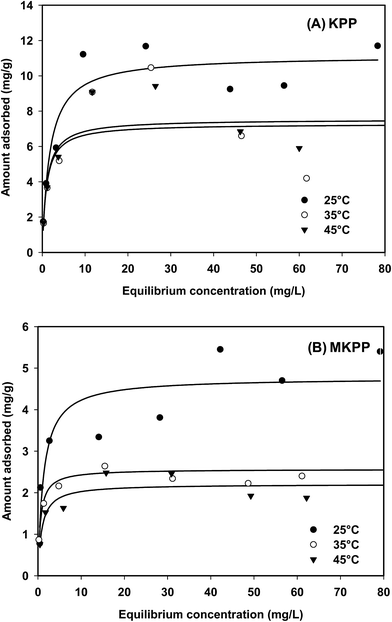
Sorption equilibrium studies were conducted at 25°, 35° and 45 °C for Cd2+ (initial pH = 4.5) and Pb2+ (initial pH = 5.0) [Fig. 12 and 13]. The initial Cd2+ and Pb2+ concentration range was 2–100 mg L−1 and equilibrium time was 24 h [Fig. 13 and 14]. Sorption equilibrium data were fitted to Langmuir [Fig. 12 and 13],47 Freundlich,46 Redlich–Peterson,50 Radke–Prausnitz,51 Toth,52 Koble–Corrigan,53 Sips,49 and Temkin48 equations (Table SM1†) using MATLAB (non-linear least square method) (Fig. SM15–SM18†).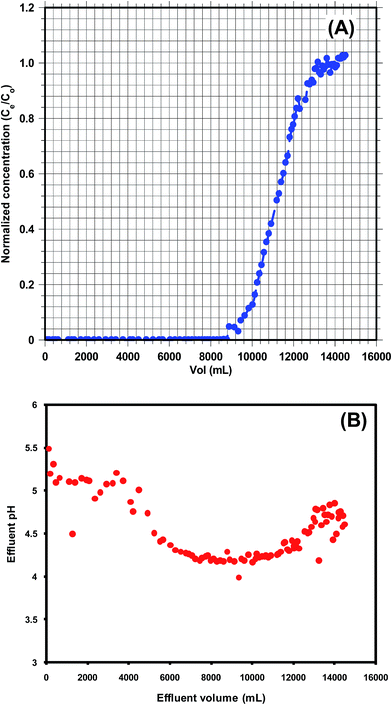 | ||
| Fig. 14 (A) KPP breakthrough curve (particle size = 30–50 B.S.S. mesh, Pb2+ concentration = 10 mg L−1, initial pH = 4.5) and (B) effluent pH curve for Pb2+ adsorption by KPP. | ||
Cd2+ uptake decreased with a temperature rise, whereas Pb2+ removal was generally unaltered by temperature. The Langmuir adsorption isotherm47,84 equation described Pb2+ and Cd2+ sorption on both KPP and MKPP, respectively, better than other isotherms. The Langmuir model had high R2 [Fig. 12 and 13]. Moreover, Langmuir isotherms were also used to determine a dimensionless constant separation factor RL [RL = 1/(1 + bC0); RL > 1 unfavorable; RL = 1 linear; 0 < RL < 1 favorable and RL = 0 irreversible]. RL predicts whether the adsorption is favorable and unfavorable.85,86 The RL values lie between 0 and 1 indicating that Pb2+ and Cd2+ adsorption on both KPP and MKPP is favorable.
The nonlinear Freundlich adsorption isotherms are given in Fig. SM15 and SM17† while the parameters are reported in Table 3. The 1/n values obtained for Pb2+ and Cd2+ adsorption on KPP and MKPP were between 0.1 and 0.5, indicating favorable adsorption. Among the three parameter equations, the Sips model best fitted (high R2) the Pb2+ sorption data on KPP and MKPP (Table 3). Therefore, Pb2+ adsorption on KPP and MKPP was diffusion controlled at low metal-ion concentrations and followed monomolecular adsorption at high concentrations.5 Sorption data were also fitted to Redlich–Peterson and Radke–Prausnitz equations (Table 3).
| Isotherm parameters | Pb2+ | Cd2+ | ||||||||||
|---|---|---|---|---|---|---|---|---|---|---|---|---|
| KPP | MKPP | KPP | MKPP | |||||||||
| 25 °C | 35 °C | 45 °C | 25 °C | 35 °C | 45 °C | 25 °C | 35 °C | 45 °C | 25 °C | 35 °C | 45 °C | |
| Freundlich | ||||||||||||
| KF (mg g−1) | 7.61 | 15.20 | 16.78 | 1.99 | 1.50 | 1.30 | 4.94 | 4.38 | 4.34 | 1.99 | 1.52 | 1.31 |
| 1/n | 0.21 | 0.13 | 0.10 | 0.23 | 0.14 | 0.13 | 0.20 | 0.12 | 0.13 | 0.22 | 0.13 | 0.13 |
| R2 | 0.85 | 0.76 | 0.74 | 0.86 | 0.76 | 0.59 | 0.74 | 0.25 | 0.40 | 0.87 | 0.75 | 0.59 |
![[thin space (1/6-em)]](https://www.rsc.org/images/entities/char_2009.gif) |
||||||||||||
| Langmuir | ||||||||||||
| Qo (mg g−1) | 16.37 | 23.94 | 23.61 | 14.14 | 18.81 | 20.01 | 11.13 | 7.28 | 7.54 | 4.76 | 2.56 | 2.20 |
| b | 0.97 | 2.10 | 11.11 | 0.12 | 0.22 | 0.37 | 0.58 | 1.04 | 1.00 | 0.78 | 1.76 | 1.13 |
| R2 | 0.92 | 0.78 | 0.76 | 0.98 | 0.97 | 0.90 | 0.89 | 0.50 | 0.69 | 0.81 | 0.81 | 0.78 |
![[thin space (1/6-em)]](https://www.rsc.org/images/entities/char_2009.gif) |
||||||||||||
| Sips | ||||||||||||
| KLF (L g−1) | 13.20 | 34.04 | 54.03 | 2.09 | 5.21 | 5.98 | 6.24 | 6.85 | 6.99 | 1.93 | 4.73 | 2.56 |
| aLF (L mg−1) aLF | 0.49 | 1.52 | 4.28 | 0.08 | 0.18 | 0.35 | 0.58 | 0.97 | 0.96 | 1 × 10³ | 2.15 | 1.12 |
| nLF | 0.56 | 0.62 | 0.49 | 0.83 | 0.81 | 1.15 | 1.06 | 1.39 | 1.31 | 0.28 | 0.86 | 1.04 |
| R2 | 0.90 | 0.80 | 0.78 | 0.98 | 0.97 | 0.90 | 0.88 | 0.52 | 0.70 | 0.86 | 0.91 | 0.77 |
![[thin space (1/6-em)]](https://www.rsc.org/images/entities/char_2009.gif) |
||||||||||||
| Redlich–Peterson | ||||||||||||
| KRP (L g−1) | 39.68 | 5.87 | 10.30 | 2.21 | 3.96 | 3.48 | 4.16 | 1.65 | 2.29 | 9.60 | 6.95 | 2.05 |
| aRP (L mg−1) βRP | 3.67 | 0.06 | 0.18 | 0.24 | 0.19 | 0.04 | 0.22 | 0.01 | 0.05 | 3.73 | 3.32 | 0.81 |
| βRP | 0.89 | 1.34 | 1.21 | 0.89 | 1.02 | 1.35 | 1.12 | 1.70 | 1.43 | 0.83 | 0.94 | 1.03 |
| R2 | 0.89 | 0.79 | 0.75 | 0.98 | 0.97 | 0.94 | 0.90 | 0.80 | 0.89 | 0.88 | 0.84 | 0.79 |
![[thin space (1/6-em)]](https://www.rsc.org/images/entities/char_2009.gif) |
||||||||||||
| Temkin | ||||||||||||
| bTe (J mol−1) | 1.15 | 0.96 | 1.20 | 3.42 | 189.50 | 146.45 | 1.53 | 3.20 | 2.99 | 3.43 | 8.91 | 10.67 |
| aTe (L mg−1) | 47.00 | 260.68 | 2135.41 | 16.14 | 8.90 | 10.67 | 17.41 | 146.91 | 90.23 | 16.15 | 189.49 | 146.45 |
| R2 | 0.89 | 0.78 | 0.76 | 0.87 | 0.79 | 0.65 | 0.82 | 0.31 | 0.49 | 0.87 | 0.80 | 0.65 |
![[thin space (1/6-em)]](https://www.rsc.org/images/entities/char_2009.gif) |
||||||||||||
| Koble–Corrigan | ||||||||||||
| AKC | 13.2 | 34.0 | 53.97 | 2.13 | 5.20 | 5.79 | 6.24 | 6.87 | 6.98 | 2.35 | 3.75 | 2.50 |
| BKC | 0.68 | 1.30 | 2.02 | 0.14 | 0.25 | 0.29 | 0.56 | 0.96 | 0.94 | 0.19 | 1.39 | 1.13 |
| nKC | 0.56 | 0.62 | 0.48 | 0.83 | 0.81 | 1.16 | 1.06 | 1.36 | 1.30 | 0.31 | 0.71 | 1.01 |
| R2 | 0.90 | 0.80 | 0.78 | 0.98 | 0.97 | 0.88 | 0.89 | 0.51 | 0.70 | 0.87 | 0.83 | 0.78 |
![[thin space (1/6-em)]](https://www.rsc.org/images/entities/char_2009.gif) |
||||||||||||
| Toth | ||||||||||||
| KT | 15.89 | 50.31 | 262.20 | 1.70 | 4.17 | 5.14 | 6.45 | 7.63 | 7.56 | 3.74 | 4.52 | 2.50 |
| BT | 0.97 | 2.10 | 11.11 | 0.12 | 0.22 | 0.20 | 0.58 | 1.05 | 1.00 | 0.78 | 1.76 | 1.13 |
| βT | −6.49 | −126.2 | −68.77 | 0.52 | 0.35 | 0.23 | 0.59 | 0.19 | 0.92 | 0.11 | 0.71 | 0.52 |
| R2 | 0.86 | 0.78 | 0.76 | 0.98 | 0.96 | 0.90 | 0.89 | 0.50 | 0.69 | 0.81 | 0.82 | 0.78 |
![[thin space (1/6-em)]](https://www.rsc.org/images/entities/char_2009.gif) |
||||||||||||
| Radke and Prausnitz | ||||||||||||
| A (L g−1) | 39.68 | 76.28 | 361.60 | 2.20 | 1.46 × 10⁴ | 7.66 | 4.16 | 1.65 | 2.29 | 9.60 | 6.90 | 2.05 |
| b ((mg1−β Lβ) g−1) | 10.82 | 20.65 | 20.45 | 9.09 | 4.18 | 19.20 | 18.41 | 112.60 | 41.37 | 2.57 | 2.09 | 2.53 |
| β | 0.11 | 0.04 | 0.05 | 0.10 | 0.36 | 0.01 | −0.13 | −0.70 | −0.43 | 0.16 | 0.05 | −0.03 |
| R2 | 0.89 | 0.79 | 0.77 | 0.98 | 0.87 | 0.90 | 0.90 | 0.80 | 0.89 | 0.88 | 0.84 | 0.79 |
3.6. Thermodynamics behavior
Studies performed at different temperatures are presented in Fig. 12 and 13.The amount of Pb2+ adsorption onto both KPP and MKPP increases with a rise in temperature. Cd2+ adsorptions onto KPP and MKPP exhibit the opposite behavior as adsorption diminishes with an increase in temperature. All four processes are spontaneous. ΔG° is negative for Pb2+ and Cd2+ adsorption onto both KPP and MKPP and the thermodynamic parameters are given in Table 4. ΔH° is positive for Pb2+ adsorption on KPP and MKPP, confirming the endothermic nature, while the negative ΔH° obtained for Cd2+ adsorption on KPP and MKPP confirming exothermic nature. Positive ΔS° values for both Pb2+ and Cd2+ adsorption on KPP and MKPP suggested an increase randomness with some structural or solvation changes occurring at solid/liquid interface.56
| Metal ions | KPP | MKPP | ||||||||
|---|---|---|---|---|---|---|---|---|---|---|
| ΔG° (kJ mol−1) | ΔH° (kJ mol−1) | ΔS° (kJ mol−1 K−1) | ΔG° (kJ mol−1) | ΔH° (kJ mol−1) | ΔS° (kJ mol−1 K−1) | |||||
| 25 °C | 35 °C | 45 °C | 25 °C | 35 °C | 45 °C | |||||
| Pb2+ | −34.2 | −37.3 | −42.9 | 59.1 | 0.31 | −29.0 | −31.5 | −33.9 | 46.9 | 0.25 |
| Cd2+ | −32.9 | −35.4 | −36.6 | −3.6 | 0.10 | −33.6 | −36.8 | −36.9 | −35.9 | 0.003 |
3.7. Cd2+ and Pb2+ sorption in a multicomponent system
Adsorption in multi-component systems is a complex process. Therefore, simultaneous adsorption of Pb2+, Cu2+, and Cd2+ was carried-out in a ternary system. Adsorption isotherms were obtained at pH 4.5 (KPP) and 5.0 (MKPP) at 25 °C over a concentration range of 5–150 mg L−1 using a Pb2+![[thin space (1/6-em)]](https://www.rsc.org/images/entities/char_2009.gif) :
:![[thin space (1/6-em)]](https://www.rsc.org/images/entities/char_2009.gif) Cu2+
Cu2+![[thin space (1/6-em)]](https://www.rsc.org/images/entities/char_2009.gif) :
:![[thin space (1/6-em)]](https://www.rsc.org/images/entities/char_2009.gif) Cd2+ ratio of 1
Cd2+ ratio of 1![[thin space (1/6-em)]](https://www.rsc.org/images/entities/char_2009.gif) :
:![[thin space (1/6-em)]](https://www.rsc.org/images/entities/char_2009.gif) 1
1![[thin space (1/6-em)]](https://www.rsc.org/images/entities/char_2009.gif) :
:![[thin space (1/6-em)]](https://www.rsc.org/images/entities/char_2009.gif) 1. The percent Pb2+ and Cd2+ removal for KPP and MKPP, respectively, in the ternary system is shown in Fig. SM19 and SM20.† A Pb2+ removal of 20% to 80% and 15 to 50% for KPP and MKPP was observed, respectively [Fig. SM19 and SM20(A and B)†]. Obviously, the presence of both Cu2+ and Cd2+ interfere in Pb2+ adsorption. A similar trend was observed for Cd2+ (10–90% for KPP and 10–80% for MKPP) [Fig. SM19 and SM20(A and B)†]. More interference was observed for Cd2+ adsorption for this ternary system in the high concentration range. Overall, copper is expected to compete vigorously with both Pb2+ and Cd2+ for adsorption sites. It exhibits similar columbic responses and four-coordinate complexation chemistries with Pb2+ and Cd2+.
1. The percent Pb2+ and Cd2+ removal for KPP and MKPP, respectively, in the ternary system is shown in Fig. SM19 and SM20.† A Pb2+ removal of 20% to 80% and 15 to 50% for KPP and MKPP was observed, respectively [Fig. SM19 and SM20(A and B)†]. Obviously, the presence of both Cu2+ and Cd2+ interfere in Pb2+ adsorption. A similar trend was observed for Cd2+ (10–90% for KPP and 10–80% for MKPP) [Fig. SM19 and SM20(A and B)†]. More interference was observed for Cd2+ adsorption for this ternary system in the high concentration range. Overall, copper is expected to compete vigorously with both Pb2+ and Cd2+ for adsorption sites. It exhibits similar columbic responses and four-coordinate complexation chemistries with Pb2+ and Cd2+.
3.8. Pb2+ and Cd2+ removal from actual groundwater
Natural water systems contain a complex mixture of ions. These may also interfere with Pb2+ or Cd2+ during adsorption on KPP and MKPP. Thus, Pb2+ or Cd2+ removal from groundwater samples, collected from Khekra Village, Baghpat District, Uttar Pradesh, India, by KPP and MKPP was investigated. The physicochemical characteristics of this groundwater are shown in Table 5. An additional 50 mg L−1 of either Cd2+ or Pb2+ was spiked into this water sample. Initial pHs were adjusted to 4.5 and 5.0 for Pb2+ and Cd2+, respectively. A predetermined dose of KPP (1 g L−1) or MKPP (2 g L−1) was added to each sample. After 48 h, the samples were filtered and the Cd2+ and Pb2+ concentrations analyzed. Cd2+ and Pb2+ concentrations were reduced by adsorption (Table 5), showing both KPP and MKPP could be successfully removed Cd2+ and Pb2+ from groundwater.| Parameters | Pb2+ | Cd2+ | ||||
|---|---|---|---|---|---|---|
| Initial concentration | Concentration after treatment with KPP | Concentration after treatment with MKPP | Initial concentration | Concentration after treatment with KPP | Concentration after treatment with MKPP | |
| Pb2+ (mg L−1) | 42.81 | 31.24 | 27.81 | — | — | — |
| Cd2+ (mg L−1) | — | — | — | 48.65 | 38.24 | 37.36 |
| Initial pH | 4.5 | 4.57 | 3.96 | 5 | 5.21 | 3.99 |
| Conductivity (ms cm−1) | 3.54 | 3.46 | 3.55 | 1045 | 1070 | 1091 |
| Salinity (ppt) | 1.8 | 1.8 | 1.9 | 0.5 | 0.5 | 0.5 |
| TDS (mg L−1) | 1683 | 1706 | 1746 | 514 | 526 | 535 |
| Na+ (mg L−1) | 69.9 | 56.1 | 66.5 | 66.7 | 13.8 | 15.3 |
| K+ (mg L−1) | 3.5 | 2.9 | 2.9 | 2.7 | 0.1 | 0.2 |
| Ca2+ (mg L−1) | 16.68 | 16.7 | 20 | 17.56 | 8.2 | 8 |
| Mg2+ (mg L−1) | 50.05 | 48.6 | 48.93 | 50.03 | 49.59 | 48.93 |
| Iron (mg L−1) | 0.025 | 0.045 | 0.672 | 0.013 | 0.024 | 0.782 |
3.9. Column studies
 | (10) |
 | (11) |
 | (12) |
 | (13) |
 | (14) |
 | (15) |
 | (16) |
 | (17) |
 | (18) |
| Parameters | Values |
|---|---|
| C0 (mg mL−1) | 0.00822 |
| Cx (mg mL−1) | 0.00793 |
| Cb (mg mL−1) | 0.00026 |
| Vx (mg cm−2) | 33.36 |
| Vb (mg cm−2) | 0.74 |
| Fm (mg cm−2 min−1) | 0.01 |
| D (cm) | 6 |
| tx (min) | 3092 |
| tδ (min) | 3023 |
| tb (min) | 2216 |
| F | 0.27 |
| δ (cm) | 1.7 |
| Saturation (%) | 79.23 |
| Usage rate (kg L−1) | 0.0005 |
| EBCT (min) | 5.56 |
The column capacity was slightly higher (18.8 mg g−1) than batch capacity (16.4 mg g−1) for Pb2+ removal. This is because a large Pb2+ concentration gradient is continuously present at KPP interface.
pH changes occurred during column experiments. The equilibrium pH initially increased to 5.5, possibly because of adsorption of the H3O+ from the solution. Furthermore, equilibrium pH decreased to pH 3.99 at the breakpoint as the column attained saturation, where no more H3O+ adsorption occurred (Fig. 14). At the exhaustion point, the equilibrium pH was similar to the initial pH (4.5) (Fig. 14). This confirmed that no further Pb2+ uptake occurred beyond the exhaustion point. Similar observations were reported earlier.89
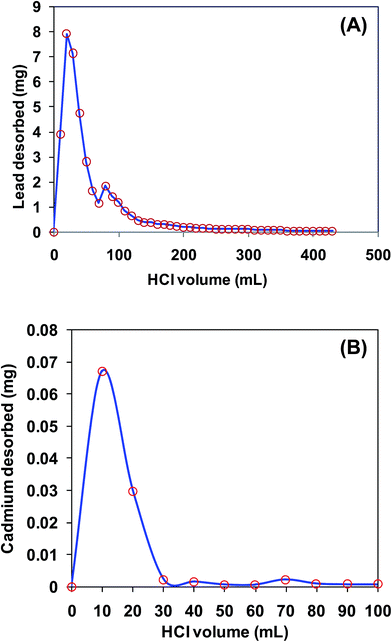
Lead desorption from KPP was performed using 10 mL increments of 0.1 N HCl at the same flow rate and bed height (Fig. 15). About 85% of total Pb2+ desorption was achieved using first ten aliquots (total 100 mL) of HCl. The remaining Pb2+ was desorbed in successive increments.
Cadmium desorption was performed in batch mode using 10 mL increments of 0.1 N HCl. Initially, 50 mL of 100 mg L−1 Cd2+ solution (pH 5.0) was agitated with 4 g L−1 KPP for 24 h (Fig. 15). The suspension was then filtered and KPP biosorbent was desorbed using 10 mL 0.1 N HCl. Approximately 63% of the total cadmium desorption was achieved in first 10 aliquot (total 10 mL) of HCl. The KPP and MKPP biosorbents were highly stable under acidic aqueous medium. Both KPP and MKPP samples were suspended in acidic water (0.1, 0.2, 0.5, 1 and 2 N HCl). No significant leaching of iron was observed during the period of twelve hours.
4. Conclusions
Bauhinia purpurea (Kaniar) pods were dried, powdered and utilized for cadmium and lead removal. Bauhinia purpurea (Kaniar) pod powders (KPP) were converted into magnetic Bauhinia purpurea (Kaniar) powders (MKPP) by magnetite precipitation onto KPP. KPP and MKPP were characterized and used for Cd2+ and Pb2+ sorptive removal. Optimum removal occurred at pH 5.0 and 4.5 for Cd2+ and Pb2+, respectively. Cd2+ and Pb2+ sorption mechanisms were established. Sorption equilibrium and dynamic studies were conducted. Among two parameter models, the Langmuir equation best described Cd2+ and Pb2+ adsorption, with capacities of 11.1 and 4.8 mg g−1 for Cd2+ and 24.0 and 20.0 mg g−1 for Pb2+ obtained on KPP and MKPP, respectively. Among three parameter models, Redlich–Peterson and Radke–Prausnitz equations were best fitted to Cd2+ sorption and Sips model best fitted to Pb2+ sorption data. Langmuir adsorption capacities of KPP and MKPP for Pb2+ and Cd2+ were comparable to other biosorbents (Table 7). Sorption dynamics data was obtained and best fitted to pseudo-second order kinetics for Cd2+ and Pb2+. Chemisorption was the rate controlling mechanism. Adsorption thermodynamics parameters were calculated (Table 4). Cd2+ and Pb2+ adsorption was spontaneous. Cd2+ adsorption was exothermic whereas Pb2+ sorption was endothermic as evidenced by the ΔH° values. Cd2+ and Pb2+ were successfully removed in a multi-ion aqueous environment of Cd2+, Pb2+, and Cu2+. Removal of Cd2+ and Pb2+ from actual groundwater using KPP and MKPP was also demonstrated.| Biosorbent | Initial pH | Temp. (°C) | Conc. range (mg L−1) | Langmuir adsorption capacity (mg g−1) | Reference |
|---|---|---|---|---|---|
| [A] Pb2+ | |||||
| KPP | 4.5 | 25 | 5–100 | 16.37 | This study |
| MKPP | 4.5 | 25 | 5–100 | 14.14 | This study |
| Banana peels | 5.0 | 25 | 30–80 | 2.2 | 90 |
| Ground nut husk modified with Gaur gum | 5.0 | 25 | 20–100 | 9.8 | 91 |
| Eupatorium adenophorum Spreng | 5.0 | 26 | 10–50 | 3.5 | 92 |
| Poplar tree branch | 4.0 | 25 | 1–10 | 1.7 | 93 |
| Pomegranate peel | 5.6 | 26 | 10–50 | 13.9 | 94 |
| Saccharomyces cerevisiae | — | — | — | 41.9 | 95 |
| S. polyrhiza biomass | 4.0 | 20 | 100–160 | 124.0 | 96 |
| Polyamic acid grafted bakers's yeast biomass | — | — | — | 204.5 | 97 |
| Nitrilotriacetic acid anhydride modified ligno-cellulosic material | 4.0 | 25 | 20–600 | 304 | 20 |
| 30 | 309 | ||||
| 40 | 326 | ||||
| Waste biomass from biotrickling filters | 5.0 | 25 | 10–200 | 160 | 82 |
![[thin space (1/6-em)]](https://www.rsc.org/images/entities/char_2009.gif) |
|||||
| [B] Cd2+ | |||||
| KPP | 5.0 | 25 | 2–100 | 11.1 | This study |
| MKPP | 5.0 | 25 | 2–100 | 4.8 | This study |
| Moringa oleifera Lamarck seed | 6.5 | — | 10–50 | 1.4 | 98 |
| Rice husk | 6.6–6.8 | 28–30 | — | 8.6 | 99 |
| Coconut copra | 6.0 | 26 | 10.5–201 | 4.9 | 7 |
| 38 | 4.7 | ||||
| 50 | 2.7 | ||||
| 60 | 2.0 | ||||
| Caulerpa lentillifera | 5 | 21 | — | 4.9 | 100 |
| 4 | 4.7 | ||||
| 3 | 2.0 | ||||
| Eucalyptus bark | 5.0 | 30 | 25–300 | 11.60 | 101 |
| Banana peels | 3.0 | 25 | 30–80 | 5.71 | 90 |
| Saccharomyces cerevisiae | — | — | — | 41.9 | 95 |
| S. polyrhiza biomass | 4.0 | 20 | 100–160 | 124.0 | 96 |
| Polyamic acid grafted bakers's yeast biomass | — | — | — | 204.5 | 97 |
| Nitrilotriacetic acid anhydride modified ligno-cellulosic material | 3.8 | 25 | 20–500 | 143 | 20 |
| 30 | 151 | ||||
| 40 | 163 | ||||
Fixed-bed Pb2+ removal using KPP exhibited a column capacity of 18.8 mg g−1. Regeneration of spent KPP in the column using 0.1 N HCl gave an 85% recovery of total Pb2+ using the first ten aliquots of HCl and the remaining Pb2+ was recovered in further increments.
Acknowledgements
One of the authors, RS, thankfully acknowledges the financial support for this work provided by CSIR. Authors are also thankful to University Grant Commission (UGC), New Delhi for providing the financial assistance under 21st Century Indo-US Research Initiative 2014 to Jawaharlal Nehru University, New Delhi and Mississippi State University, USA in the project “Clean Energy and Water Initiatives” [UGC No. F.194-1/2014(IC)]. One of the authors (DM) is also thankful to Jawaharlal Nehru University for providing financial assistance under Second phase of University with Potential of Excellence (UPOE II) grant (ID 189). Authors also acknowledge the funding support from DST PURSE, Government of India. The study is also supported by Indo-Sri Lankan joint research project grant (No. INT/SL/12/P-008) provided by Department of Science and Technology (DST), Government of India.References
- V. K. Singh, D. S. Bikundia, A. Sarswat and D. Mohan, Environ. Monit. Assess., 2012, 184, 4473–4488 CrossRef CAS PubMed.
- J. Fawell and M. J. Nieuwenhuijsen, Br. Med. Bull., 2003, 68, 199–208 CrossRef CAS PubMed.
- S. Chouhan and S. J. S. Flora, Indian J. Exp. Biol., 2010, 48, 666–678 CAS.
- M. Kumari, C. U. Pittman Jr and D. Mohan, J. Colloid Interface Sci., 2015, 442, 120–132 CrossRef CAS PubMed.
- D. Mohan, H. Kumar, A. Sarswat, M. Alexandre-Franco and C. U. Pittman Jr, Chem. Eng. J., 2014, 236, 513–528 CrossRef CAS.
- M. Tsezos, Hydrometallurgy, 2001, 59, 241–243 CrossRef CAS.
- Y.-S. Ho and A. E. Ofomaja, Biochem. Eng. J., 2006, 30, 117–123 CrossRef CAS.
- D. Mohan, C. U. Pittman Jr, M. Bricka, F. Smith, B. Yancey, J. Mohammad, P. H. Steele, M. F. Alexandre-Franco, V. Gómez-Serrano and H. Gong, J. Colloid Interface Sci., 2007, 310, 57–73 CrossRef CAS PubMed.
- Environmental Inorganic Chemistry: Properties, Processes, and Estimation Methods, ed. W. J. Lyman, W. F. Reehl and D. H. Rosenblatt, Pergamon press, New York, 1988 Search PubMed.
- P. Grover, P. V. Rekhadevi, K. Danadevi, S. B. Vuyyuri, M. Mahboob and M. F. Rahman, Int. J. Hyg. Environ. Health, 2010, 213, 99–106 CrossRef CAS PubMed.
- E. M. Mager, K. V. Brix, K. R. M. Gerdes, A. C. Ryan and M. Grosell, Ecotoxicol. Environ. Saf., 2011, 74, 238–243 CrossRef CAS PubMed.
- L. Järup, Br. Med. Bull., 2003, 68, 167–182 CrossRef.
- WHO, WHO Guidelines for Drinking-Water Quality, WHO Press, Geneva, 4th edn, 2011 Search PubMed.
- BIS, Bureau of Indian Standard, Indian standard specification for drinking water, BIS, Delhi, IS 10500, 1991, pp. 2–4 Search PubMed.
- BIS, Drinking Water Specification, Second Revision IS: 10500: 2012, Bureau of Indian Standards, New Delhi, India, 2012 Search PubMed.
- K. S. Low, C. K. Lee and S. C. Liew, Process Biochem., 2000, 36, 59–64 CrossRef CAS.
- K. Y. Foo and B. H. Hameed, J. Hazard. Mater., 2010, 175, 1–11 CrossRef CAS PubMed.
- S. K. R. Yadanaparthi, D. Graybill and R. v. Wandruszka, J. Hazard. Mater., 2009, 171, 1–15 CrossRef CAS PubMed.
- O. Yavuz, R. Guzel, F. Aydin, I. Tegin and R. Ziyadanogullari, Pol. J. Environ. Stud., 2007, 16, 467 CAS.
- Y. Huang, C. Yang, Z. Sun, G. Zeng and H. He, RSC Adv., 2015, 5, 11475–11484 RSC.
- J. Wang and C. Chen, Biotechnol. Adv., 2006, 24, 427–451 CrossRef CAS PubMed.
- J. Wang and C. Chen, Biotechnol. Adv., 2009, 27, 195–226 CrossRef CAS PubMed.
- A. Jusoh, L. S. Shiung, N. a. Ali and M. J. M. M. Noor, Desalination, 2007, 206, 9–16 CrossRef CAS.
- T. Robinson, G. McMullan, R. Marchant and P. Nigam, Bioresour. Technol., 2001, 77, 247–255 CrossRef CAS PubMed.
- E. Fourest, C. Canal and J. C. Roux, FEMS Microbiol. Rev., 1992, 14, 325–332 CrossRef.
- K. Mohanty, M. Jha, B. C. Meikap and M. N. Biswas, Chem. Eng. J., 2006, 117, 71–77 CrossRef CAS.
- A. Moubarik and N. Grimi, Food Res. Int., 2015, 73, 169–175 CrossRef CAS.
- C. Pennesi, C. Totti, T. Romagnoli, B. Bianco and I. D. Michelis, Water Environ. Res., 2012, 84, 9–16 CrossRef CAS PubMed.
- S. Balaji, T. Kalaivani, C. Rajasekaran, M. Shalini, R. Siva, R. K. Singh and M. A. Akthar, Clean: Soil, Air, Water, 2014, 42, 1790–1797 CrossRef CAS.
- D. Sharmila and P. Muthusamy, J. Chem. Pharm. Res., 2013, 5, 10–13 CAS.
- A. Jakóbik-Kolon, A. K. Milewski, K. Mitko and A. Lis, Sep. Sci. Technol., 2014, 49, 1679–1688 CrossRef.
- Z. R. Holan and B. Volesky, Appl. Biochem. Biotechnol., 1995, 53, 133–146 CrossRef CAS.
- C. K. Jain, D. S. Malik and A. K. Yadav, Environ. Processes, 2016, 3, 495–523 CrossRef CAS.
- P. Krishen, Trees of Delhi: a field guide, Penguin Books, India, 2006 Search PubMed.
- T. K. Lim, Bauhinia purpurea, in Edible Medicinal And Non-Medicinal Plants, Springer, Netherlands, 2014, pp. 743–753 Search PubMed.
- H. V. Annegowda, M. N. Mordi, S. Ramanathan, M. R. Hamdan and S. M. Mansor, Food Analytical Methods, 2012, 5, 226–233 CrossRef.
- E. F. Fang, C. S. F. Bah, J. H. Wong, W. L. Pan, Y. S. Chan, X. J. Ye and T. B. Ng, Arch. Toxicol., 2012, 86, 293–304 CrossRef CAS PubMed.
- B. S. Negi, B. P. Dave and Y. K. Agarwal, Indian J. Microbiol., 2012, 52, 360–365 CrossRef CAS PubMed.
- N. Neelapu and S. Muvvala, Int. J. Res. Phytochem. Pharmacol., 2012, 1, 97–102 Search PubMed.
- A. Kanwal, S. A. Mirza and M. Farhan, Pak. J. Bot., 2015, 47, 275–280 CAS.
- K. Polipalli and K. Pulipati, Int. J. Sci. Eng. Res., 2013, 4, 1244–1252 Search PubMed.
- E. P. Barrett, L. G. Joyner and P. P. Halenda, J. Am. Chem. Soc., 1951, 73, 373–380 CrossRef CAS.
- M. M. Dubinin, in Progress in Surface and Membrane Science, ed. D. A. Cadenhead, J. F. Danielli and M. D. Rosenberg, Academic Press, NewYork and London, 1975, pp. 1–70 Search PubMed.
- M. M. Dubinin and G. M. Plavnik, Carbon, 1968, 6, 183–192 CrossRef CAS.
- ASTM-D1762-84, ASTM International, Standard test method for chemical analysis of wood charcoal, ASTM International, Pennsylvania, 2007 Search PubMed.
- H. M. F. Freundlich, J. Phys. Chem., 1906, 57, 385–471 CAS.
- I. Langmuir, J. Am. Chem. Soc., 1916, 38, 2221–2295 CrossRef CAS.
- M. I. Temkin and V. Pyzhev, Acta physicochimica U.R.S.S., 1940, 12, 217–222 Search PubMed.
- R. Sips, J. Chem. Phys., 1948, 16, 490–495 CrossRef CAS.
- O. Redlich and D. L. Peterson, J. Phys. Chem., 1959, 63, 1024 CrossRef CAS.
- C. J. Radke and J. M. Prausnitz, Ind. Eng. Chem. Fundam., 1972, 11, 445–451 CAS.
- J. Toth, Acta Chim. Acad. Sci. Hung., 1971, 69, 311–317 CAS.
- R. Koble and T. Corrigan, Ind. Eng. Chem. Fundam., 1952, 44, 383–387 CrossRef CAS.
- S. Lagergren, Handlingar, 1898, 24, 1–7 Search PubMed.
- Y. S. Ho and G. McKay, Process Biochem., 1999, 34, 451 CrossRef CAS.
- D. Mohan and S. Chander, J. Colloid Interface Sci., 2006, 299, 76–87 CrossRef CAS PubMed.
- N. F. Cardoso, E. C. Lima, I. S. Pinto, C. V. Amavisca, B. Royer, R. B. Pinto, W. S. Alencar and S. F. P. Pereira, J. Environ. Manage., 2011, 92, 1237–1247 CrossRef CAS PubMed.
- S. Nanda, P. Mohanty, K. K. Pant, S. Naik, J. A. Kozinski and A. K. Dalai, BioEnergy Res., 2013, 6, 663–677 CrossRef CAS.
- A. C. Correa, E. D. M. Teixeira, L. A. Pessan and L. H. C. Mattoso, Cellul. Chem. Technol., 2010, 17, 1183–1192 CAS.
- S. V. Vassilev, D. Baxter, L. K. Andersen, C. G. Vassileva and T. J. Morgan, Fuel, 2012, 94, 1–33 CrossRef CAS.
- K. Umamaheswaran and V. S. Batra, Fuel, 2008, 87, 628–638 CrossRef CAS.
- T. Madrakian, A. Afkhami, M. Ahmadi and H. Bagheri, J. Hazard. Mater., 2011, 196, 109–114 CrossRef CAS PubMed.
- Q. Peng, Y. Liu, G. Zeng, W. Xu, C. Yang and J. Zhang, J. Hazard. Mater., 2010, 177, 676–682 CrossRef CAS PubMed.
- A. B. Albadarin, C. Mangwandi, G. M. Walker, S. J. Allen, M. N. M. Ahmada and M. Khraisheh, J. Environ. Manage., 2013, 114, 190–201 CrossRef CAS PubMed.
- J. R. Koduru, Y.-Y. Chang, J.-K. Yang and I.-S. Kim, Sci. World J., 2013, 2013, 1–14 CrossRef PubMed.
- M. Namdeo and S. K. Bajpai, Electron. J. Environ., Agric. Food Chem., 2009, 8, 3082–3094 Search PubMed.
- K. Chitra and G. Annadurai, Biocybern. Biomed. Eng., 2014, 34, 230–237 CrossRef.
- V. K. Singh and K. R. C. Reddy, Int. J. Res. Phytochem. Pharmacol., 2015, 3, 386–390 Search PubMed.
- S. S. Banerjee and D.-H. Chen, J. Hazard. Mater., 2007, 147, 792–799 CrossRef CAS PubMed.
- S. Yorgun and D. Yıldız, J. Anal. Appl. Pyrolysis, 2015, 114, 68–78 CrossRef CAS.
- M. Fereidouni, A. Daneshi and H. Younes, J. Hazard. Mater., 2009, 168, 1437–1448 CrossRef CAS PubMed.
- A. M. Petrosyan, Vib. Spectrosc., 2007, 43, 284–289 CrossRef CAS.
- H. Schulz and M. Baranska, Vib. Spectrosc., 2007, 43, 13–25 CrossRef CAS.
- S. H. Kim, C. M. Lee and K. Kafle, Korean J. Chem. Eng., 2013, 30, 2127–2141 CrossRef CAS.
- A. Ahmad, M. Rafatullah, O. Sulaiman, M. H. Ibrahim, Y. Y. Chii and B. M. Siddique, Desalination, 2009, 247, 636–646 CrossRef CAS.
- D. Asandei, L. Bulgariu and E. Bobu, Cellul. Chem. Technol., 2009, 43, 211–216 CAS.
- K. Chojnacka, A. Chojnacki and H. Gorecka, Chemosphere, 2005, 59, 75–84 CrossRef CAS PubMed.
- Y. Ding, D. Jing, H. Gong, L. Zhou and X. Yang, Bioresour. Technol., 2012, 114, 20–25 CrossRef CAS PubMed.
- T. Kumar and K. S. Chandrashekar, Res. J. Med. Plants, 2011, 5, 420–431 CrossRef CAS.
- Z. Wang, G. Liu, H. Zheng, F. Li, H. H. Ngo, W. Guo, C. Liu, L. Chen and B. Xing, Bioresour. Technol., 2015, 177, 308–317 CrossRef CAS PubMed.
- W.-J. Liu, F.-X. Zeng, H. Jiang and H.-Q. Yu, Cellul. Chem. Technol., 2011, 50, 5920–5926 CAS.
- Y. Cheng, C. Yang, H. He, G. Zeng, K. Zhao and Z. Yan, J. Environ. Eng., 2016, 142, C4015001, DOI:10.1061/(asce)ee.1943-7870.0000956.
- C. Yang, J. Wang, M. Lei, G. Xie, G. Zeng and S. Luo, J. Environ. Sci., 2010, 22, 675–680 CrossRef CAS.
- T. A. Davis, B. Volesky and A. Mucci, Water Res., 2003, 37, 4311–4330 CrossRef CAS PubMed.
- K. R. Hall, L. C. Eagleton, R. Acrivos and T. Vermeulen, Ind. Eng. Chem. Fundam., 1966, 5, 212–223 CAS.
- D. Mohan, A. Sarswat, V. K. Singh, M. Alexandre-Franco and C. U. Pittman Jr, Chem. Eng. J., 2011, 172, 1111–1125 CrossRef CAS.
- A. Sarswat and D. Mohan, RSC Adv., 2016, 6, 85390–85410 RSC.
- W. J. Weber Jr, Physicochemical Processes for Water Quality Control, Wiley, 1972 Search PubMed.
- A. H. Hawari and C. N. Mulligan, Process Biochem., 2006, 41, 187–198 CrossRef CAS.
- J. Anwar, U. Shafique, Waheed-uz-Zaman, M. Salman, A. Dar and S. Anwar, Bioresour. Technol., 2010, 101, 1752–1755 CrossRef CAS PubMed.
- R. Ahmad and S. Haseeb, Groundwater for Sustainable Development, 2015, vol. 1, pp. 41–49 Search PubMed.
- S. Guo, L. Z. Wei Li, J. Peng, H. Xia and S. Zhang, Process Saf. Environ. Prot., 2009, 87, 343–351 CrossRef CAS.
- M. S. Al-Masri, Y. A. B. Al-Akel and T. Al-Naama, Appl. Biochem. Biotechnol., 2010, 160, 976–987 CrossRef CAS PubMed.
- E. S. Z. El-Ashtoukhy, N. K. Amin and O. Abdelwaha, Desalination, 2008, 223, 162–173 CrossRef CAS.
- M. Al-Saraj, M. S. Abdel-Latif, I. El-Nahal and R. Barak, J. Non-Cryst. Solids, 1999, 248, 37–40 CrossRef.
- M. D. Meitei and P. N. V. Majeti, Ecol. Eng., 2014, 71, 308–317 CrossRef.
- J. Yu, M. Tong, X. Sun and B. Li, React. Funct. Polym., 2007, 67, 564–572 CrossRef CAS.
- M. Rajeswari, P. Agrawal, S. Pavithra, Priya, G. R. Sandhya and G. M. Pavithra, Biotechnol. Bioprocess Eng., 2013, 18, 321–325 CrossRef CAS.
- U. Kumar and M. Bandyopadhyay, Bioresour. Technol., 2006, 97, 104–109 CrossRef CAS PubMed.
- P. Pavasant, R. Apiratikul, V. Sungkhum, P. Suthiparinyanont, S. Wattanachira and T. F. Marhaba, Bioresour. Technol., 2006, 97, 2321–2329 CrossRef CAS PubMed.
- I. Ghodbane, L. Nouri, O. Hamdaoui and M. Chiha, J. Hazard. Mater., 2008, 152, 148–158 CrossRef CAS PubMed.
Footnote |
| † Electronic supplementary information (ESI) available. See DOI: 10.1039/c6ra25295h |
| This journal is © The Royal Society of Chemistry 2017 |

